
The cryptocurrency sector spent the day with cryptocurrencies trying to find consolidation points as preparation for Bitcoin’s next move. Bitcoin is currently trading for $13.049, representing an increase of 0.61% on the day. Meanwhile, Ethereum lost 2.74% on the day, while XRP lost 1.73%.
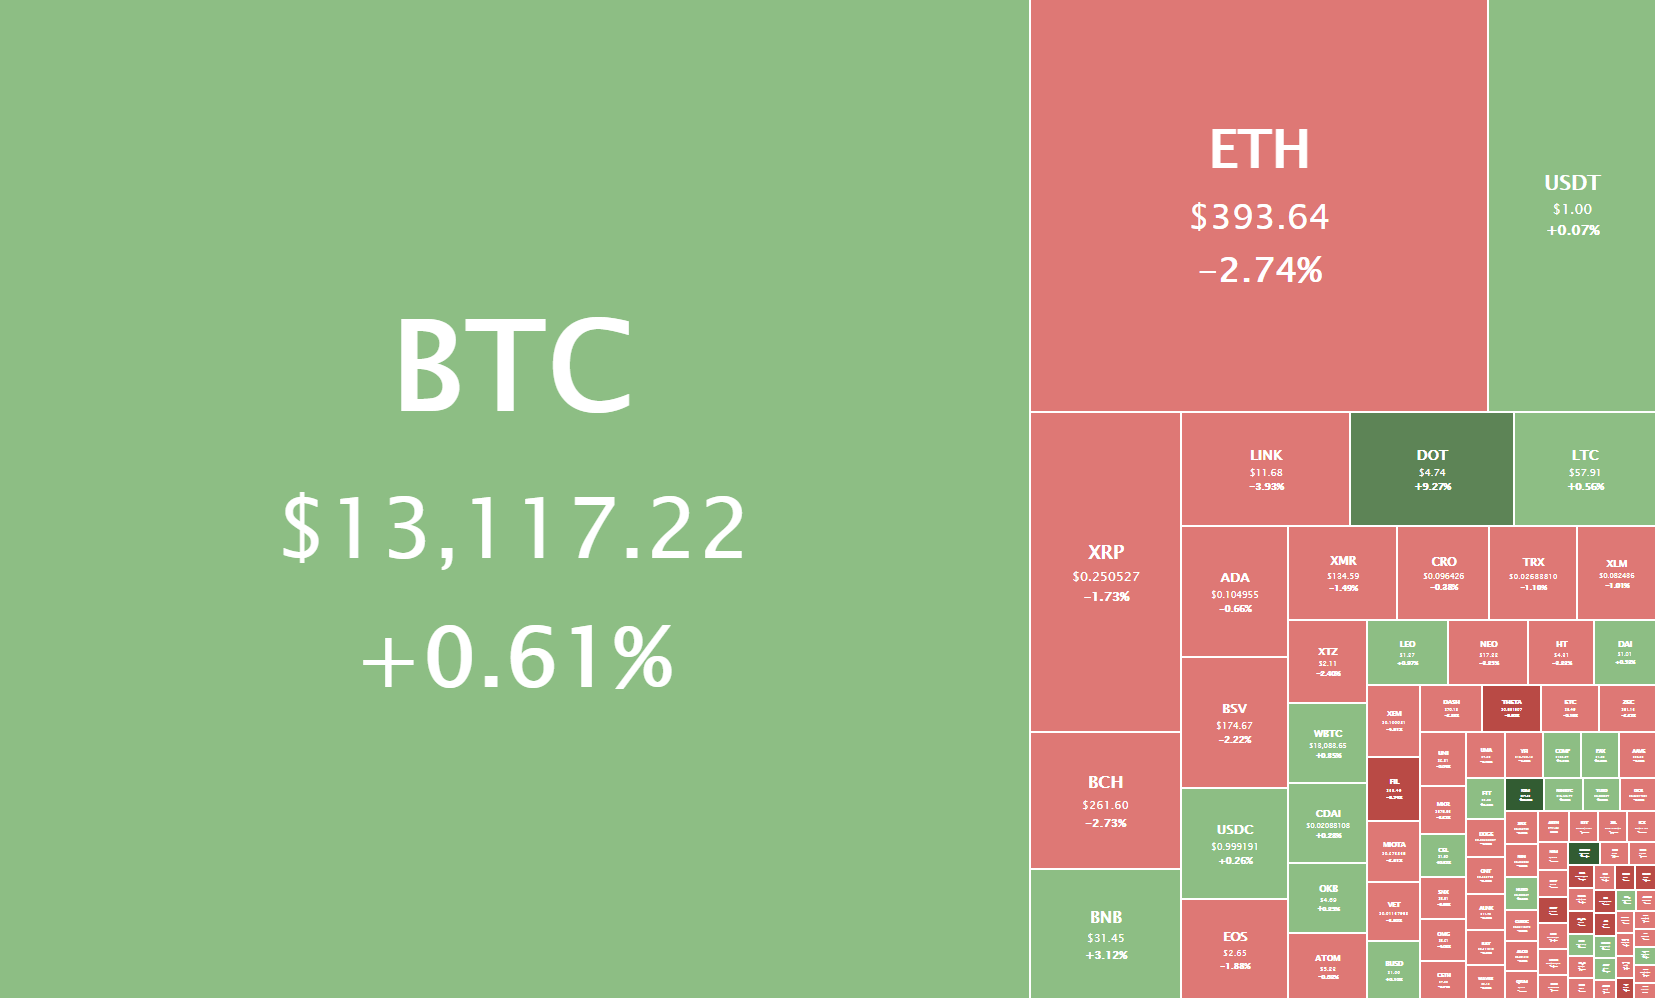
Daily Crypto Sector Heat Map
If we check out the top 100 cryptocurrencies, Flexacoin gained an astonishing 144.03% in the past 24 hours, making it the crypto to gain the most in a day. Kusama (28.07%) and Ocean Protocol (20.44%) also did great. On the other hand, Quant lost 13.61%, making it the most prominent daily loser. It is followed by Reserve Rights’ loss of 10.28% and Cybervein’s loss of 8.60%.
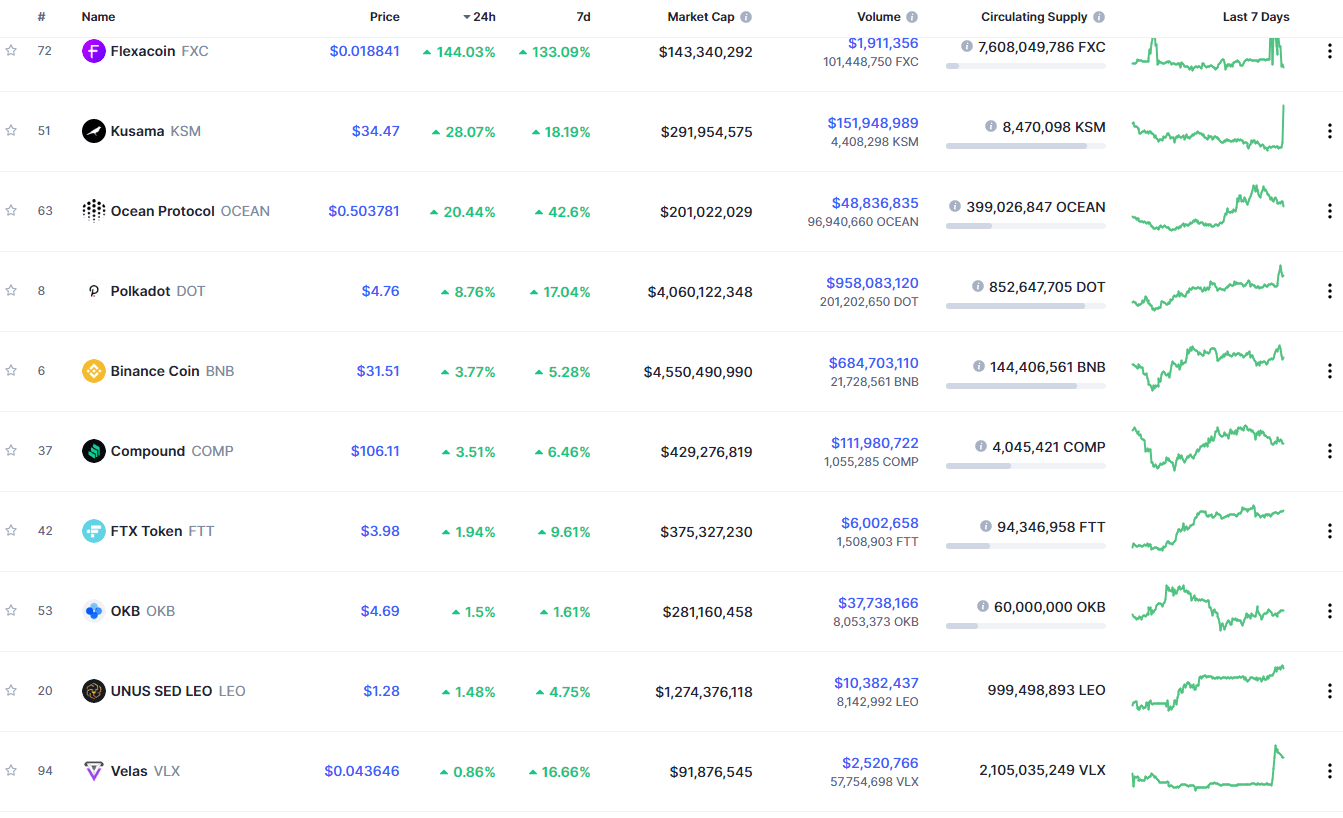
Top 10 24-hour Performers (Click to enlarge)
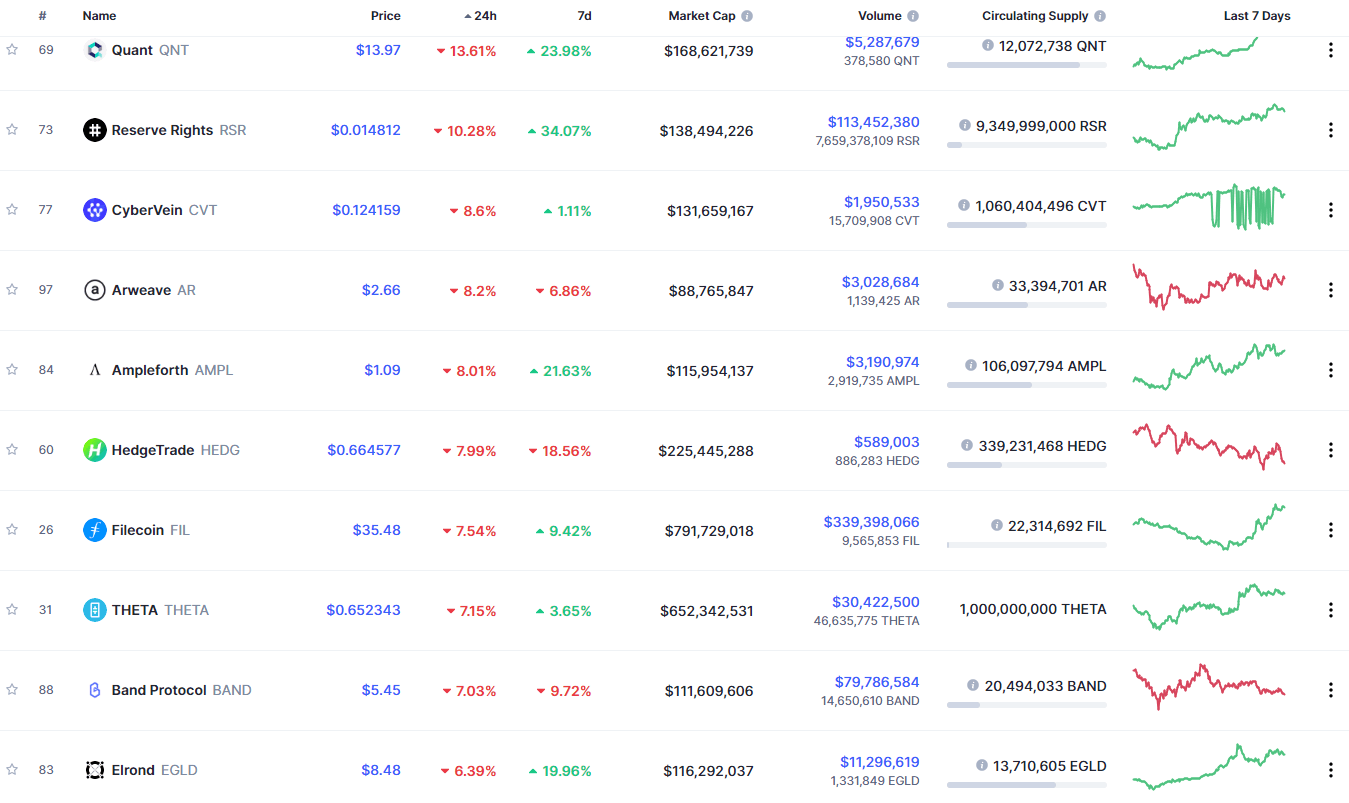
Bottom 10 24-hour Performers (Click to enlarge)
Bitcoin’s market dominance level had increased slightly since we last reported, with its value is currently 61.6%. This value represents a 0.5% difference to the upside when compared to when we last reported.
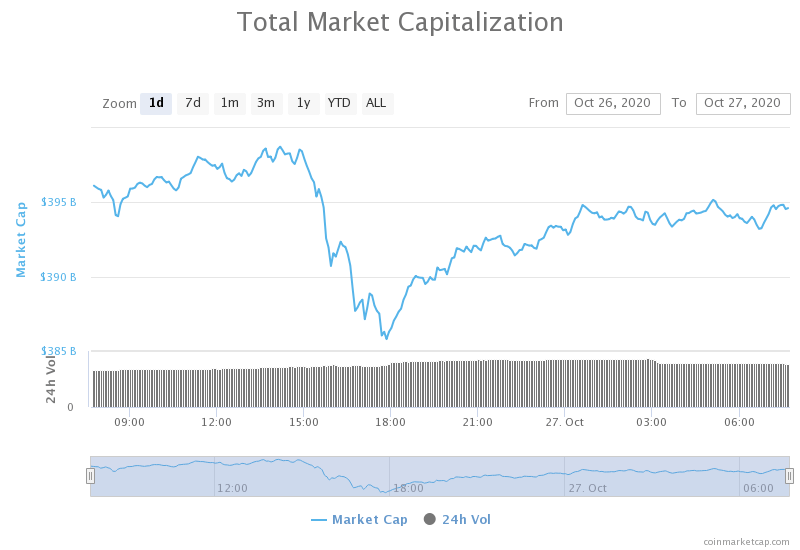
Daily Crypto Market Cap Chart
The crypto sector capitalization has stayed at the same place since we last reported. Its current value is $394.54 billion, representing an increase of $1.86 billion compared to our previous report.
_______________________________________________________________________
What happened in the past 24 hours?
_______________________________________________________________________
- Swiss central bank, BIS, plan to test digital currency by the end of this year (The Block)
- Why PayPal might be interested in BitGo (The Block)
- 3 critical points from JP Morgan’s bullish Bitcoin report (Cryptoslate)
- Uniswap volumes bump to $2 billion after attack on DeFi project Harvest Finance (Cryptoslate)
- Why major Bitcoin futures exchange Bybit is integrating Chainlink price feed (Cryptoslate)
- Massive Supply Barrier Is Keeping Cardano Prices From Breaking Out (Cryptobriefing)
- XRP on Shaky Ground After Dropping 6 Points in Latest Correction (Cryptobriefing)
- Number of Bitcoin ‘Whale’ Addresses at Highest Since Autumn 2016 (Coindesk)
- Exit scams and regulations disrupt global darknet markets (Cointelegraph)
- BTC hash rate slumps amid seasonal miner migration in China (Cointelegraph)
_______________________________________________________________________
Technical analysis
_______________________________________________________________________
Bitcoin
The largest cryptocurrency by market capitalization has spent the past 24 hours slowly gaining value and reaching the $13,180 mark. However, it managed to make (at the moment) the third lower high in a row, creating a short-term bearish indicator. The decaying volume, as well as an increase in sell pressure around the $13,200 level, supports the claim that Bitcoin is more likely to retrace first before moving up.
Traders should pay attention to how BTC approaches $13,180 and if it (more likely) enters a price correction phase, or if it rather (less likely) pushes past $13,180 and towards #13,900.
BTC/USD 4-hour Chart
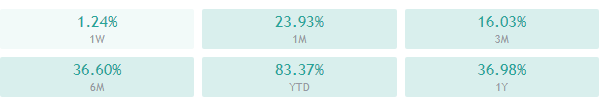
Bitcoin’s technicals are a bit more bearish than the day before, despite its price being a bit higher. Its 4-hour, daily and weekly overviews all have sell-tilted oscillators and buy-tilted moving averages, while the overall summary is slightly bullish. The monthly overview is still fully bullish.
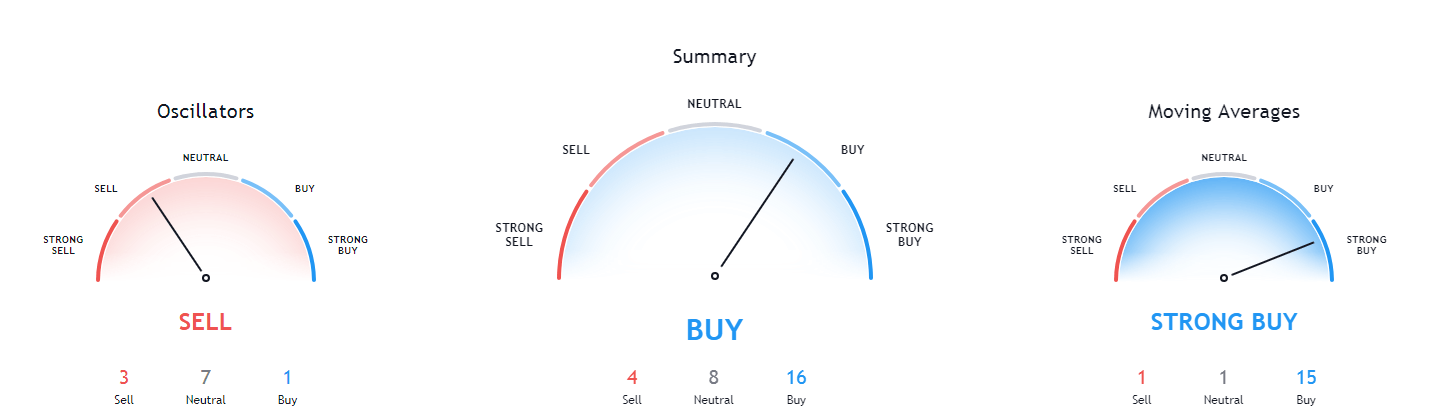
BTC/USD 1-day Technicals
Technical factors (4-hour Chart):
- Price is above both its 50-period EMA and its 21-period EMA
- Price is slightly above its middle Bollinger band
- RSI is slightly below being overbought (61.54)
- Volume is descending
Key levels to the upside Key levels to the downside
1: $13,200 1: $12,870
2: $13,900 2: $12,500
3: $14,000 3: $12,300
Ethereum
Ethereum has spent the day following its ascended trading channel but to the downside. The second-largest cryptocurrency by market cap bounced off of the $420 highs as it couldn’t pass either of the $415 and $420 resistance levels and pushed towards the downside. The move will most likely end somewhere between $400 and $378. However, if Bitcoin pushes towards the upside, Ethereum will most likely abandon its current pattern and trade alongside it.
Traders should watch for how Ethereum retraces and what it does after, as many safe trading patterns may emerge from that.
ETH/USD 4-hour Chart
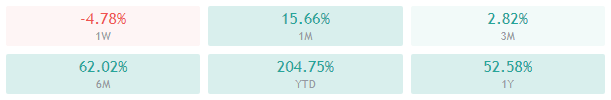
Ethereum’s technicals are quite confusing, as its 4-hour overview is completely bearish, while its daily overview is completely bullish. Its weekly and monthly overviews are tilted towards the buy-side, but the weekly one is slightly more neutral.
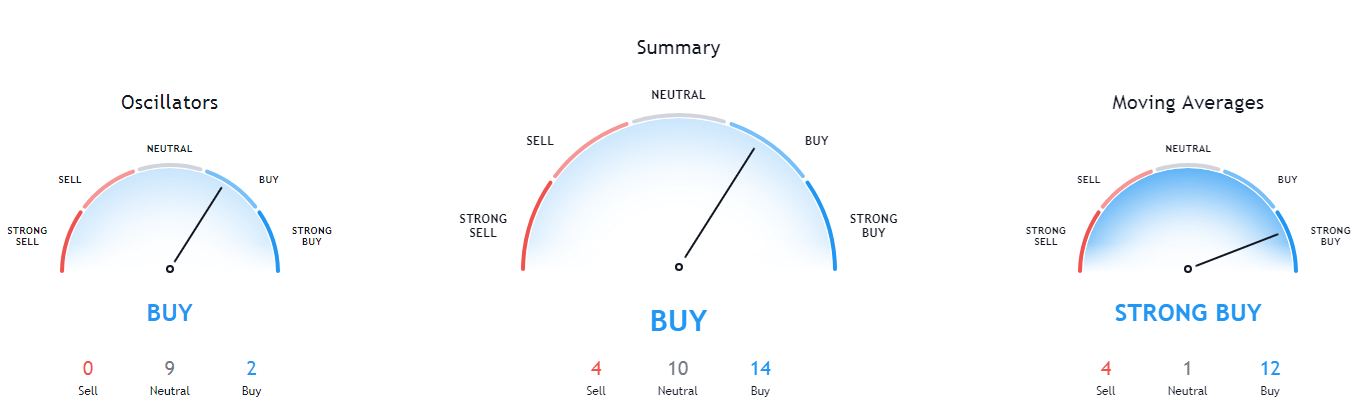
ETH/USD 1-day Technicals
Technical Factors (4-hour Chart):
- The price is below both its 50-period and its 21-period EMA
- Price is at its lower Bollinger band
- RSI is nearly oversold (38.94)
- Volume is average
Key levels to the upside Key levels to the downside
1: $415 1: $400
2: $420 2: $378
3: $435 3: $371
Ripple

The fourth-largest cryptocurrency by market cap trying to decide its direction. Its price started to fall down after it failed to break $0.26, but it was expected for the ascending trend line (yellow dotted line) to hold at least for a bit more. However, XRP quickly broke that level to the downside, opening itself towards more possibility of moving down.
On the other hand, some people call the most recent moves a bull flag and are entering long positions. While this is unlikely, all traders must be aware of and respect this stance as well before entering their own trades.
XRP/USD 4-hour Chart
XRP’s technicals split into two sides, with the 4-hour and monthly overviews being tilted towards the sell-side and daily and weekly overviews being tilted towards the bull-side (with a bit of neutrality).

XRP/USD 1-day Technicals
Technical factors (4-hour Chart):
- The price slightly below both its 50-period EMA and its 21-period EMA
- Price is between its lower and middle Bollinger band
- RSI is ascending (42.18)
- Volume is average
Key levels to the upside Key levels to the downside
1: $0.26 1: $0.2454
2: $0.266 2: $0.235
3: $0.2855 3: $0.227
Related posts
 Daily Crypto Review, Jun 19 – Bitcoin Mid-Term Bullish vs. Bearish Outlook – Explained
 Daily Crypto Review, Oct 1 – Bitcoin Fighting for $10,850; Ethereum Bulls Rallying Against All Odds
 Daily Crypto Review, Oct 8 – DeFi Bubble Popped: Token Prices Shatter on Low Trading Volumes
 Daily Crypto Review, Oct 30 – Bitcoin Bounces Back Above $13,500; XRP Breaks Crucial Support Level