
The cryptocurrency sector has rallied up and skyrocketed as PayPal announced that it will now support cryptocurrencies. Bitcoin has led the rally with an almost double-digit increase. It is currently trading for $12,886, representing an increase of 7.25% on the day. Meanwhile, Ethereum gained 6.69% on the day, while XRP gained 4.78%.

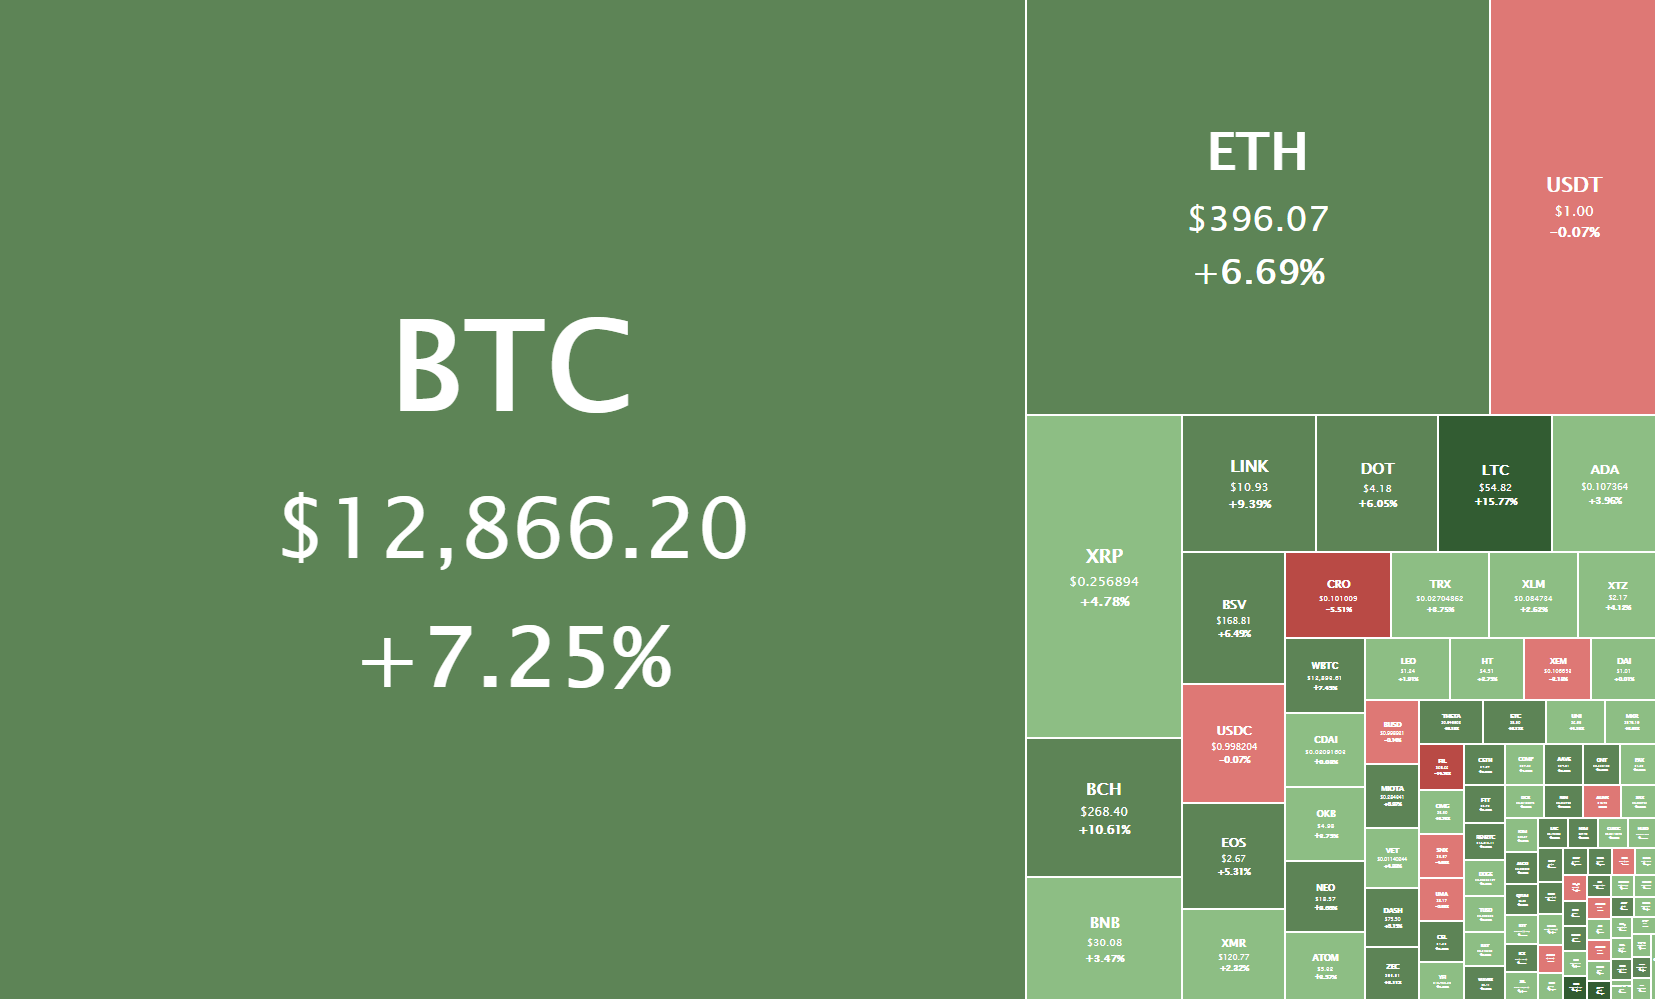
Daily Crypto Sector Heat Map
If we check out the top 100 cryptocurrencies, we can see that Reserve Rights gained 45.36% in the past 24 hours, making it the top daily gainer. Litecoin (16.03%) and Ampleforth (14.02%) also did great. On the other hand, ABBC Coin lost 18.97%, making it the most prominent daily loser. It is followed by Filecoin’s loss of 14.56% and The Midas Touch Gold’s loss of 7.03%.

Top 10 24-hour Performers (Click to enlarge)
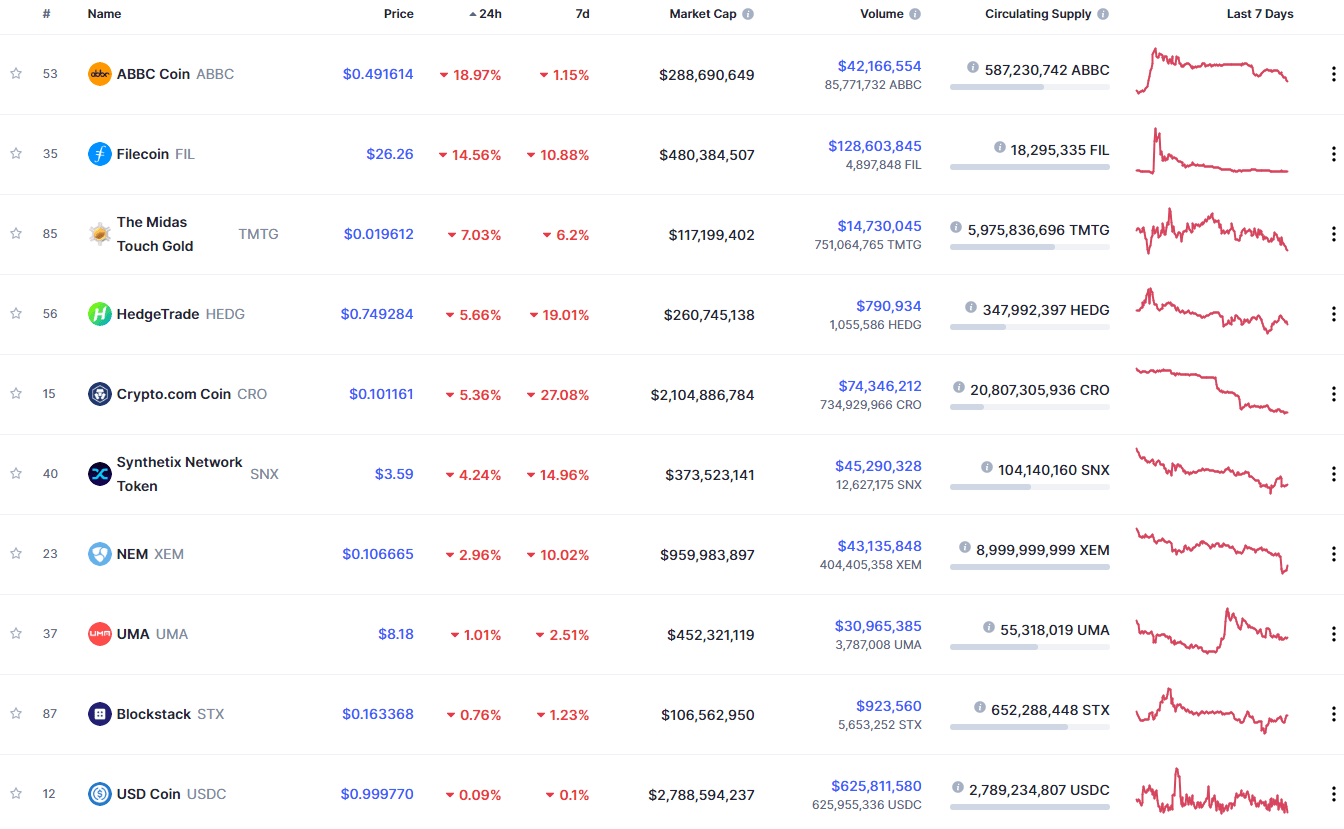
Bottom 10 24-hour Performers (Click to enlarge)
Bitcoin’s market dominance level had increased slightly since when we last reported, with its value is currently 61.2%. This value represents a 0.7% difference to the upside when compared to when we last reported.
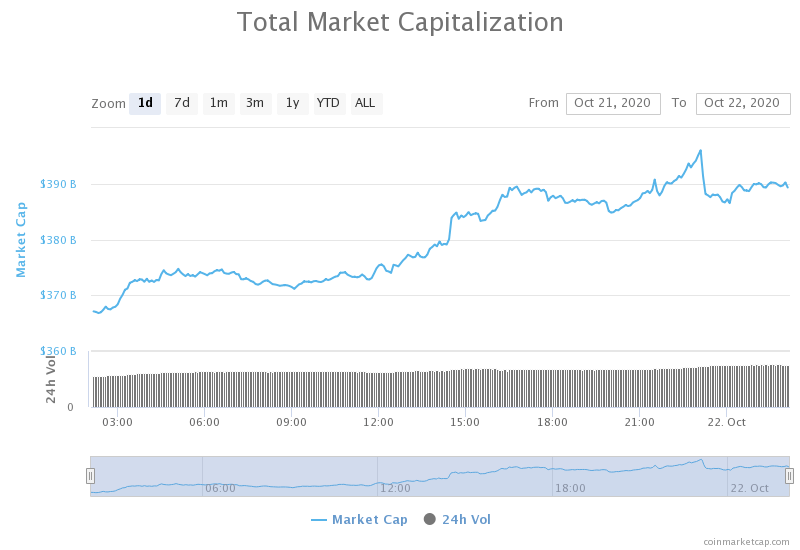
Daily Crypto Market Cap Chart
The crypto sector capitalization has experienced a huge increase since we last reported. Its current value is $390.24 billion, representing an increase of $23.98 billion compared to our previous report.
_______________________________________________________________________
What happened in the past 24 hours?
_______________________________________________________________________
- PayPal to enable users to buy, sell, and hold crypto assets, fueling strong Bitcoin momentum (Cryptoslate)
- Recently authorized patents shed light on the surveillance capabilities of China’s digital currency (The Block)
- BitMEX executives strike a positive note about the exchange’s future amid U.S. legal woes (The Block)
- CFTC officials publish new crypto advisory for futures commission merchants (The Block)
- Investors in Disbelief as Cardano Prepares to Break Out (Cryptobriefing)
- Wrapped Zcash Now Available on Ethereum (Cryptobriefing)
- Ethereum and XRP Follow Bitcoin’s Steps After Its Breakout to New Yearly Highs (Cryptobriefing)
- Bitcoin Rallies Above $13K Less Than 24 Hours After Breaking 2020 Highs (Coindesk)
- Nigeria Protests Show Bitcoin Adoption Is Not Coming: It’s Here (Coindesk)
_______________________________________________________________________
Technical analysis
_______________________________________________________________________
Bitcoin

The largest cryptocurrency by market capitalization has had quite an amazing day filled with volatility and extremely high bull presence. Fueled by PayPal’s announcement that it will enable its users to buy, sell and hold crypto, Bitcoin skyrocketed and reached as high as $13,235 before pulling back. It’s currently trying to consolidate just under the $12,870 resistance level.
Any skepticism regarding whether the bull market has started has been shattered with Bitcoin’s most recent move. However, while this move was intense, Bitcoin will need a lot of great news, adoption, and ultimately time to reach its all-time highs.
At the moment, traders should look at how Bitcoin handles the pullback and trade-off of that.
BTC/USD 1-day Chart
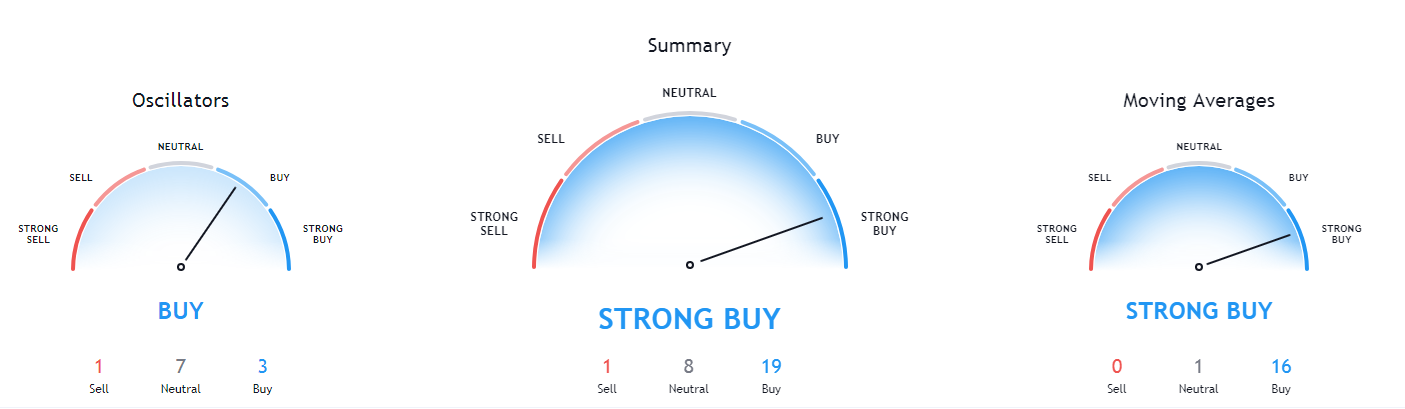
Bitcoin’s technical overview is very strongly tilted towards the buy-side on longer time-frames (weekly and monthly), while its short-term overviews are slightly more neutral.
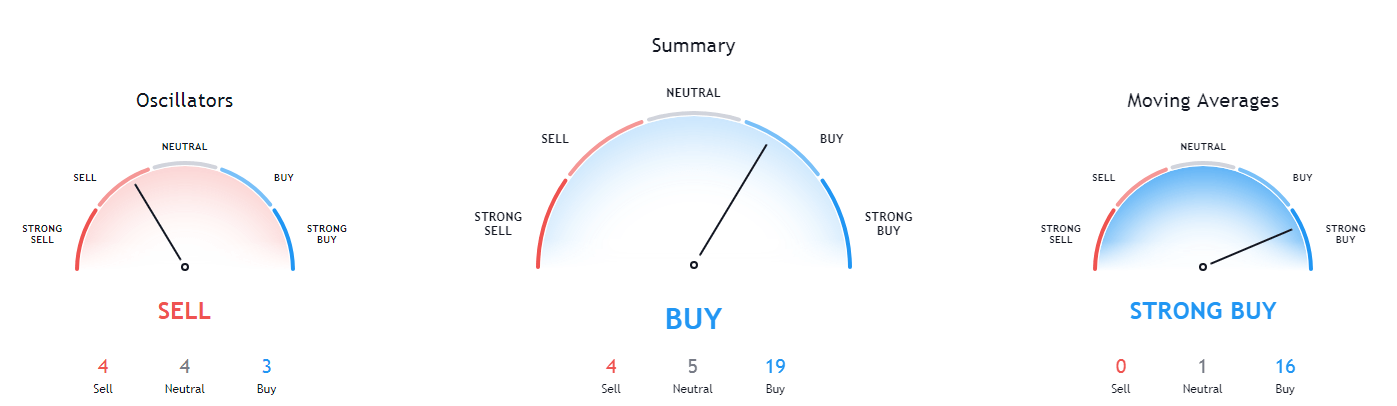
BTC/USD 1-day Technicals
Technical factors (4-hour Chart):
- Price is far above its 50-period EMA and at its 21-period EMA
- Price above its top Bollinger band
- RSI is extremely overbought (81.74)
- Volume is extremely elevated
Key levels to the upside Key levels to the downside
1: $12,870 1: $12,500
2: $13,200 2: $12,300
3: $14,000 3: $12,000
Ethereum

Ethereum has followed Bitcoin’s lead and pushed towards the upside, though with much less strength. Its price ultimately reached the $400 resistance before pulling back slightly. It is currently trying to consolidate right under the $400 level, which is still a great increase in price since yesterday when Ether was fighting to stay above $378.
Ethereum traders should pay attention to how the second-largest cryptocurrency by market cap handles its immediate resistance level, as well as an eventual further pullback.
ETH/USD 4-hour Chart
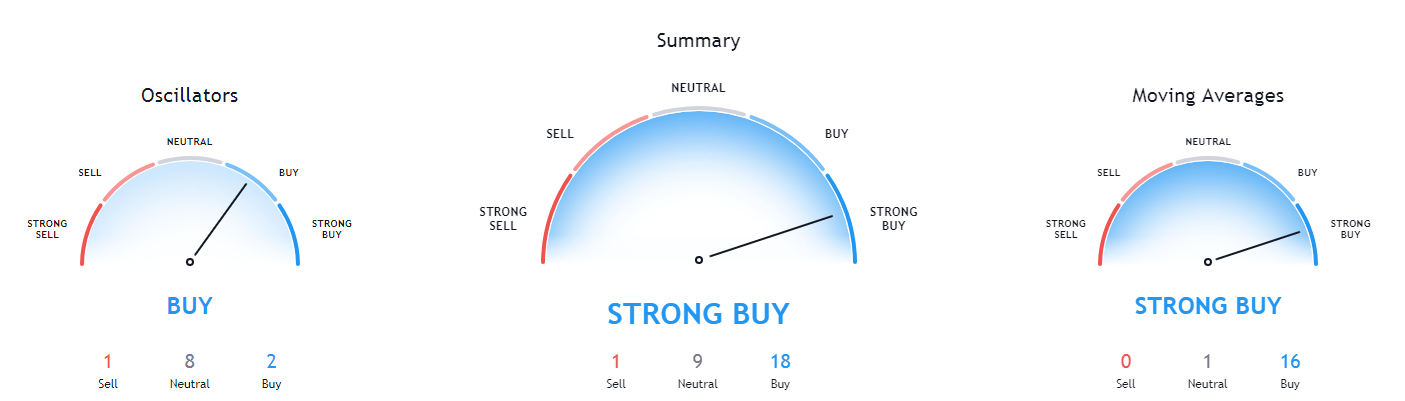
Ethereum’s technicals on all time-frames show bullishness, with its 4-hour and long-term technicals being a bit more tilted towards the neutral position, while its 1-day overview is completely bullish.
ETH/USD 1-day Technicals
Technical Factors (4-hour Chart):
- The price is far above its 50-period and its 21-period EMA
- Price is at the top Bollinger band
- RSI is close to overbought (66.91)
- Volume is elevated
Key levels to the upside Key levels to the downside
1: $400 1: $378
2: $415 2: $371
3: $420 3: $360
Ripple

The fourth-largest cryptocurrency by market cap has, like yesterday, used the momentum that Bitcoin has provided to push further up. Its price has established itself above the $0.2454 support level and pushed past $0.25. However, the $0.26 resistance level has not fallen, and XRP is now consolidating at the ~$0.255 level.
XRP’s upside is a zone of strong resistance, which this cryptocurrency will hardly surpass without Bitcoin’s push. XRP traders should pay attention to Bitcoin’s moves while focusing on XRP’s moves towards the downside.
XRP/USD 4-hour Chart
XRP’s technicals have changed quite a bit since our last report. Its 4-hour, 1-day, and weekly overviews are strongly tilted towards the buy-side, while its monthly overview is still bearish with a slight hint of neutrality.
XRP/USD 1-day Technicals
Technical factors (4-hour Chart):
- The price far above its 50-period EMA and above its 21-period EMA
- Price is at its top Bollinger band
- RSI is close to overbought (65.61)
- Volume is below average
Key levels to the upside Key levels to the downside
1: $0.26 1: $0.2454
2: $0.266 2: $0.235
3: $0.2855 3: $0.227
Related posts
 Daily Crypto Review, Feb 6 – Is this the Start of the Altcoin Season?
 Daily Crypto Review, Feb 7 – Bitcoin Futures over 10,000; US crypto regulators stalling
 Daily Crypto Review, July 14 – IRS Violated Taxpayers’ “Bill of Rights”; The UK Wants a Digital Currency
 Daily Crypto Review, Nov 18 – Bitcoin Encounters Heavy Resistance at $18,500: What Happens Next?