The cryptocurrency sector has spent the day mostly stable and looking at Bitcoin as it kept pushing towards highs unseen after the bull run of late 2017. The largest cryptocurrency by market cap is currently trading for $17.829, representing an increase of 6.64% on the day. Meanwhile, Ethereum gained 2.00% on the day, while XRP lost 1.90%.
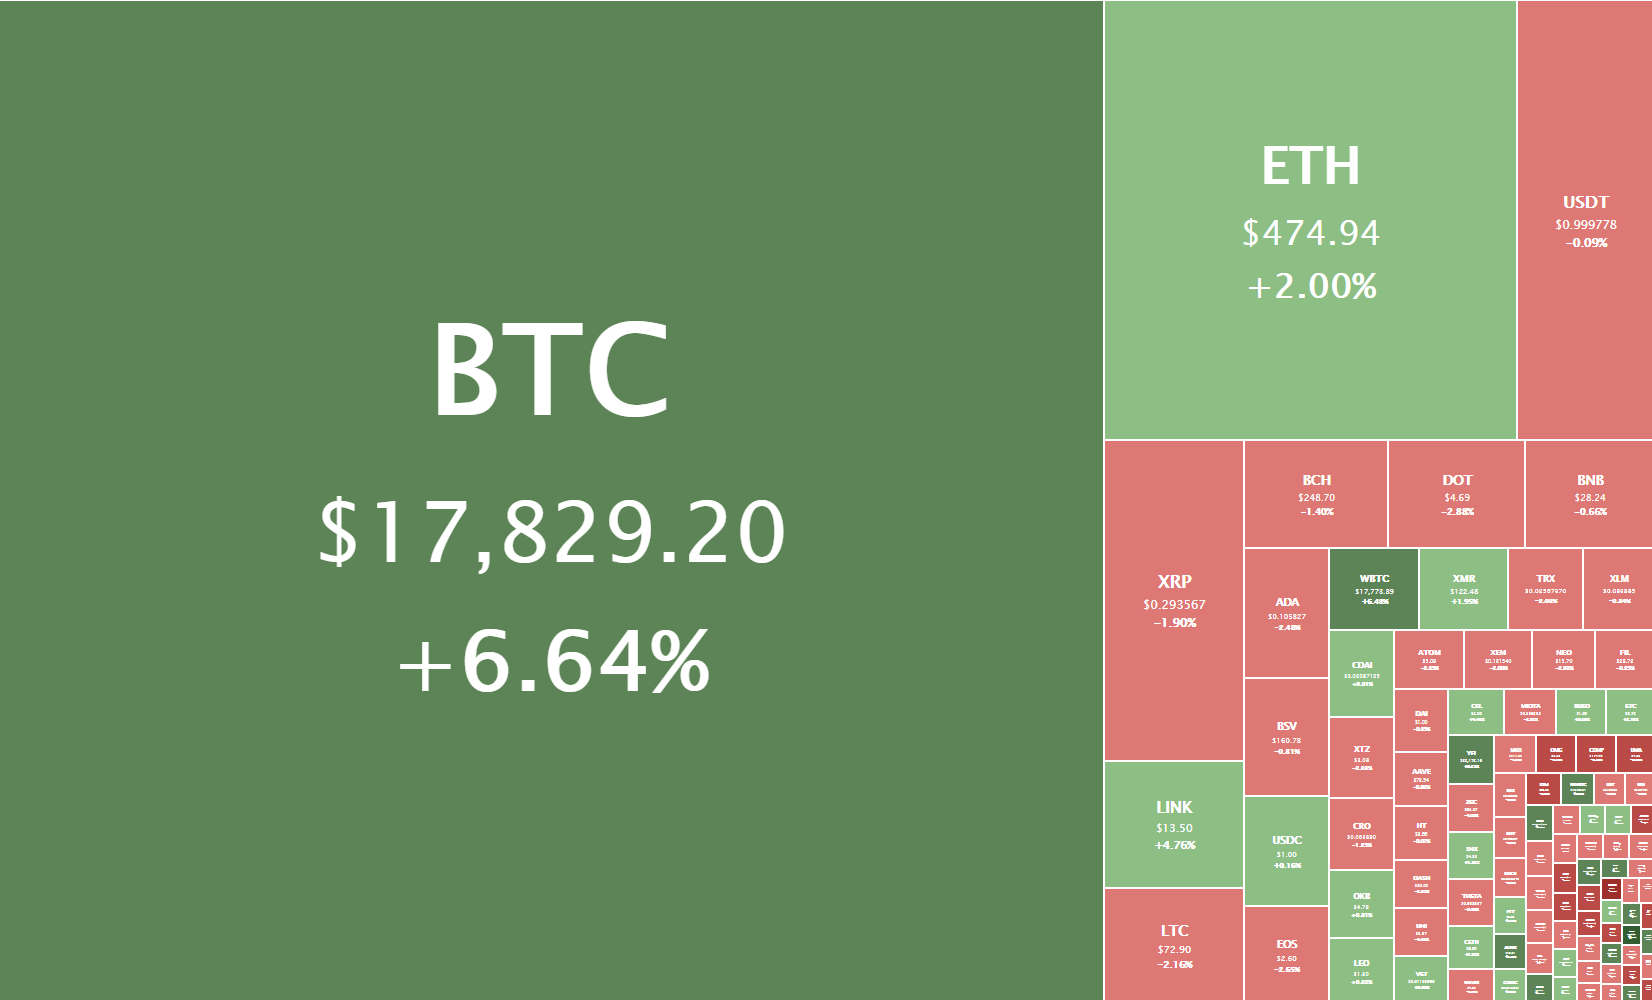
Daily Crypto Sector Heat Map
Nexo gained 14.37% in the past 24 hours, making it the most prominent daily gainer out of the top100 cryptos ranked by market capitalization yet again today. It is closely followed by Bitcoin Gold’s gain of 10.84% and DigiByte’s 9.52% gain. On the other hand, SushiSwap lost 12.92%, making it the most prominent daily loser. Curve DAO Token lost 10.74% while HedgeTrade lost 10.07%, making them the 2nd and 3rd most prominent daily losers.
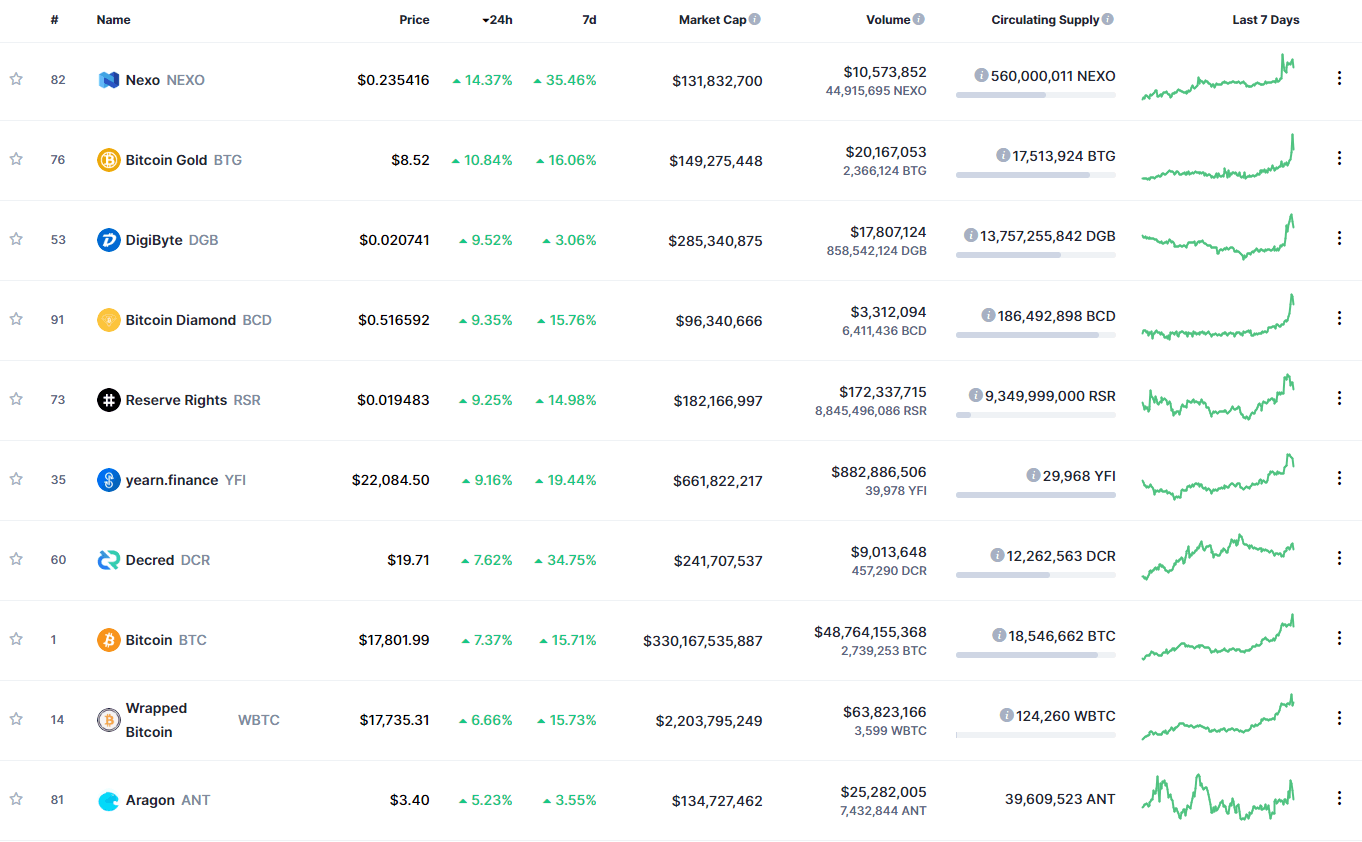
Top 10 24-hour Performers (Click to enlarge)
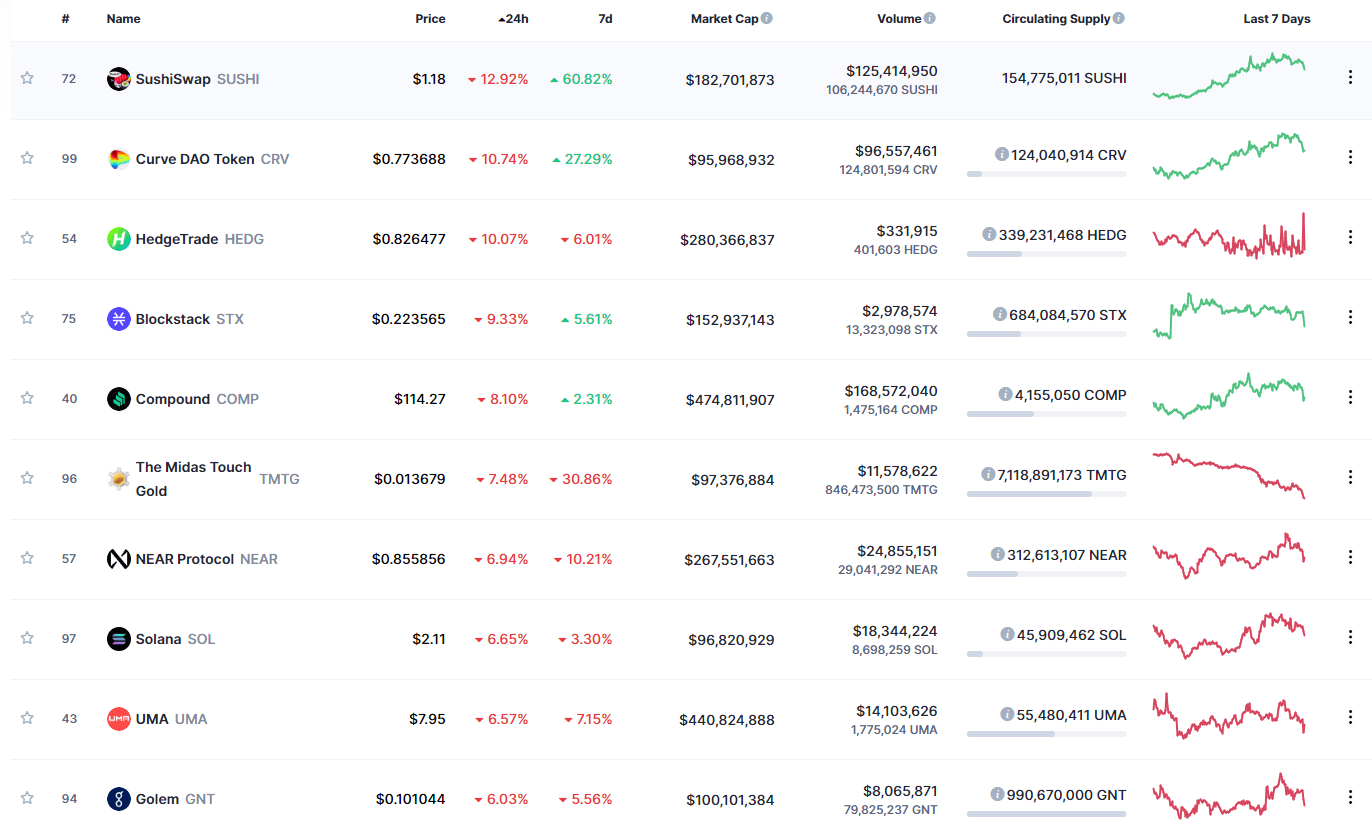
Bottom 10 24-hour Performers (Click to enlarge)
Bitcoin’s market dominance has skyrocketed over the course of the day, with its value is currently staying at 66.3%. This value represents a 1.4% difference to the upside compared to the value it had yesterday.
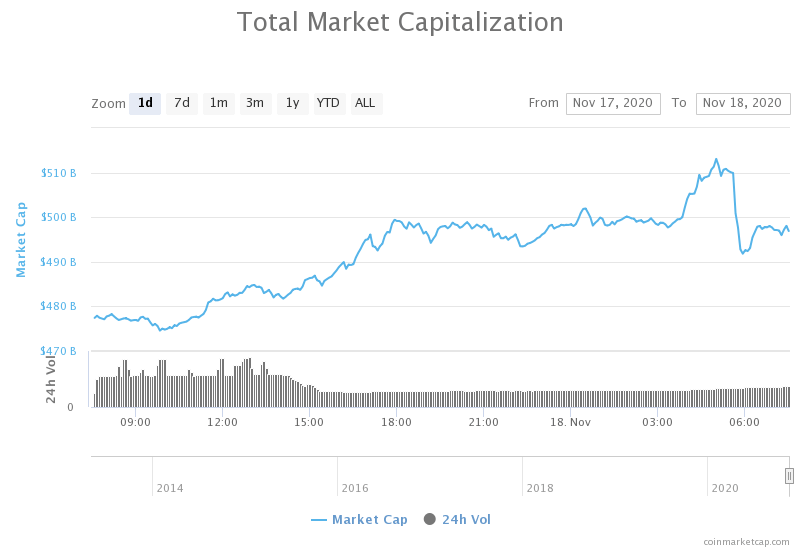
Daily Crypto Market Cap Chart
The crypto sector capitalization has gone up quite a bit over the course of the day. Its current value is $498.06 billion, representing a $20.84 billion increase compared to our previous report.
_______________________________________________________________________
What happened in the past 24 hours?
_______________________________________________________________________
- Crypto-Friendly Brooks Gets Nod to Serve 5-Year Term Leading Bank Regulator (Coindesk)
- Bulk preorders for the latest bitcoin ASIC miners are sold out until next spring (The Block)
- Bitstamp seeks court approval to subpoena Citibank, Bank of America as part of a spat with former payment processor (The Block)
- Bitcoin derivatives market breaks new highs amid heightened price action (The Block)
- “I Might Be Missing Something,” Says Billionaire Bitcoin Bear Ray Dalio (Cryptobriefing)
- FTX Traders Say Democrats Have 23% of Winning the Senate in January (Cryptobriefing)
- How Microstrategy CEO Turned “Scary” Bitcoin Investment Into More Than $250 Million (Cryptobriefing)
- This Ethereum-based DeFi token is up 3,000% in the past week alone (Cryptoslate)
- Mexico’s second-richest man invests 10% of his liquid portfolio in BTC (Cointelegraph)
- Not dead yet: Bitcoin Cash ABC is up 70% as Sechet releases new client (Cointelegraph)
_______________________________________________________________________
Technical analysis
_______________________________________________________________________
Bitcoin
Bitcoin has had a parabolic run to the upside, reaching as high as $18,500 before dropping down. While the price gain was gradual at first, Bitcoin’s final push from $17,600 to $18,500 and then back to nearly $17,000 happened in just a couple of hours. This volatility came to be because BTC encountered heavy resistance at the now-confirmed $18,500 resistance level. Many traders call this move just a temporary pullback before a new high, while a minority is calling a short-term top.
Trading Bitcoin on a bull trend such as this one should only happen in one direction, and that is WITH the trend. Shorting Bitcoin and attempting to catch pullbacks will be far less lucrative due to the size of the move, as well as much riskier.
BTC/USD 1-hour Chart
Bitcoin’s technicals on the 4-hour, daily, and weekly time-frame are all completely bullish and show no signs of bear or neutral presence. On the other hand, its monthly overview is tilted towards the buy-side just slightly and does show some bearishness.
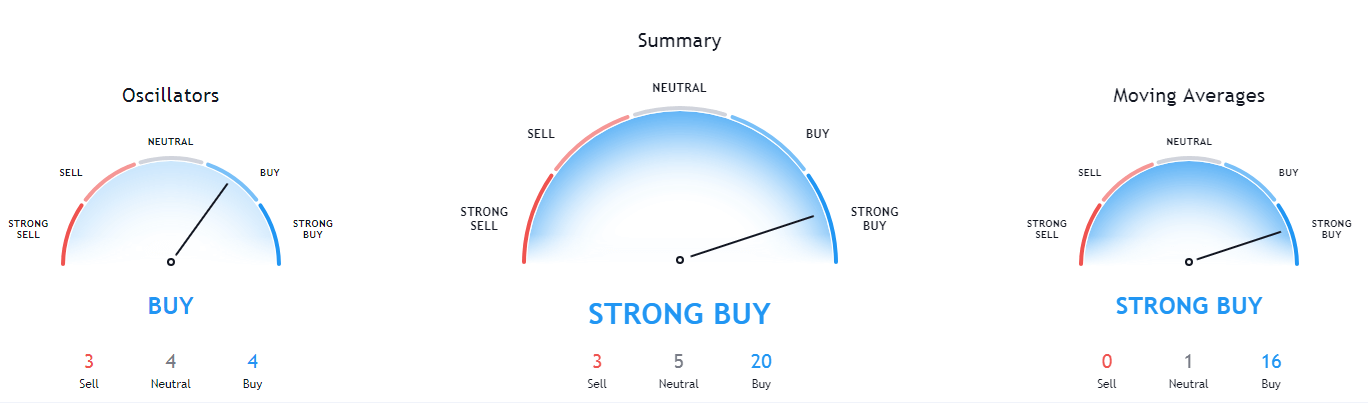
BTC/USD 1-day Technicals
Technical factors (4-hour Chart):
- Price is far above its 50-period EMA and above its 21-period EMA
- Price is between its middle and top Bollinger band
- RSI is stabilizing after leaving the overbought territory (61.38)
- Volume is descending
Key levels to the upside Key levels to the downside
1: $18500 1: $17,850
2: $19000 2: $17,450
3: $19500 3: $17,130
Ethereum

Ethereum had had a turbulent 24 hour period, as its price went from fighting for and hovering over the top line of the ascending channel all the way to $495 and then back to $455 before it stabilized at around $475. This move has clearly shown the market another ascending line (red) formed on the ETH/USD chart, which has been tested a couple of times already. This line is Ethereum’s final resistance towards $500.
Ethereum should, as most cryptos at the moment, be traded only to the upside, as trading its pullbacks during a bull market is simply not worth it.
ETH/USD 2-hour Chart
Ethereum’s weekly time-frame shows some neutrality alongside its overall bullish stance, while the other time-frames show complete bullishness.
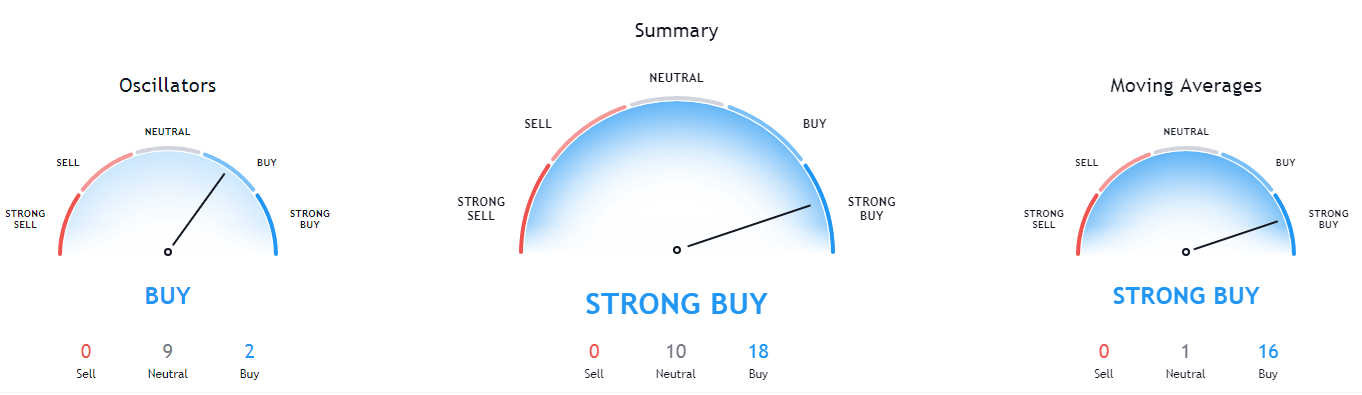
ETH/USD 1-day Technicals
Technical Factors (4-hour Chart):
- The price is above both its 50-period and its 21-period EMA
- Price is slightly above its middle Bollinger band
- RSI is neutral (55.77)
- Volume is above average
Key levels to the upside Key levels to the downside
1: $490 1: $470
2: $500 2: $451
3: $510 3: $445
Ripple

The fourth-largest cryptocurrency by market cap started off the day by pushing towards the upside and almost reaching its $0.31 resistance level. However, the bears have stepped in and brought XRP’s price down to $0.28 before consolidating in the middle of the range between the two aforementioned levels.
If Bitcoin doesn’t make another sharp move in the short-term, XRP is (yet again) sideways-action crypto. However, if BTC moves, it’s safest to watch Bitcoin and trade along with the bullish moves while discarding the bearish entries.
XRP/USD 4-hour Chart
XRP’s 4-hour, daily, and weekly technicals are tilted towards the buy-side, and while they aren’t showing signs of neutrality, the bullish sentiment isn’t as strong either. The monthly overview does, on the other hand, show clear signs of neutrality.

XRP/USD 1-day Technicals
Technical factors (4-hour Chart):
- The price is above its 50-period EMA and at its 21-period EMA
- Price is at its middle Bollinger band
- RSI is neutral (54.33)
- Volume is above average
Key levels to the upside Key levels to the downside
1: $0.31 1: $0.28
2: $0.3244 2: $0.27
3: $0.3328 3: $0.266
Related posts
 Daily Crypto Review, May 15 – Bitcoin Rejected from $10,000 – What’s Next?
 Daily Crypto Review, Jun 03 – Large BTC Miner Capitulation Causing The Price Drop? BTC Under $10,000 Again
 Daily Crypto Review, Nov 30 – Ethereum Soars on Great Fundamentals; Bitcoin Bulls Back in the Game
 Daily Crypto Review, Dec 3 – PayPal and BlackRock Heads Extremely Bullish on Bitcoin; Crypto Sector Consolidating