
The cryptocurrency sector has spent the day stabilizing after a sudden drop. Bitcoin is currently trading for $18,997, representing an increase of 0.48% compared to our last report. Meanwhile, Ethereum’s price decreased 0.64% on the day, while XRP managed to lost 0.01%.

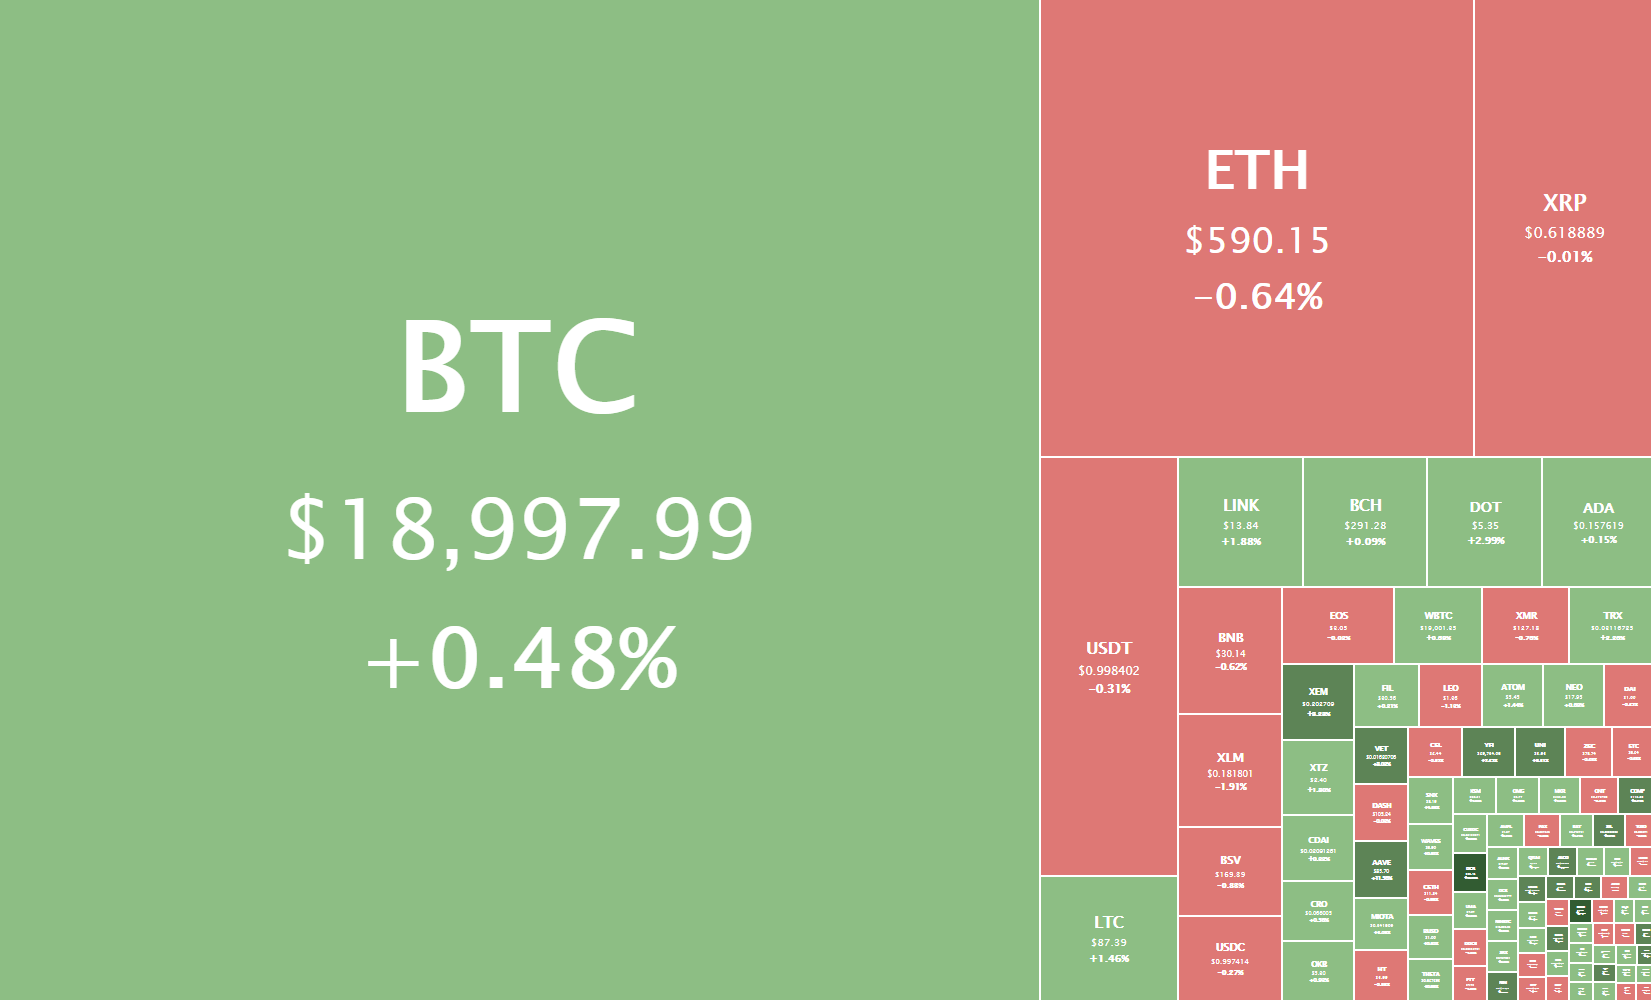
Daily Crypto Sector Heat Map
Decred gained 39.22% in the past 24 hours, making it the most prominent daily gainer in the top100. It is closely followed by Elrond’s 30.56% and Curve DAO Token’s 10.36% gain. On the other hand, Nexo lost 5.60%, making it the most prominent daily loser. It is followed by Status’s loss of 2.72% and Augur’s loss of 1.66%.
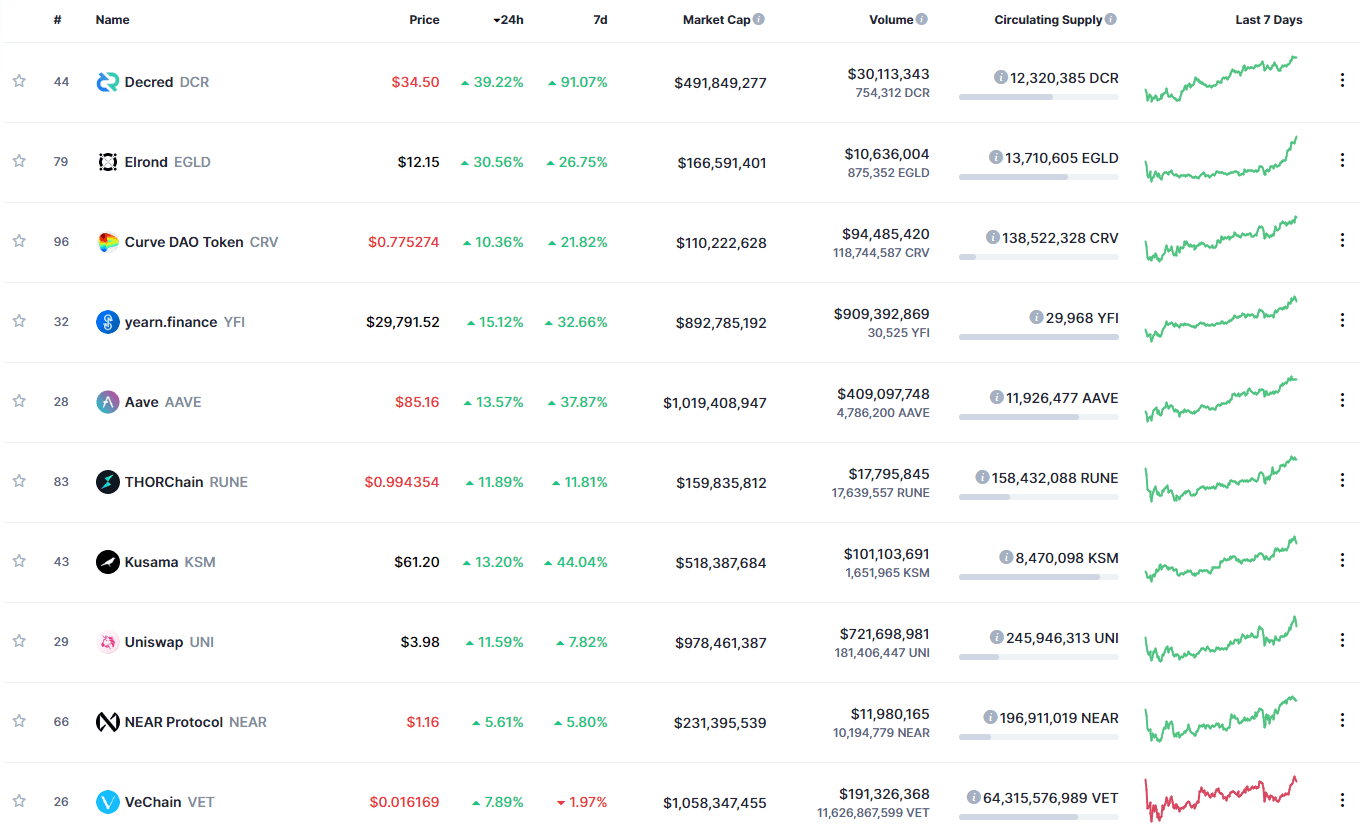
Top 10 24-hour Performers (Click to enlarge)
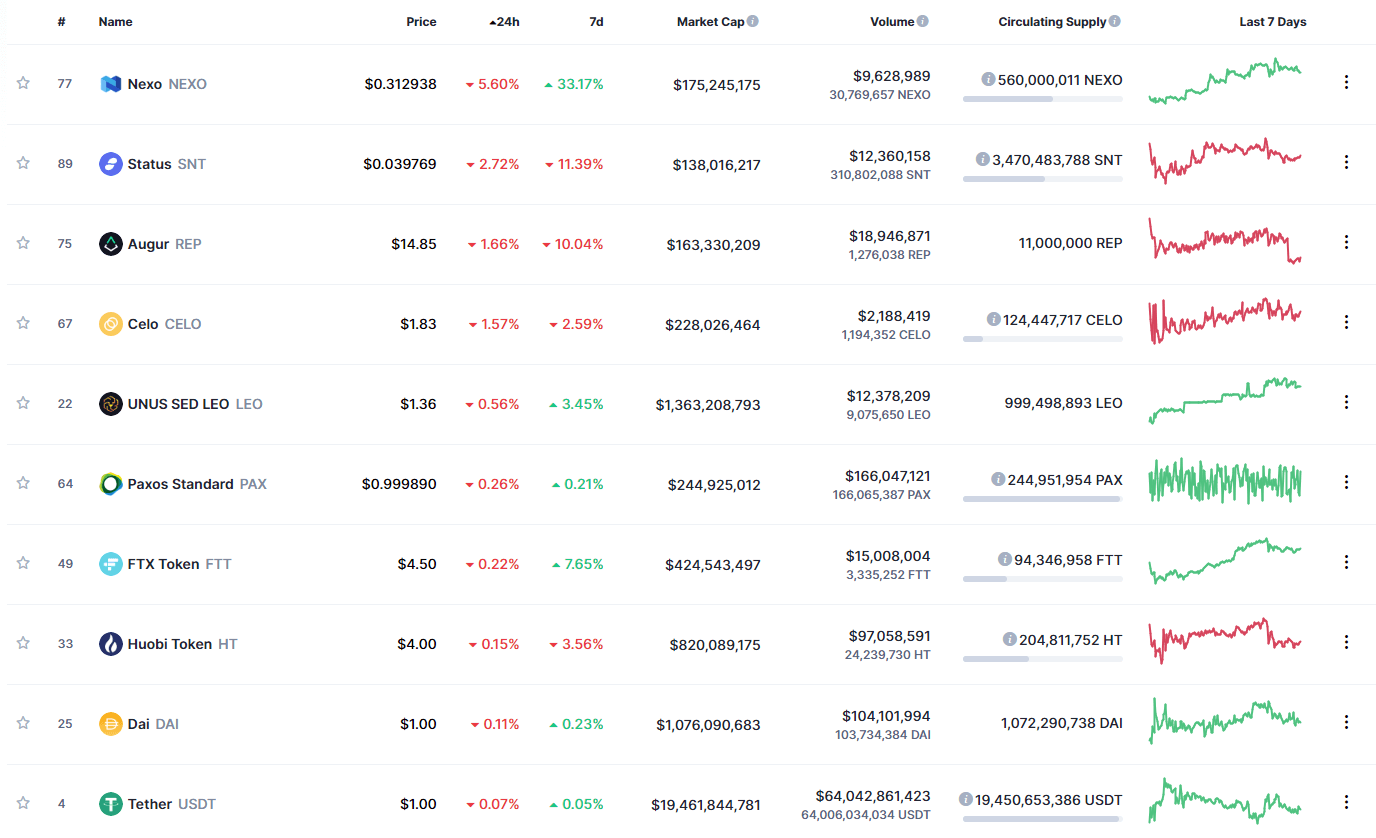
Bottom 10 24-hour Performers (Click to enlarge)
Bitcoin’s market dominance hasn’t changed since we last reported, with its value currently staying at 62.3%. This value represents a 0% difference when compared to yesterday’s value.

Daily Crypto Market Cap Chart
The crypto sector capitalization has increased significantly in the past 24 hours. Its current value is $571.05 billion, representing a $10.27 billion increase compared to our previous report.
_______________________________________________________________________
What happened in the past 24 hours?
_______________________________________________________________________
- Visa partners with Circle to let card issuers integrate USDC payment capability (The Block)
- BlackRock CEO says Bitcoin is gaining legitimacy as an asset class (The Block)
- Bitcoin miners brought in over $500 million in revenue during November (The Block)
- How much is Square up from its Bitcoin investment? (Cryptoslate)
- Bitcoin’s rally from $12,000 has been mostly driven by “institutional hunger”: data (Cryptoslate)
- US Lawmakers Introduce Bill That Would Require Stablecoin Issuers to Obtain Bank Charters (Coindesk)
- Introducing Valid Points: Risks and Rewards of Staking on Eth 2.0 (Coindesk)
- PayPal CEO Is “Bullish” on Many Cryptocurrencies (Cryptobriefing)
- Ampleforth Makes Surprise Expansion Beyond Ethereum (Cryptobriefing)
- Russian central bank opposes ruble-pegged stablecoins (Cointelegraph)
_______________________________________________________________________
Technical analysis
_______________________________________________________________________
Bitcoin

Bitcoin has spent the day recovering from yesterday’s pullback and trying to regain $19,000. However, this level has proven to be a solid resistance zone, and it is unsure whether Bitcoin will manage to push over it. On the other hand, the overall sentiment around the largest cryptocurrency by market cap is incredibly bullish, mostly due to the massive investments coming from the institutional side.
Bitcoin is very volatile and unpredictable at the moment, making the trades quite hard to pull off. Traders should pay attention to volume and watch smaller time-frames and enter trades with a high profit/loss ratio to mitigate the risk when things go bad.
BTC/USD 4-hour chart
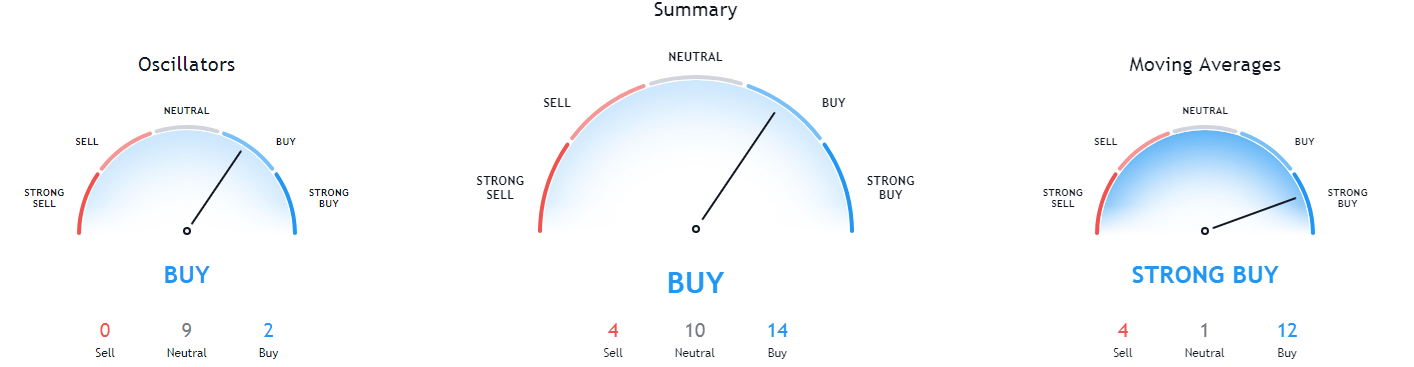
Bitcoin’s short-term technicals are completely bullish, while its weekly and monthly technicals show some signs of neutrality alongside the overall bullishness.
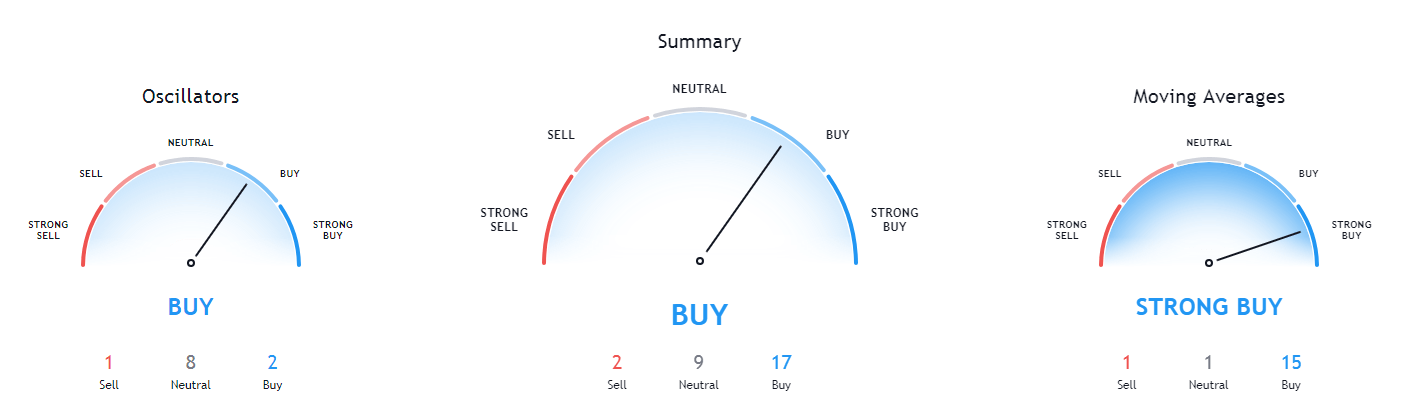
BTC/USD 1-day Technicals
Technical factors (4-hour Chart):
- Price is above its 50-period EMA and slightly above its 21-period EMA
- Price is at its middle Bollinger band
- RSI is neutral (54.55)
- Volume is average
Key levels to the upside Key levels to the downside
1: $19,000 1: $18,790
2: $19,500 2: $18,500
3: $19,666 3: $18,240
Ethereum
Ethereum has spent the day mostly flat and hovering right under the $600 mark. The second-largest cryptocurrency by market cap has continuously failed to break the immediate resistance level but did not back down from it.
Ethereum traders have a good chance of catching a safe trade with a stop-loss slightly below $600 if Ether pushes above $600 (either because of its own price movement or as a response to Bitcoin breaking $19,000 with conviction).
ETH/USD 4-hour Chart
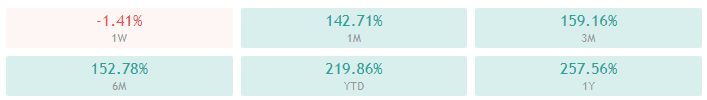
Ethereum’s daily and monthly technicals are completely bullish, while its 4-hour and weekly time-frames show some neutrality next to the overall bullishness.

ETH/USD 1-day Technicals
Technical Factors (4-hour Chart):
- The price is above its 50-period and at its 21-period EMA
- Price is at its middle Bollinger band
- RSI is neutral (54.35)
- Volume is average
Key levels to the upside Key levels to the downside
1: $600 1: $510
2: $630 2: $500
3: $735 3: $490
Ripple
The fourth-largest cryptocurrency by market cap has had another slow day, with its price fluctuating between $0.6 and $0.64. The $0.6 support level seems to be holding quite well, while the $0.625 level got ignored several times, which made us remove it from the key levels section.
Trading XRP is almost impossible as the cryptocurrency currently has no volatility and (therefore) no trade opportunities.
XRP/USD 4-hour Chart
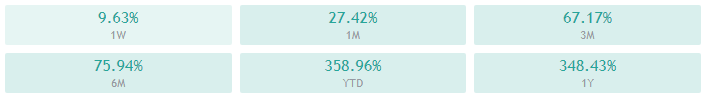
XRP’s daily and monthly technicals are completely bullish, while its 4-hour and weekly time-frames’ show bullish sentiment with a hint of neutrality.
XRP/USD 1-day Technicals
Technical factors (4-hour Chart):
- The price is slightly above its 50-period EMA and at its 21-period EMA
- Price is at its middle Bollinger band
- RSI is neutral (51.08)
- Volume is slightly below average
Key levels to the upside Key levels to the downside
1: $0.666 1: $0.6
2: $0.78 2: $0.596
3: $0.79 3: $0.535
Related posts
 Daily Crypto Review, Apr 17 – Bitcoin above $7,000; The US expanding on the idea of the Digital Dollar
 Daily Crypto Review, Apr 20 – Blockchain Jobs Booming; Lightning Network Unsafe?
 Daily Crypto Review, Apr 22 – The Netherlands testing grounds for EU digital currency; Ripple Labs suing YouTube
 Daily Crypto Review, May 13 – Bitcoin Pushing Towards 9,000; WBTC Larger than BTC’s Lightning Network