
The cryptocurrency sector has spent the weekend regaining what was lost during the crash on Nov 25. Almost every single cryptocurrency in the top100 ended up being in the green. The largest cryptocurrency by market cap is currently trading for $18,369, representing an increase of 4.43% on the day. Meanwhile, Ethereum gained 9.79% on the day, while XRP managed to gain 6.67%.
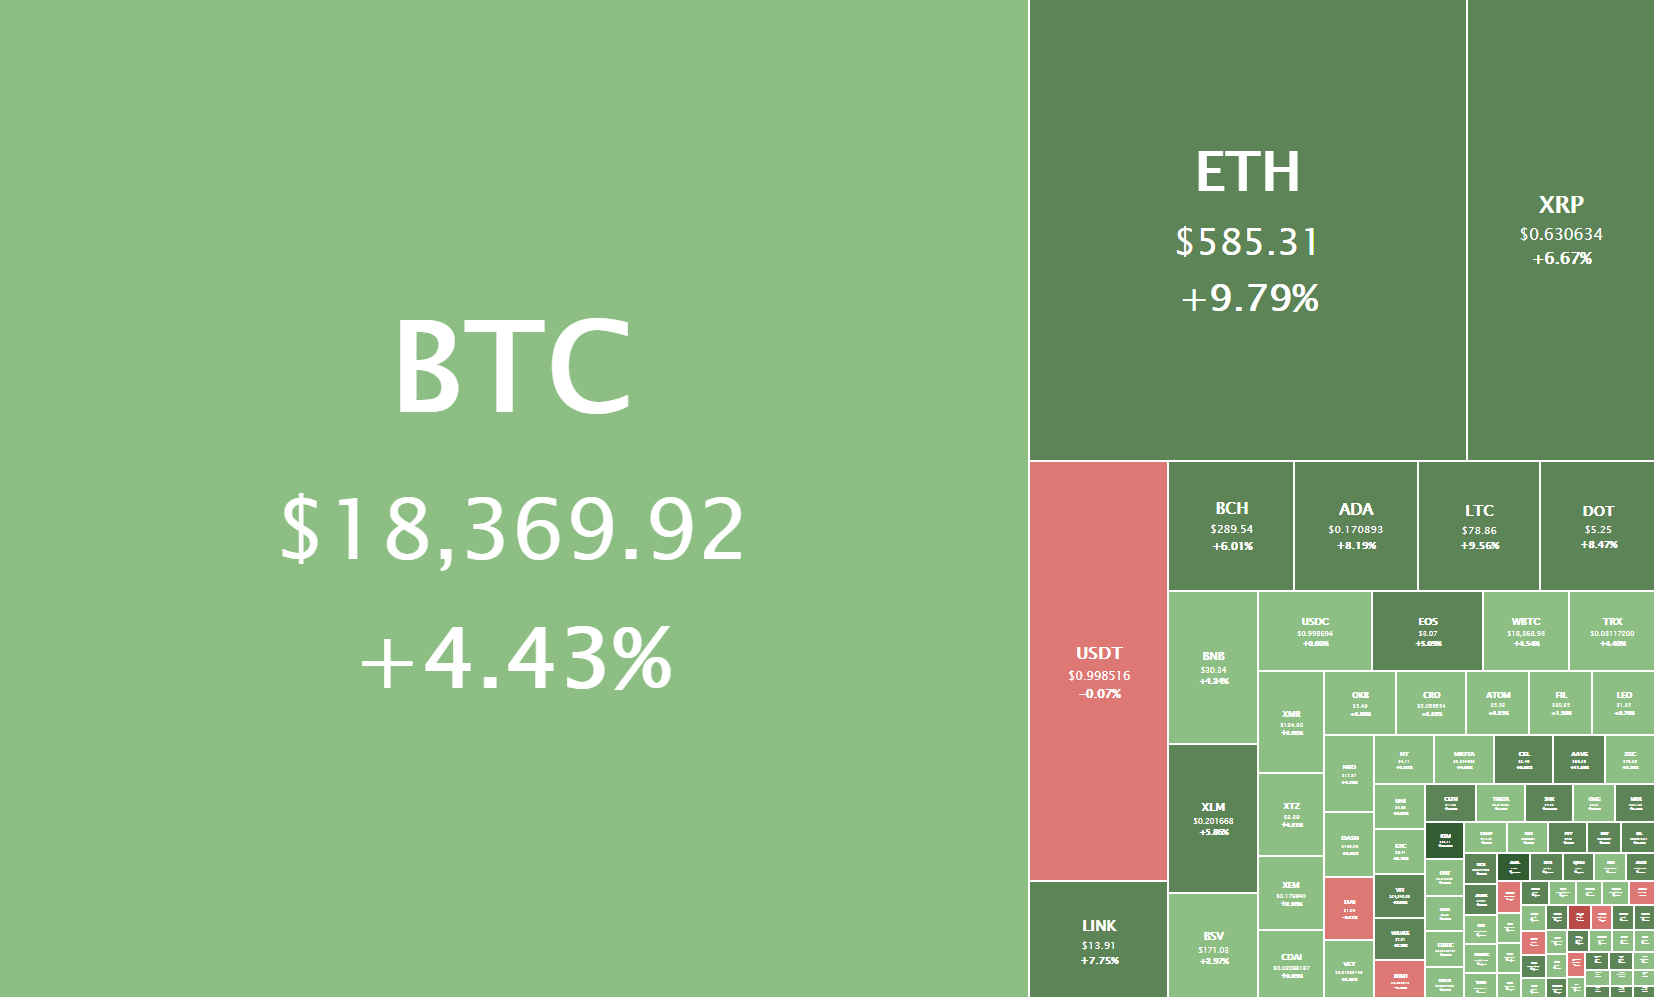
Daily Crypto Sector Heat Map
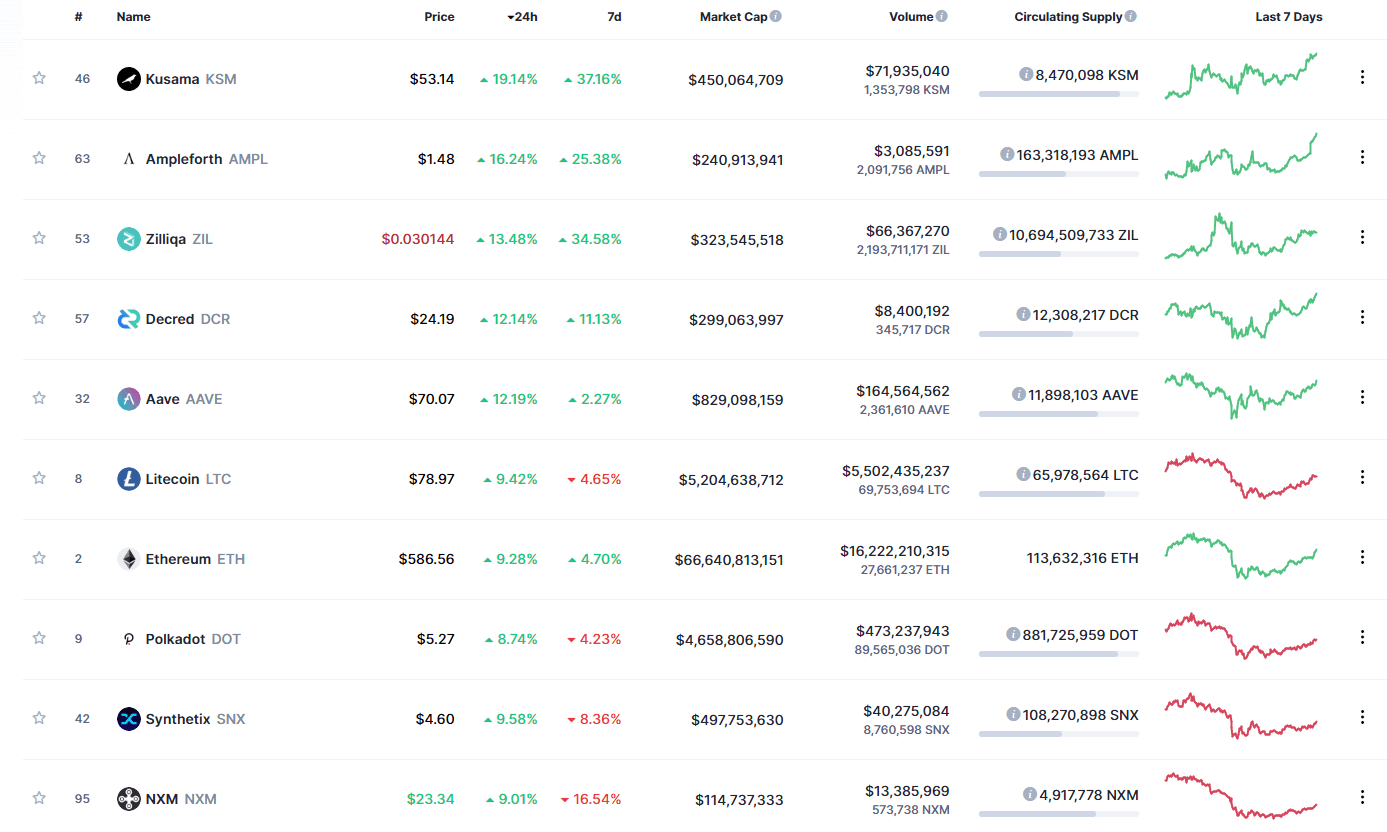
Kusama gained 19.14% in the past 24 hours, making it the most prominent daily gainer in the top100. It is closely followed by Ampleforth’s gain of 16.24% and Zilliqa’s 13.48% gain. On the other hand, Numeraire Coin lost 5.56%, making it the most prominent daily loser. There were no other cryptocurrencies in the top100 that lost over 1% of its value.
Top 10 24-hour Performers (Click to enlarge)

Bottom 10 24-hour Performers (Click to enlarge)
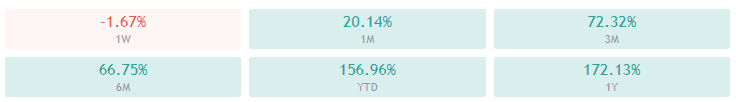
Bitcoin’s market dominance has decreased slightly since we last reported, with its value currently staying at 61.7%. This value represents a 0.5% difference to the downside compared to the value it had on Friday.

Daily Crypto Market Cap Chart
The crypto sector capitalization has increased significantly over the weekend. Its current value is $553.00 billion, representing a $38.14 billion increase compared to our previous report.
_______________________________________________________________________
What happened in the past 24 hours?
_______________________________________________________________________
- Singapore’s third-largest bank seems to be building a crypto custody solution (The Block)
- Ripple is selling a part of its stake in MoneyGram for the first time (The Block)
- Guggenheim opens door to bitcoin exposure for $5 billion macro fund via Grayscale’s GBTC (The Block)
- Chinese reporter: China likely sold the $3+ billion in Bitcoin, Ethereum affiliated with PlusToken (Cryptoslate)
- 3 reasons Stellar (XLM) saw a 166% rally within five days (Cryptoslate)
- Bitcoin Cash Faction Prolongs November Feud (Cryptobriefing)
- Paul Tudor Jones Bitcoin fractal hints at possible explosive BTC rally (Cointelegraph)
- Pizza Hut accepts Bitcoin for pies in Venezuela (Cointelegraph)
- Bitcoin mining difficulty getting close to ATH as price stabilizes above $18K (Cointelegraph)
- Why institutions suddenly give a damn about BTC (Cointelegraph)
_______________________________________________________________________
Technical analysis
_______________________________________________________________________
Bitcoin
Bitcoin has spent the weekend recovering from the Nov 25 crash. The price was slowly going up over the weekend, creeping up to and past $18,000 once again. The largest cryptocurrency by market cap is currently between its 61.8% and 78.6% Fib retracement levels, and a break to either side of this range may determine its short-term fate.
Bitcoin’s short-term future will greatly depend on if it breaks its immediate support or resistance level. In both cases, a strong rally towards that side may form, so traders should be prepared to “catch” the trade quickly.
BTC/USD 1-hour Chart
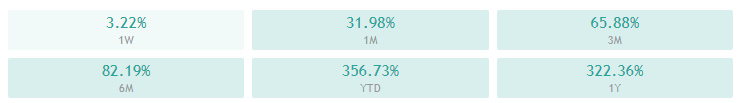
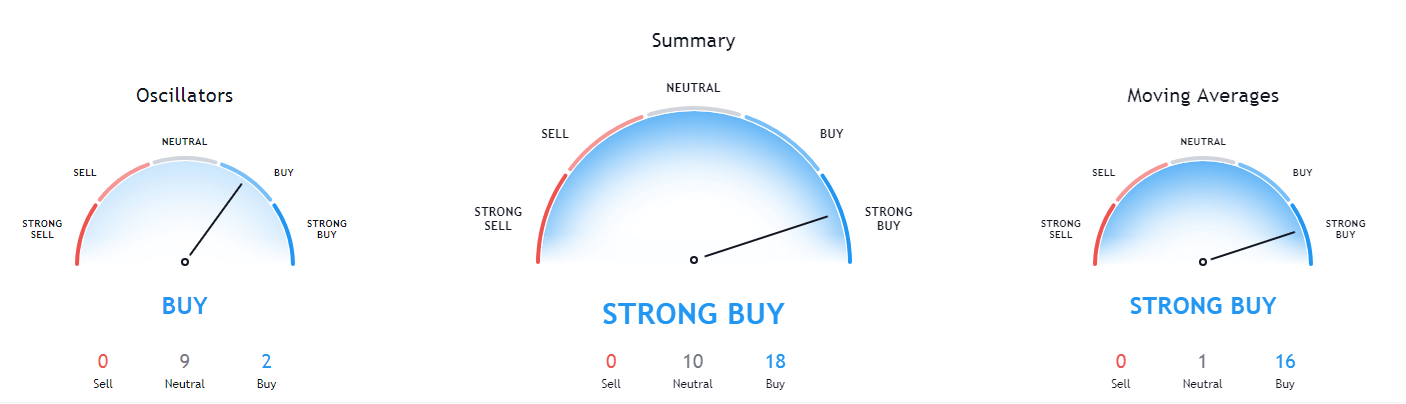
Bitcoin’s daily, weekly, and monthly technicals are tilted towards the buy-side but show slight neutrality signs. On the other hand, its 4-hour technicals are completely bullish.
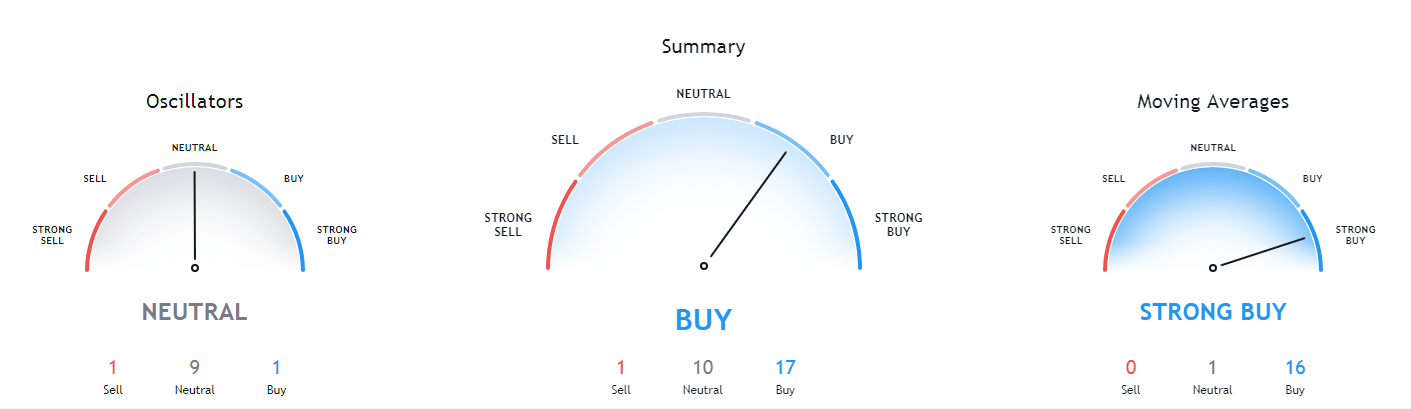
BTC/USD 1-day Technicals
Technical factors (4-hour Chart):
- Price is above both its 50-period EMA and its 21-period EMA
- Price is near its top Bollinger band
- RSI is neutral (62.26)
- Volume is average
Key levels to the upside Key levels to the downside
1: $18,500 1: $17,850
2: $18,790 2: $17,450
3: $19,000 3: $17,000
Ethereum
Ethereum has, just like Bitcoin, been climbing back and trying to reach its recent highs. The second-largest cryptocurrency by market cap is currently fighting to pass the 78.6% Fib retracement level, sitting at $592.5. If this level gets conquered with conviction, we may expect another run past $600.
Ethereum’s current fundamental outlook is very bullish due to its Phase 0 of Ethereum 2.0 launching. This, combined with Bitcoin moving towards the upside, has made trading any potential pullbacks impossible due to how risky it would be.
ETH/USD 4-hour Chart
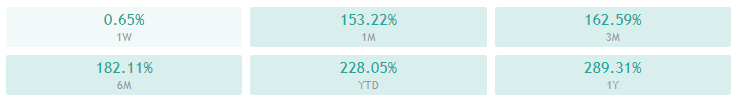
Ethereum’s 4-hour, daily, and monthly technicals are completely bullish and show no signs of neutrality. On the other hand, its sentiment seen in the weekly time-frame’s is bullish but shows some neutrality.
ETH/USD 1-day Technicals
Technical Factors (4-hour Chart):
- The price is far above both its 50-period and its 21-period EMA
- Price is at its top Bollinger band
- RSI is near being overbought(68.26)
- Volume is average
Key levels to the upside Key levels to the downside
1: $600 1: $510
2: $630 2: $500
3: $735 3: $490
Ripple
The fourth-largest cryptocurrency by market cap has spent the weekend trying to maintain its level after a small rally that took its price from $0.55 to $0.65. XRP seems to be trading in a range, bound by the 38.2% Fib retracement ($0.582) and 61.8% Fib retracement ($0.657).
Trading XRP may not be optimal as trading Bitcoin, or Ethereum is potentially more profitable and slightly more straightforward.
XRP/USD 2-hour Chart
XRP’s technicals on shorter time-frames (4-hour and daily) are extremely bullish, while its weekly and monthly overviews show some signs of neutrality and bearishness (though they are still bullish).

XRP/USD 1-day Technicals
Technical factors (4-hour Chart):
- The price is above its 50-period EMA and slightly above its 21-period EMA
- Price is between its middle and top Bollinger band
- RSI is neutral (58.86)
- Volume is average
Key levels to the upside Key levels to the downside
1: $0.657 1: $0.625
2: $0.711 2: $0.582
3: $0.79 3: $0.535
Related posts
 Daily Crypto Review, Jun 19 – Bitcoin Mid-Term Bullish vs. Bearish Outlook – Explained
 Daily Crypto Review, Oct 1 – Bitcoin Fighting for $10,850; Ethereum Bulls Rallying Against All Odds
 Daily Crypto Review, Oct 8 – DeFi Bubble Popped: Token Prices Shatter on Low Trading Volumes
 Daily Crypto Review, Nov 2 – Ethereum’s Price Explodes; Bitcoin’s Whitepaper Celebrates its 12th Birthday