
The cryptocurrency market shad a green day, mostly caused by Bitcoin dropping under its immediate support level. Bitcoin is currently trading for $9,199, which represents a decrease of 0.82% on the day. Meanwhile, Ethereum lost 1.6% on the day, while XRP lost 1.42%.
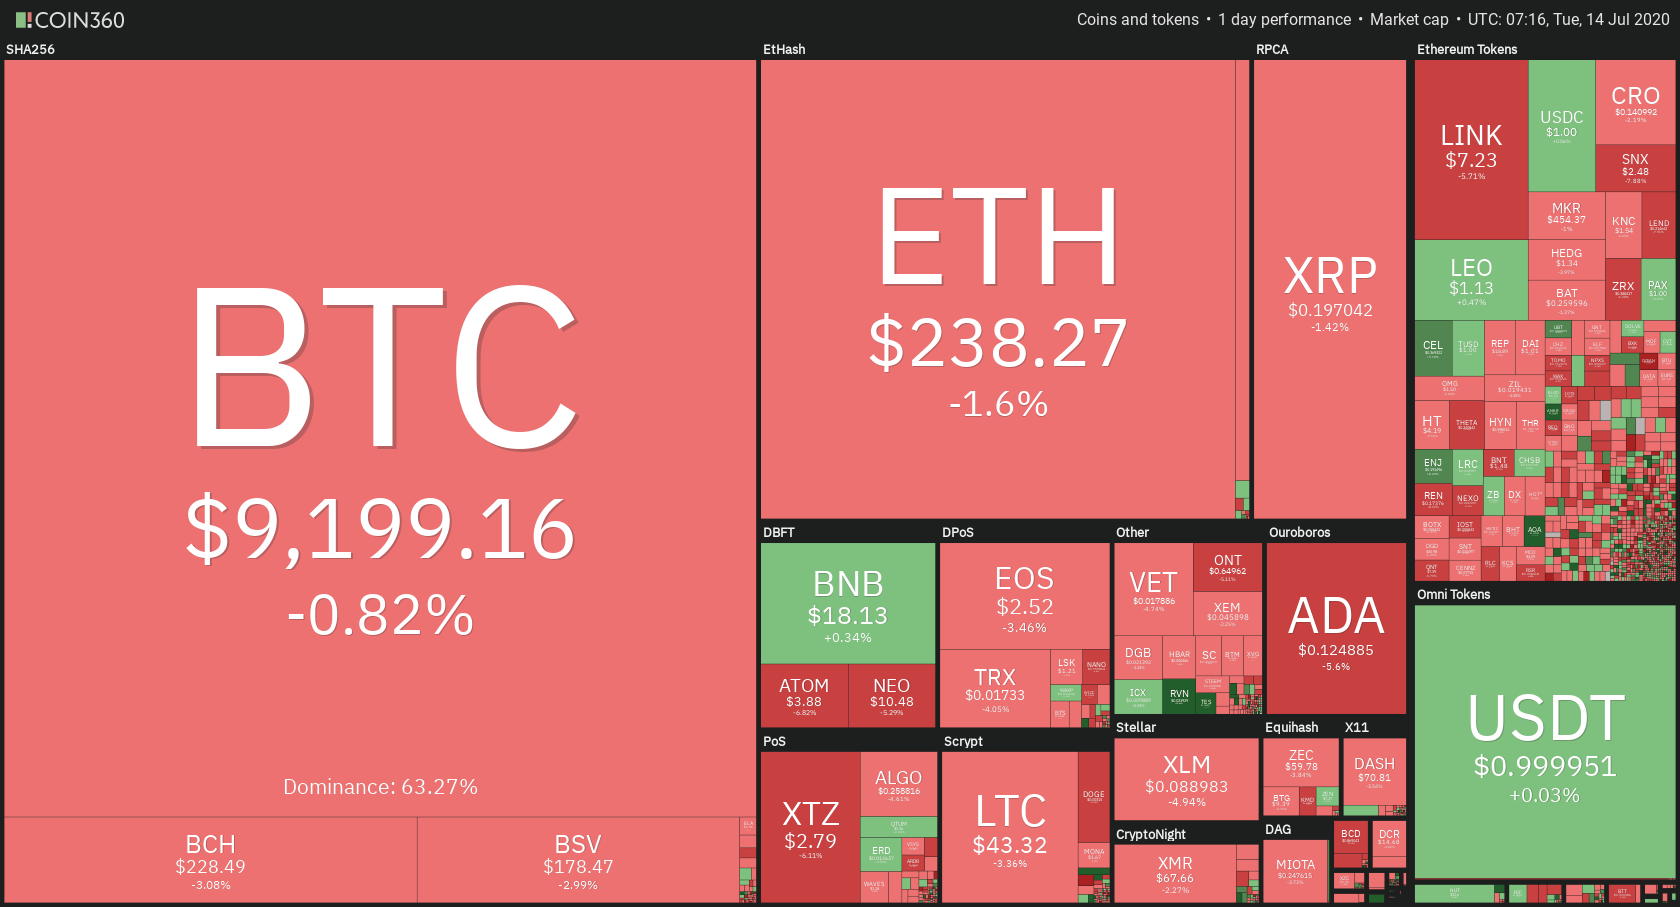
Daily Crypto Sector Heat Map
When talking about top100 cryptocurrencies, Aurora gained 245.87% on the day, making it by far the most prominent daily gainer. Divi (24.12%) and Ravencoin (17.39%) also did great. On the other hand, Ampleforth has lost 36.61%, making it the most prominent daily loser. It is followed by Nexo’s loss of 13.30% and Quant’ loss of 11.55%.
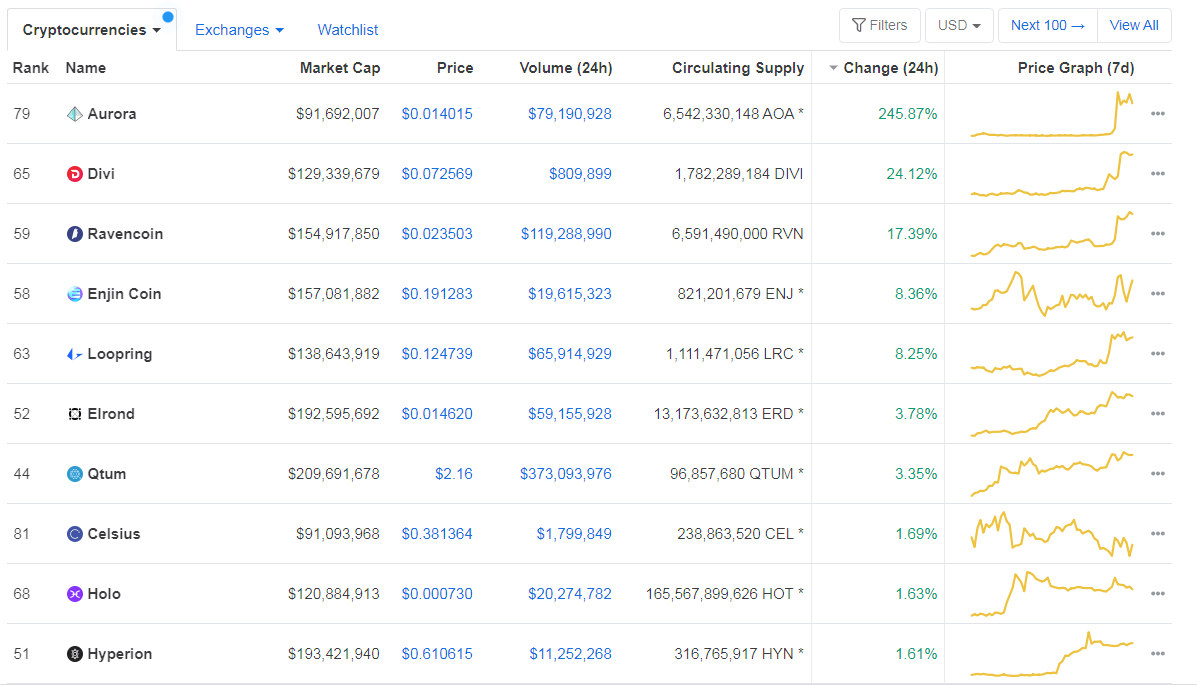
Top 10 24-hour Performers (Click to enlarge)
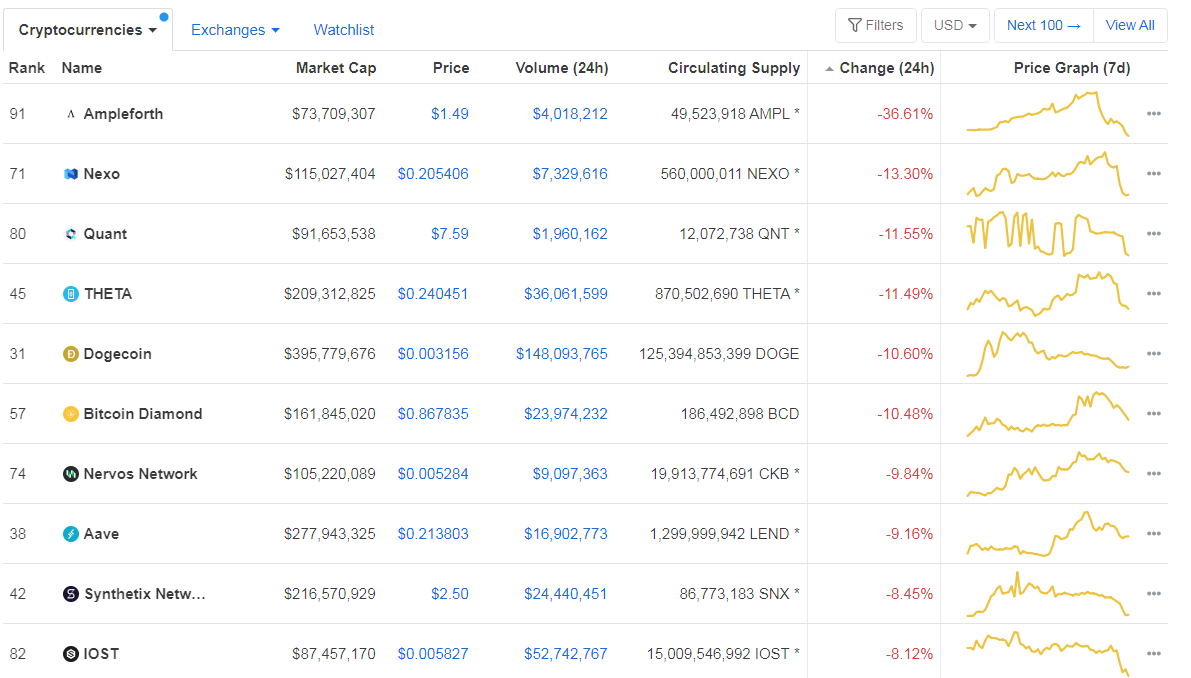
Bottom 10 24-hour Performers (Click to enlarge)
Bitcoin’s dominance level increased slightly since we last reported, with its value currently at 63.27%. This value represents a 0.33% difference to the upside when compared to yesterday’s value.
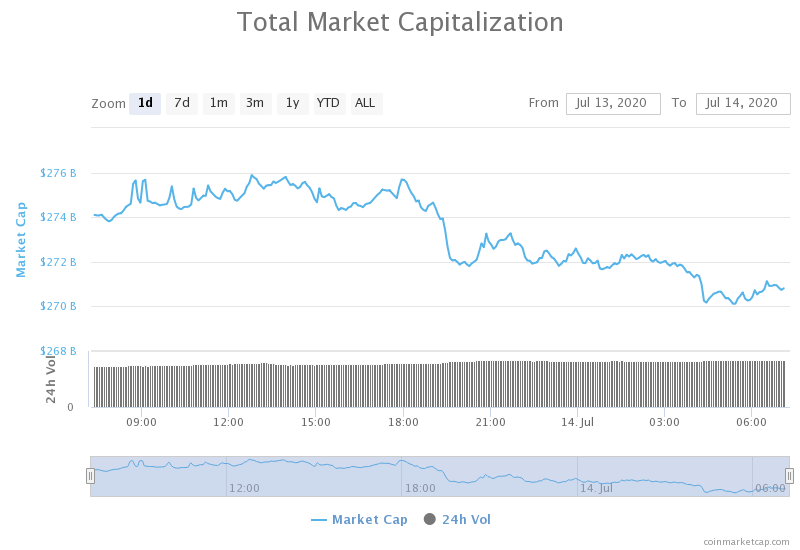
Daily Crypto Market Cap Chart
The cryptocurrency market capitalization decreased slightly when compared to when we last reported, with the market’s current value being $270.87 billion. This value represents a decrease of $3 billion when compared to the value it had yesterday.
_______________________________________________________________________
What happened in the past 24 hours?
_______________________________________________________________________
- IRS Violated ‘Taxpayer Bill of Rights’ With 2019 Crypto Letters: Watchdog (Coindesk)
- Bank of England governor says the U.K. central bank is weighing a digital currency (The Block)
- Success of Bitcoin Hinges on “Relationships With Law Enforcement,” Says Coinbase CEO (Cryptobriefing)
- Crypto Taxes: Still Confused After All These Years (Coindesk)
- Coinbase CEO explains why they sell blockchain analytics software to the U.S. secret service (Cryptoslate)
- The U.S. Army is seeking info on crypto tracing tools for cybercrime investigations (The Block)
- The surprising reason why Ethereum could determine Cardano’s next price trend (Cryptoslate)
- South Korea Could Issue a Crypto Capital Gains Tax as High as 20% (Cointelegraph)
- Data Shows the ‘Cheaper Altcoins Make Higher Returns’ Myth Is Flawed (Cointelegraph)
- Crypto Lawyers Are in Hot Demand as the Industry Goes Mainstream, Say Experts (Cointelegraph)
_______________________________________________________________________
Technical analysis
_______________________________________________________________________
Bitcoin
The largest cryptocurrency by market capitalization had a red day as bears broke its immediate support level. BTC dropped below the descending trend line as well as the $9,251 level in a short bear run. The price went all the way down to the $9,120 support level, but stopped and reversed its path there.
Once again, BTC traders had a great opportunity to trade the pullback after the bearish move. Trading Bitcoin’s reversals and confirmations are the safest way to trade at the moment.
BTC/USD 4-hour Chart
Technical factors:
- Price is below its 50-period EMA and its 21-period EMA
- Price at the lower B.B.
- RSI at below the middle point and heading down (42.17)
- Increased volume
Key levels to the upside Key levels to the downside
1: $9,251 1: $9,120
2: $9,580 2: $8,980
3: $9,735 3: $8,820
Ethereum
Ethereum had a slightly red day as well, but with a much tamer move towards the downside. While bears did manage to push Ethereum below the $240 level, they faced a good amount of resistance at the 4-hour 50-period moving average. However, the price went under it as well, but stopped near the $237 level, where some form of support is created.
Ethereum traders should look for an opportunity to trade the next bounce off of $240 or break to the downside from the $240.
ETH/USD 4-hour Chart
Technical Factors:
- Price below the 50-period EMA and the 21-period EMA
- Price at the lower B.B.
- RSI near the middle (45.68)
- Increased volume
Key levels to the upside Key levels to the downside
1: $240 1: $228
2: $251.4 2: $225.4
3: $260 3: $218
Ripple
The third-largest cryptocurrency by market cap fell below the $0.2 support level after a failed attempt of breaking $0.205 to the upside. The price dropped all the way to $0.192 before bouncing back. XRP is now consolidating above the 4-hour 50-period moving average, which it uses as a temporary support. The “battle” for $0.2 is, however, not yet finished.
XRP traders can look for an opportunity to trade after XRP establishes whether it will end up above or below $0.2.
XRP/USD 4-hour Chart
Technical factors:
- XRP in a mid-term descending trend (though it broke the trend in the short-term)
- XRP lacks strong support levels below $0.178
- Price below 21-period and the 50-period EMA
- Price at the lower B.B.
- RSI is neutral (45.92)
- Average volume
Key levels to the upside Key levels to the downside
1: $0.205 1: $0.2
2: $0.214 2: $0.19
3: $0.227 3:$0.178
Related posts
 Daily Crypto Review, Sept 23 – Gold Pushing BTC Towards $9,500; XRP Bears Taking Over
 Daily Crypto Review, Sept 28 – XRP Exiting Bearish Structure and Aiming for $0.245; Bitcoin Eyeing $11,000
 Daily Crypto Review, Sept 30 – Goldman Sachs Entering the Crypto Sector; Bitcoin Prepares for a Move
 Daily Crypto Review, Oct 7 – Crypto Sector Falls As Trump Rejects Stimulus Proposal
One reply on “Daily Crypto Review, July 14 – IRS Violated Taxpayers’ “Bill of Rights”; The UK Wants a Digital Currency”
Thanks for the great info.