
The cryptocurrency sector has experienced another surge as Bitcoin moved away from $11,300 and closer to $11,500. Bitcoin is currently trading for $11,434, representing an increase of 0.89% on the day. Meanwhile, Ethereum gained 3.35% on the day, while XRP gained 0.03%.

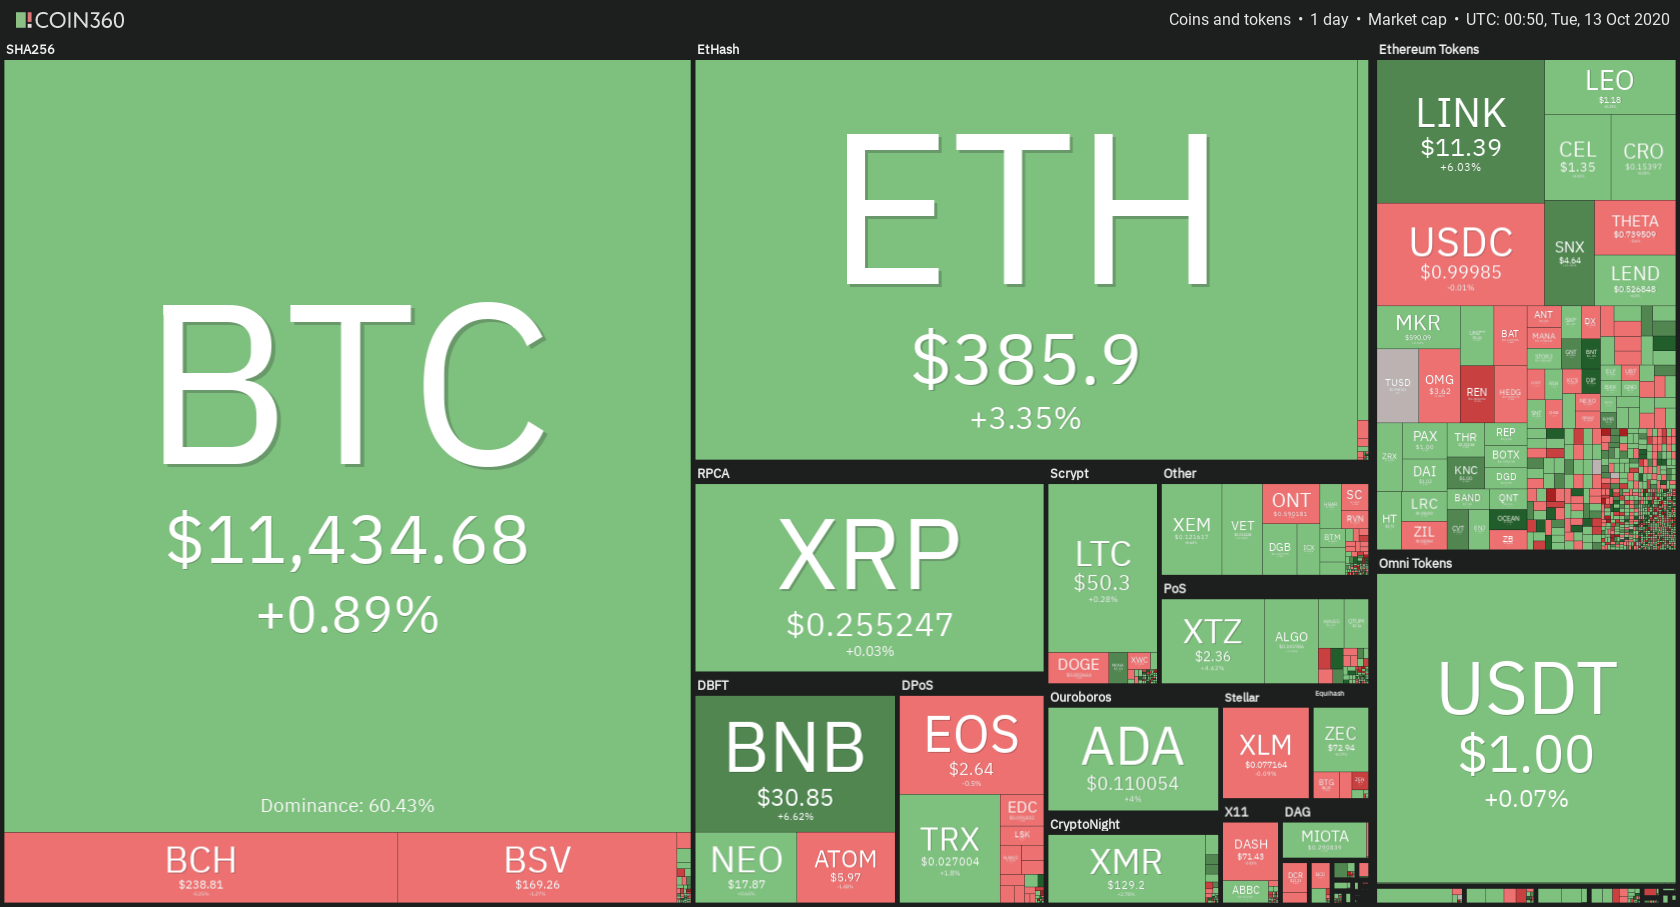
Daily Crypto Sector Heat Map
Taking a look at the top 100 cryptocurrencies, we can see that Ocean Protocol gained 21.97% in the past 24 hours, making it the top daily gainer. CyberVein (14.58%) and Synthetix Network Token (11.83%) also did great. On the other hand, Ren lost 14.83%, making it the most prominent daily loser. It is followed by PumaPay’s loss of 8.33% and Uniswap’s loss of 3.33%.
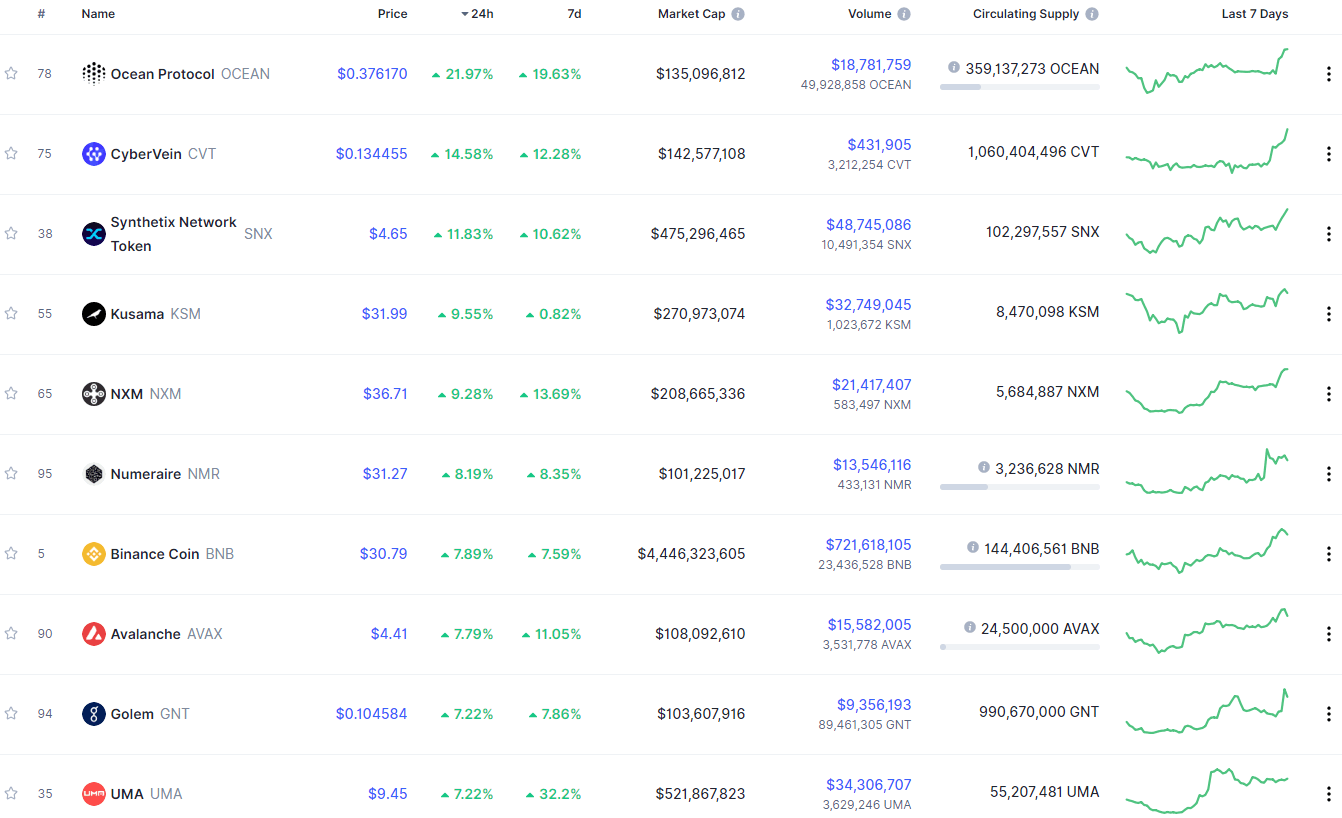
Top 10 24-hour Performers (Click to enlarge)
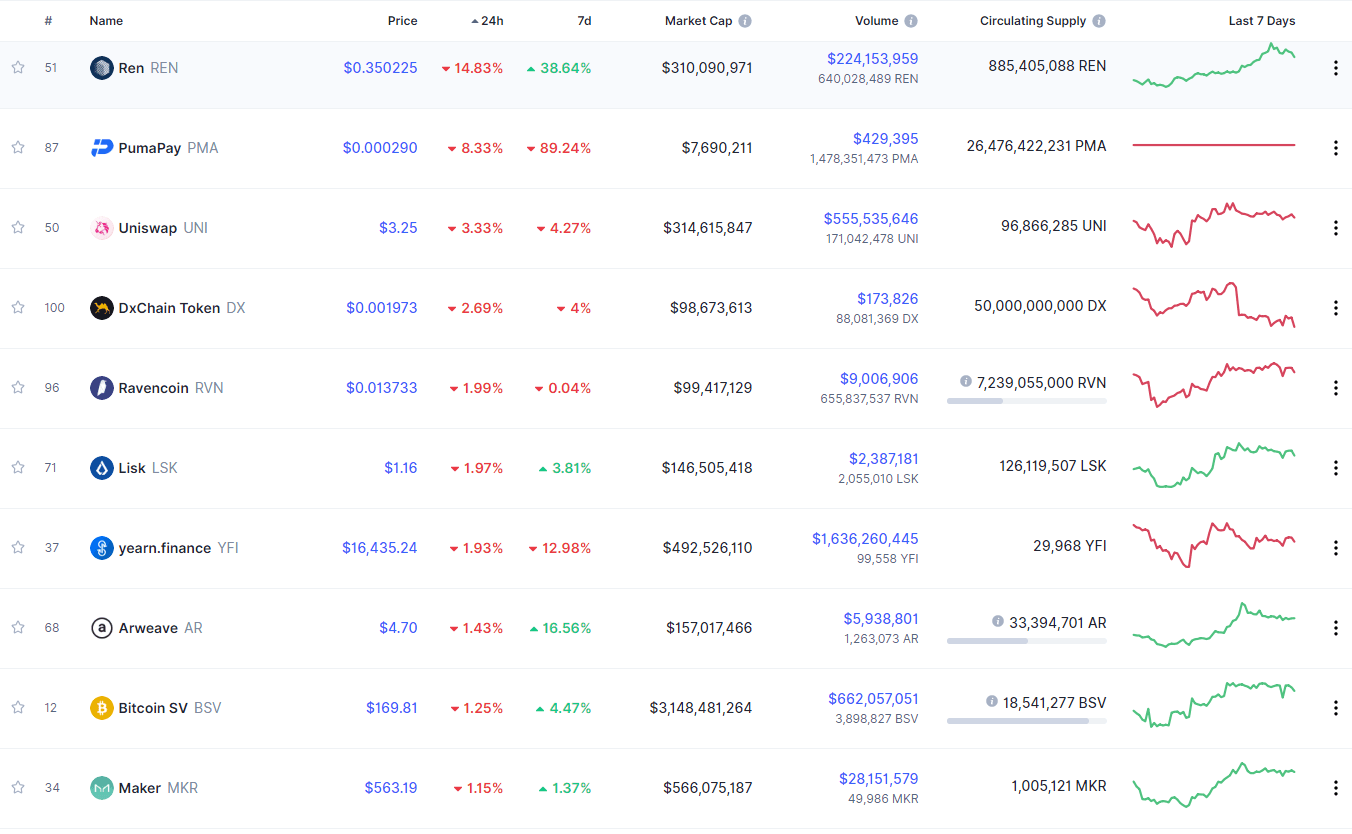
Bottom 10 24-hour Performers (Click to enlarge)
Bitcoin’s market dominance level has decreased slightly since our last report, with its value currently being 60.40%. This value represents a 0.26% difference to the downside when compared to when we last reported.

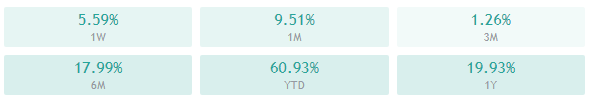
Daily Crypto Market Cap Chart
The crypto sector capitalization has a bit more value over the course of the past 24 hours. Its current value is $366.13 billion, representing an increase of $7.71 billion compared to our previous report.
_______________________________________________________________________
What happened in the past 24 hours?
_______________________________________________________________________
- Grayscale’s Ethereum Trust joins GBTC as SEC-registered reporting company (The Block)
- Report: G7 financial leaders say they will oppose Libra until it is ‘adequately’ regulated (The Block)
- Another CME Gap? Why Bitcoin Traders Should Care (Cryptobriefing)
- Ethereum Gets Privacy-Focused Layer-2 Scaling Solution with Aztec 2.0 (Cryptobriefing)
- Aave Raises $25 Million in the Round Led by Blockchain.com (Cryptobriefing)
- Why investors are optimistic after “painful” DeFi correction despite YFI plunge (Cryptoslate)
- With China’s central bank digital asset gaining steam, Bitcoin is stronger than ever (Cryptoslate)
- Short the dollar: How Goldman’s bearish stance uplifts Bitcoin Q4 sentiment (Cointelegraph)
- Ledger wants to help MicroStrategy secure its $400m Bitcoin treasury (Cointelegraph)
_______________________________________________________________________
Technical analysis
_______________________________________________________________________
Bitcoin
The largest cryptocurrency by market cap has continued its push towards the upside, getting past $11,500 and even close to the $12,000 mark. The move died out when it approached $11,750. Bitcoin is now in the pullback phase, where its price has breached $11,500 to the downside and is testing how low it can go until the bulls step in again.
Traders should pay attention to how Bitcoin handles the $11,300-$11,500 level when looking for their next trade.
BTC/USD 4-hour Chart
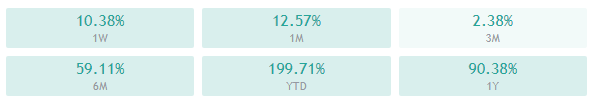
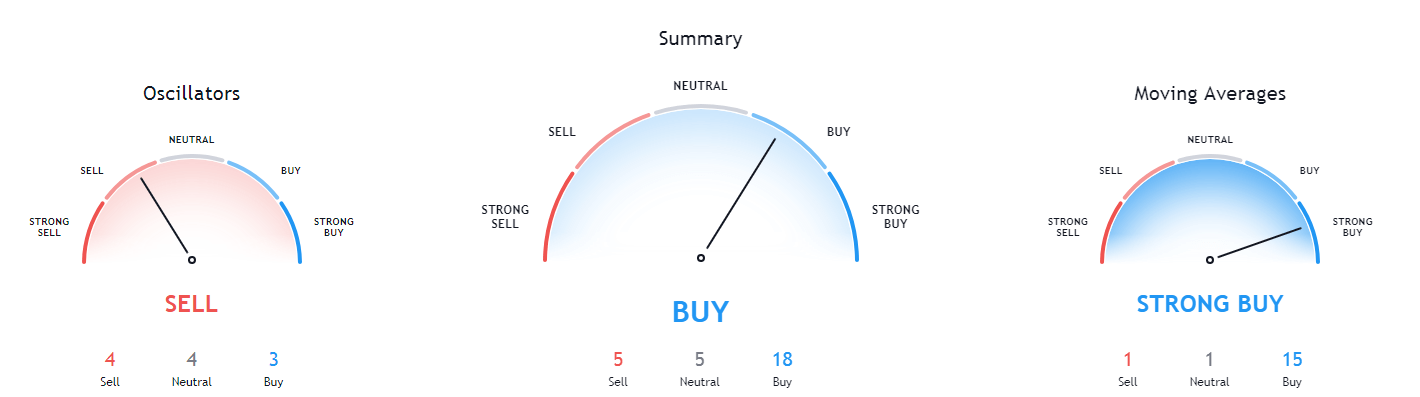
Bitcoin’s technical overview on all time-frames is tilted towards the buy-side, with longer time-frames showing an extremely strong bull overview.

BTC/USD 1-day Technicals
Technical factors (4-hour Chart):
- Price is above both its 50-period EMA and 21-period EMA
- Price descending from the top Bollinger band
- RSI is descending from almost-overbought levels (62.46)
- Volume is above-average
Key levels to the upside Key levels to the downside
1: $11,500 1: $11,300
2: $11,630 2: $11,180
3: $12,000 3: $11,000
Ethereum
Ethereum has had another bull-run in the past 24 hours, with its price reaching as high as $396. However, the second-largest cryptocurrency by market cap couldn’t reach past the $400 mark, triggering bull exhaustion, and ultimately a pullback. With volume and RSI dropping, we may expect Ethereum to look for a price to consolidate a bit lower than its current price, and possibly test the $371 support level.
ETH/USD 4-hour Chart
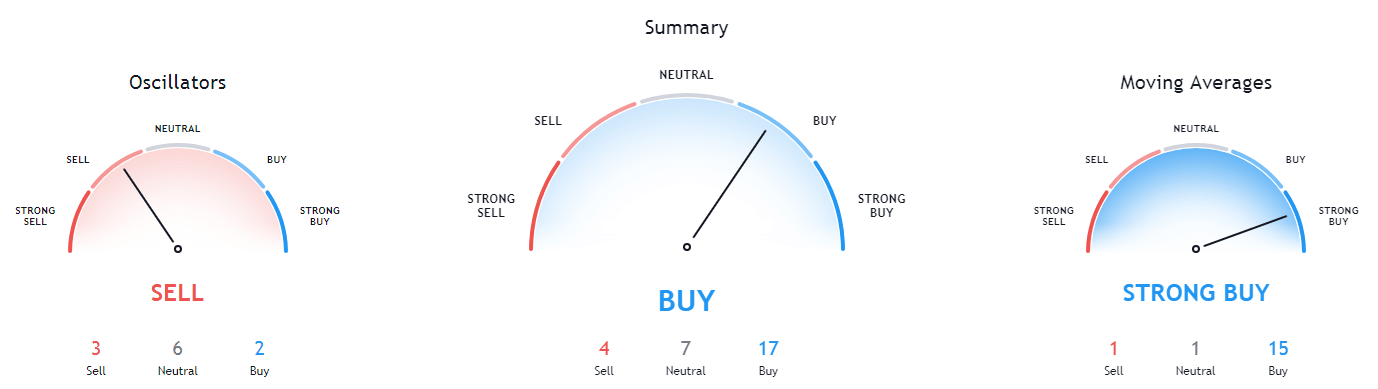
Ethereum’s 1-day and monthly overviews show some signs of doubt in the bullish sentiment, while its 4-hour and weekly overviews are completely bullish.
ETH/USD 1-day Technicals
Technical Factors (4-hour Chart):
- The price is above both its 50-period and its 21-period EMA
- The price at its top Bollinger band
- RSI is flat and nearly overbought (66.74)
- Volume is elevated
Key levels to the upside Key levels to the downside
1: $378 1: $371
2: $400 2: $360
3: $415 3: $334
Ripple

Unlike Bitcoin and Ethereum, which both had a strong bull presence today, XRP has been trading sideways for most of the day. Its inability to reach past the $0.26 level has proven to be a problem, and we may expect XRP’s price to collide with the ascending trend line very soon. There is a small probability that XRP will reach past $0.26 and get close to $0.266, but it will most likely happen with Bitcoin’s help (though it is more likely that XRP will face the ascending line first).
XRP/USD 4-hour Chart
XRP’s 1-day technicals show a hint of doubt in its short-term bullish sentiment, while the 4-hour and weekly overviews are completely bullish. However, XRP’s monthly overview is still completely tilted towards the sell-side.
XRP/USD 1-day Technicals
Technical factors (4-hour Chart):
- The price is above its 50-period EMA as well as its 21-period EMA
- Price is at its middle Bollinger band
- RSI is flat (55.33)
- Volume is average but descending
Key levels to the upside Key levels to the downside
1: $0.266 1: $0.2454
2: $0.27 2: $0.235
3: $0.273 3: $0.227
Related posts
 Daily Crypto Review, Jun 19 – Bitcoin Mid-Term Bullish vs. Bearish Outlook – Explained
 Daily Crypto Review, Oct 1 – Bitcoin Fighting for $10,850; Ethereum Bulls Rallying Against All Odds
 Daily Crypto Review, Oct 8 – DeFi Bubble Popped: Token Prices Shatter on Low Trading Volumes
 Daily Crypto Review, Oct 26 – JP Morgan Calls Bitcoin “Currency With A Large Upside Potential”; Crypto Preparing For A Big Move