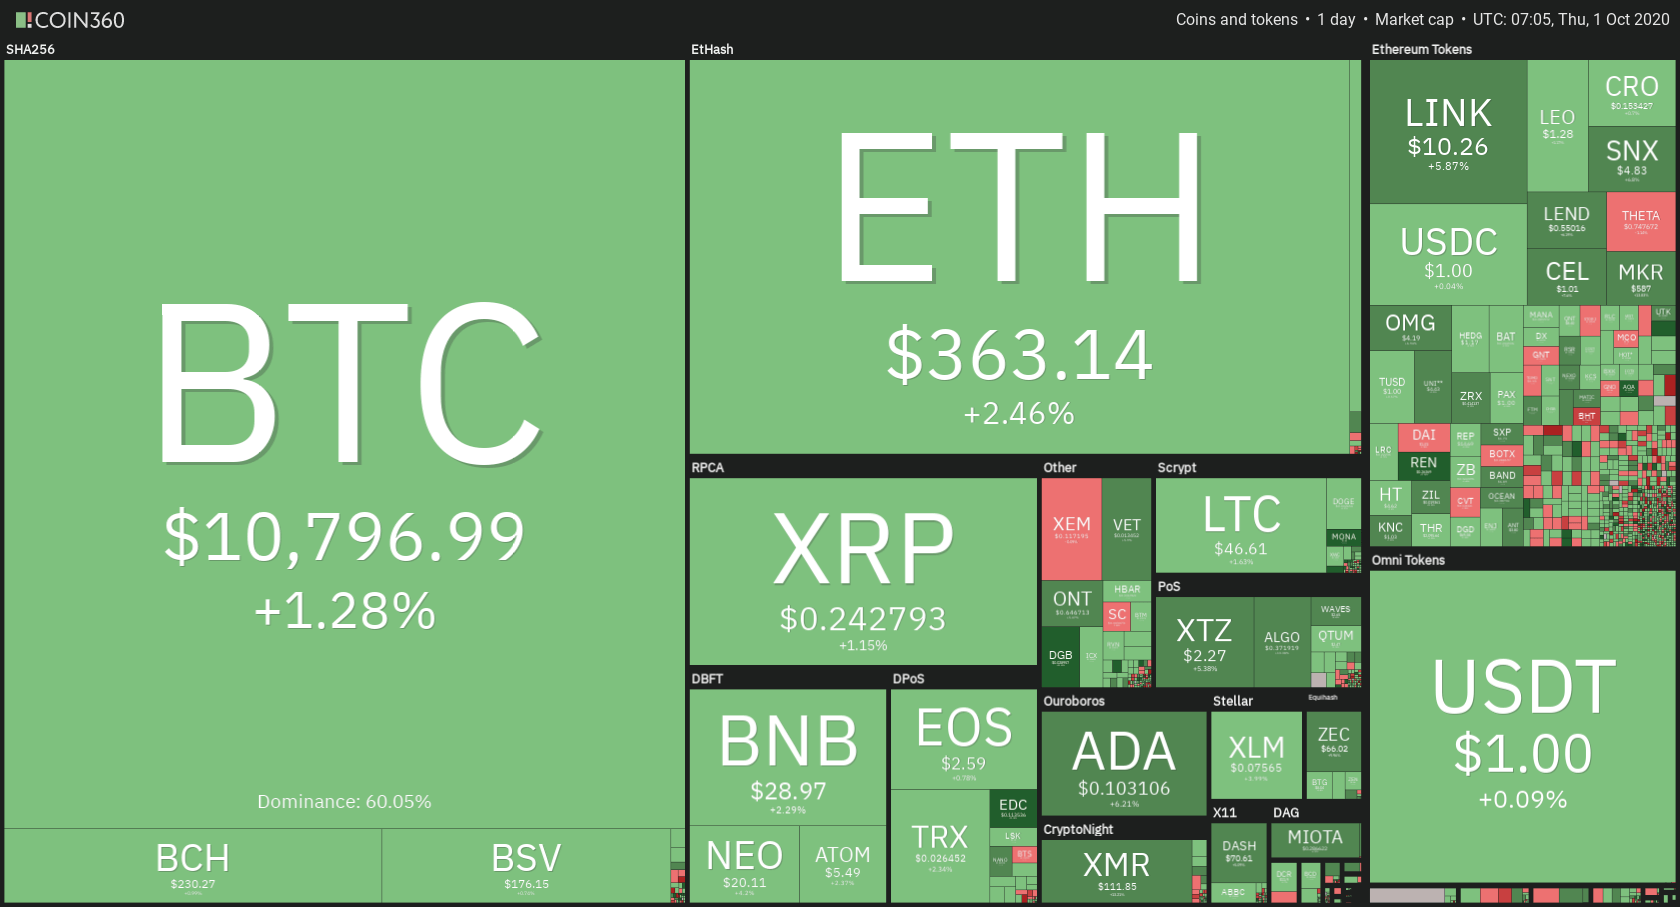
The cryptocurrency sector ended up the day in the green, with most cryptocurrencies rallying towards the upside. Bitcoin is currently trading for $10,796, representing an increase of 1.28% on the day. Meanwhile, Ethereum gained 2.46% on the day, while XRP gained 1.15%.
Daily Crypto Sector Heat Map
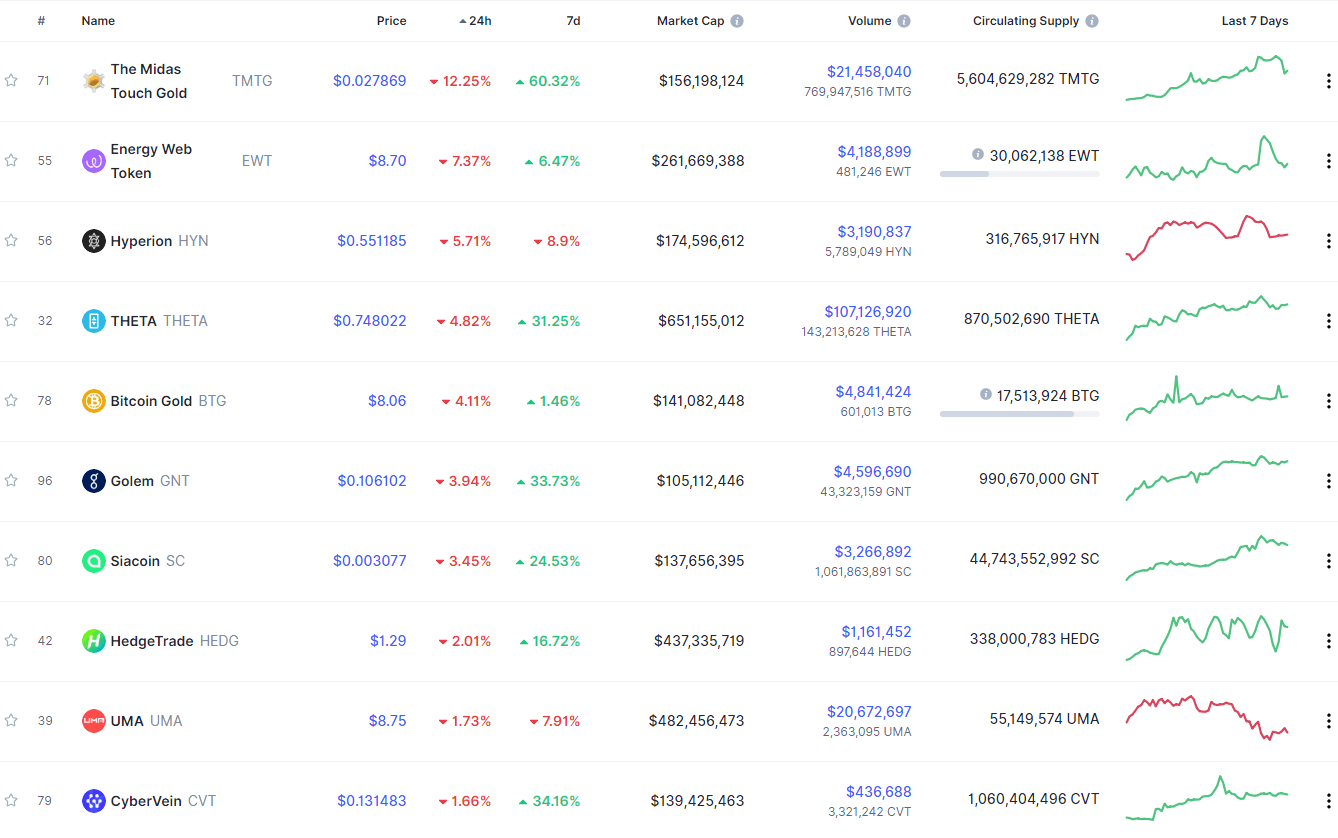
If we look at the top100 cryptocurrencies and their gains and losses, DigiByte gained 19.31% in the past 24 hours, making it the most prominent daily gainer. Ren (17.14%) and Maker (15.03%) also did great. On the other hand, The Midas Touch Gold lost 12.25%, making it the most prominent daily loser. It is followed by Energy Web Token’s loss of 7.37% and Hyperion’s loss of 5.71%.
Top 10 24-hour Performers (Click to enlarge)
Bottom 10 24-hour Performers (Click to enlarge)
Bitcoin’s level of market dominance decreased slightly since our last report, with its value currently being at 60.05%. This value represents a 0.43% difference to the downside when compared to when we last reported.
Daily Crypto Market Cap Chart
The crypto sector capitalization has gained in value over the course of the past 24 hours. Its current value is $349.36 billion, which represents an increase of $4.95 billion when compared to our previous report.
_______________________________________________________________________
What happened in the past 24 hours?
_______________________________________________________________________
- Bitcoin price risks even bigger pullback in Q4 after sharp rejections (Cointelegraph)
- Dash adjusts block reward percentage to improve the economics of its network (Cointelegraph)
- Twitter’s Dorsey Calls Out Coinbase CEO for Ignoring Users’ ‘Societal Issues’ (Coindesk)
- Top analyst explains why it’s likely Bitcoin, stocks will drift lower into elections (Cryptoslate)
- Augur Users Bet $111,000 on Presidential Elections After Biden, Trump Debate (Cryptobriefing)
- SIMETRI Made 480% Gains on These Small-Cap Cryptocurrencies: Performance Report (Cryptobriefing)
- Tron Is Beating Ethereum Activity Thanks to Gambling and Wash Trading, Says Report (Cryptobriefing)
- SEC wins court bid for the summary judgment in the ICO lawsuit against Kik (The Block)
- Will the ‘unambitious’ UK be left behind by Europe’s sweeping new crypto proposals? (The Block)
- SEC hits Salt Lending with cease-and-desist over $47 million ICO (The Block)
_______________________________________________________________________
Technical analysis
_______________________________________________________________________
Bitcoin
Bitcoin’s 1-day chart shows that slight bullish sentiment took over after Bitcoin broke the triangle formation to the upside, pushing its price towards the 38.2% Fib retracement, which has proven as a resistance area. It is key for Bitcoin to confidently establish its price above this level if it wants to tackle $11,000 any time soon. However, if this does not happen, we may expect pullbacks to the $10,360 area.
BTC/USD 1-day Chart
If we zoom in to the 4-hour chart, we can see that the bulls are desperately trying to break the $10,850 level (38.2% Fib retracement), but to no avail. If the level does fall, however, we expect it to be on increased volume. Also, if that happens, the push will probably be extended, and traders can catch a lucrative trade on the way down while Bitcoin pulls back.
BTC/USD 4-hour Chart
Bitcoin’s technicals are showing strength all-around, with both shorter and longer time-frames showing bullish sentiment. This may be an indicator of Bitcoin’s current strength and a possible push past $10,850.
BTC/USD 4-hour Technicals
Technical factors (4-hour Chart):
- Price is slightly above both its 50-period EMA and its 21-period EMA
- Price is right above its middle Bollinger band
- RSI is neutral (56.31)
- Volume is average
Key levels to the upside Key levels to the downside
1: $10,850 1: $10,630
2: $11,000 2: $10,500
3: $11,090 3: $10,015
Ethereum
Ethereum has shown some strength in the past 24 hours. Its price pattern of making higher highs and higher lows has been interrupted by a lower high and a lower low the past day. On the other hand, its current price movement seems to ignore this bearish sign and is pushing higher towards the $371 level. It seems that, however, $371 will not be reached as the volume is descending and showing a lack of interest in any volatility from both bulls and bears.
When it comes to any form of price direction prediction, traders are torn between putting Ethereum’s current movement in an ascending trend and calling for a rally towards the upside, or calling the most recent lower high/lower low combo a break of the ascending trend, and calling for a push towards the downside.
ETH/USD 4-hour Chart
Both Ethereum’s short-term and long-term technical overviews are tilted towards the buy-side. While its longer-term technicals were always bullish, its 4-hour and 1-day overviews changed from bearish to bullish since we last reported, indicating that the bullish traders might be in the right when it comes to Ethereum’s next move.
ETH/USD 4-hour Technicals
Technical Factors (4-hour Chart):
- The price is above both its 50-period and its 21-period EMA
- The price is above its middle Bollinger band
- RSI is pushing towards the overbought area (59.99)
- Volume is below average
Key levels to the upside Key levels to the downside
1: $360 1: $340
2: $371 2: $300
3: $400 3: $289
Ripple
XRP has been trading sideways near its $0.2454 resistance level and tried to break it several times. However, each time failed, and the cryptocurrency had to pull back towards the middle of the range and prepare for its next move. XRP’s low volume and low volatility may be confirming that it is just preparing for the next big move, but the direction is currently unknown. If it rallies towards the upside, traders can either join the extended leg up or trade the pullback. If the price moves down, traders can either trade a bounce off of the $0.235 or wait for a possible break of this support level.
XRP/USD 4-hour Chart
XRP technicals are seemingly always the most interesting and confusing. When it comes to short time-frames, the 4-hour outlook is mixed (but tilted slightly towards the buy-side), while the daily outlook is slightly bearish. Its weekly outlook is back to bullish, while its monthly technicals show bearish sentiment.
XRP/USD 4-hour Technicals
Technical factors (4-hour Chart):
- The price is slightly above both its 50-period EMA and its 21-period EMA
- Price is at its middle Bollinger band
- RSI is neutral (51.39)
- Volume is stable, and average
Key levels to the upside Key levels to the downside
1: $0.2454 1: $0.235
2: $0.266 2: $0.227
3: $0.27 3: $0.221


One reply on “Daily Crypto Review, Oct 1 – Bitcoin Fighting for $10,850; Ethereum Bulls Rallying Against All Odds”
great analysis thank you