
The cryptocurrency sector as a whole has experienced a slight decrease as Bitcoin continued to path towards the downside. Bitcoin is currently trading for $10,525, representing a decrease of 0.47% on the day. Meanwhile, Ethereum lost 0.95% on the day, while XRP lost 1.09%.

Daily Crypto Sector Heat Map
If we look at the top 100 cryptocurrencies, we can see that Ren gained 11.19% in the past 24 hours, making it the most prominent daily gainer. The Midas Touch Gold (9.72%) and PumaPay (7.65%) also did great. On the other hand, Hyperion lost 66.26%, making it the most prominent daily loser. It is followed by yearn.finance’s loss of 13.34% and Kusama’s loss of 11.08%.
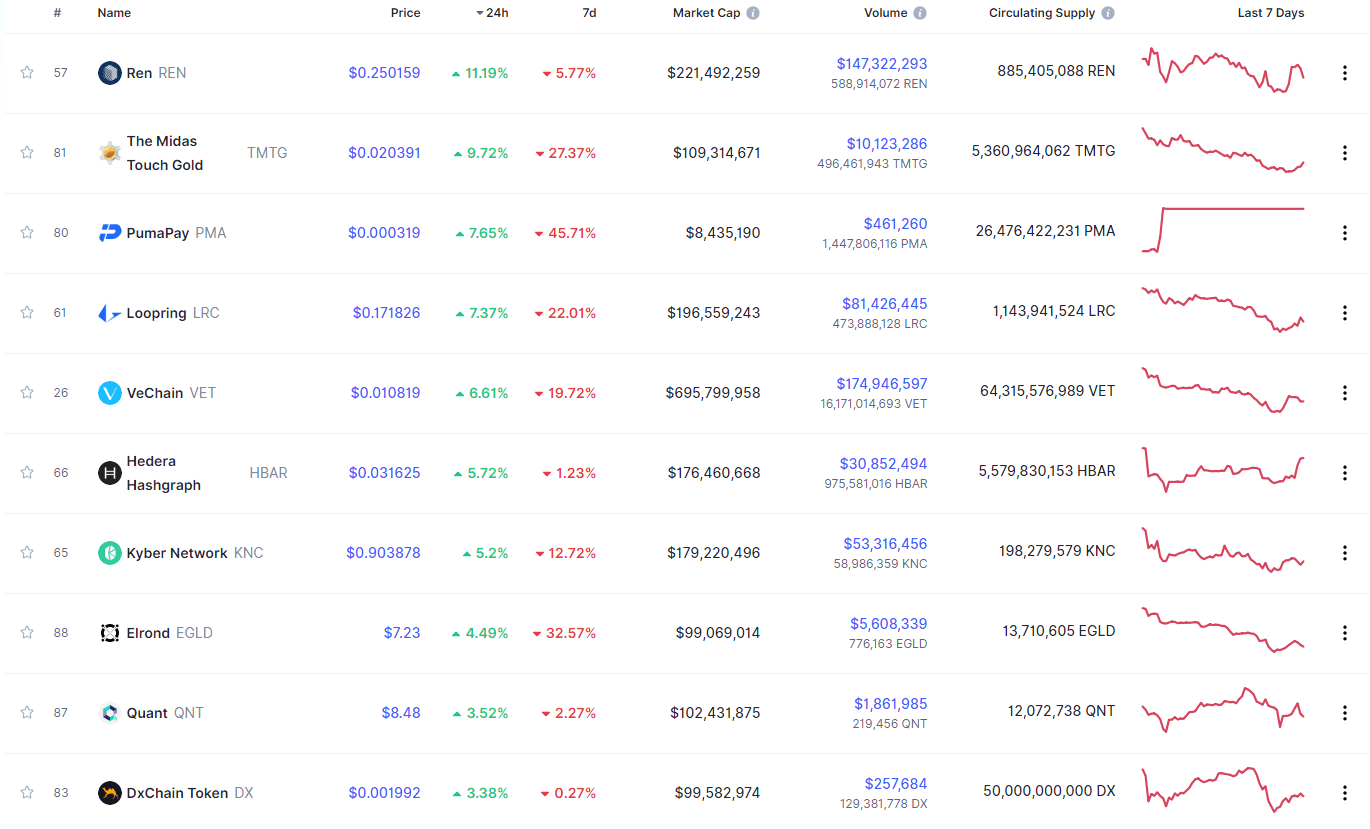
Top 10 24-hour Performers (Click to enlarge)
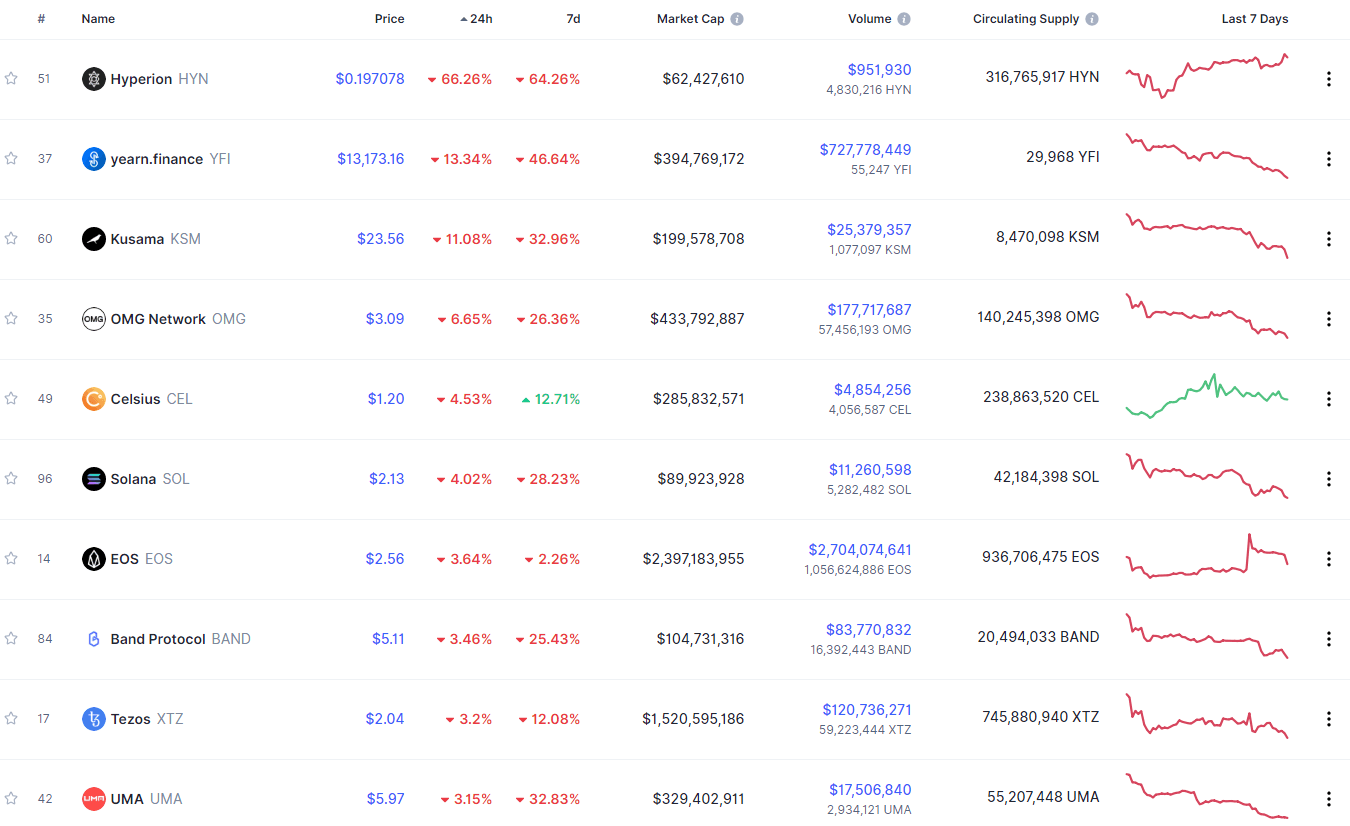
Bottom 10 24-hour Performers (Click to enlarge)
Bitcoin’s market dominance level has stayed at the same place since our last report, with its value currently being at 60.96%. This value represents a 0.1% difference to the upside when compared to when we last reported.
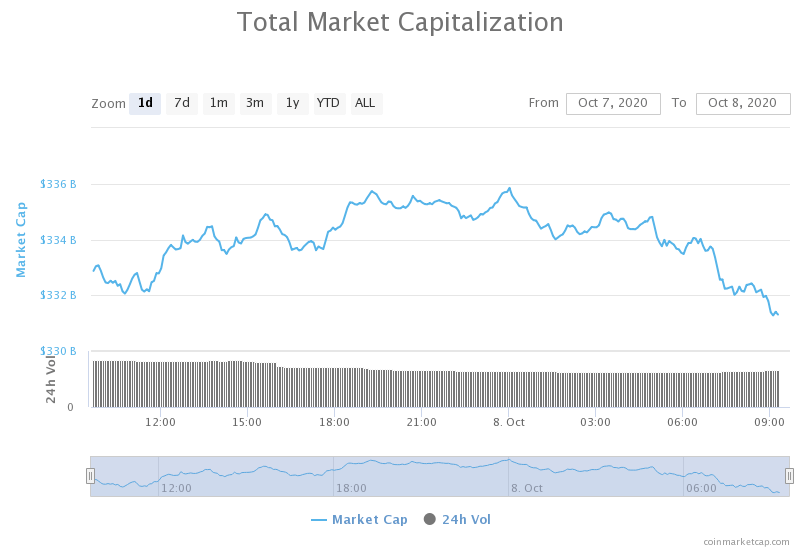
Daily Crypto Market Cap Chart
The crypto sector capitalization has lost a bit of value over the course of the past 24 hours. Its current value is $333.12 billion, representing a decrease of $2.28billion compared to our previous report.
_______________________________________________________________________
What happened in the past 24 hours?
_______________________________________________________________________
- Ethereum hashrate has hit a new all-time high amid DeFi growth (The Block)
- BitMEX announces leadership changes after U.S. government charges, Arthur Hayes no longer CEO (The Block)
- Ex-JP Morgan investment banker gives 5 reasons why DeFi is reaching “escape velocity” (Cryptoslate)
- New Bitcoin addresses shoot “off the charts” despite price drop (Cryptoslate)
- Xfers Launches Fully-Regulated Digital Singapore Dollar on Ethereum and Zilliqa (Cryptobriefing)
- Ripple Rebrands Products Amidst Tentative Plans to Leave US (Cryptobriefing)
- NEO Finally Flashes Buy Signal Following a 40% Correction (Cryptobriefing)
- KuCoin Exchange Reopens Bitcoin, Ethereum Withdrawals After $281M Hack (Cryptobriefing)
- Coinbase’s ‘Mission’ Violates the Spirit of Bitcoin (Coindesk)
- Wrapped Bitcoin tops $1B after a 900% increase in two months
While the top cryptocurrencies lost only a fraction of their respective market capitalization value, the DeFi market has deflated drastically. It is estimated that the daily DeFi token trade volumes have dropped by 30% combined, while recent market leaders Sushi, Uniswap, and yearn.finance are among the hardest hit with weekly losses of as much as 51%, 38%, and 31%, respectively. On top of that, the Binance DeFi composite index dropped over 20% yesterday, and 63% from its first trading day in August.
However, this is not the end of DeFi, but rather a small pop of the inflated price bubble. The DeFi market has seen various “whales” accumulating DeFi tokens and using its protocols, which is a great sign that this part of the crypto sector is here to stay.
_______________________________________________________________________
Technical analysis
_______________________________________________________________________
Bitcoin
The largest cryptocurrency by market cap has continued moving down and testing its support levels. This time, Bitcoin tested the $10,500 level, which held up nicely (for now). While the immediate sentiment is certainly bearish, there isn’t enough volume to test and break the $10,360 level, which is crucial for the future price development of Bitcoin.
While short-term traders are mostly tilted towards the sell-side due to both macroeconomic events and technical analysis, investors are quite bullish on Bitcoin simply due to how the largest cryptocurrency develops in terms of usability, adoption, and other fundamental concepts.
BTC/USD 4-hour Chart
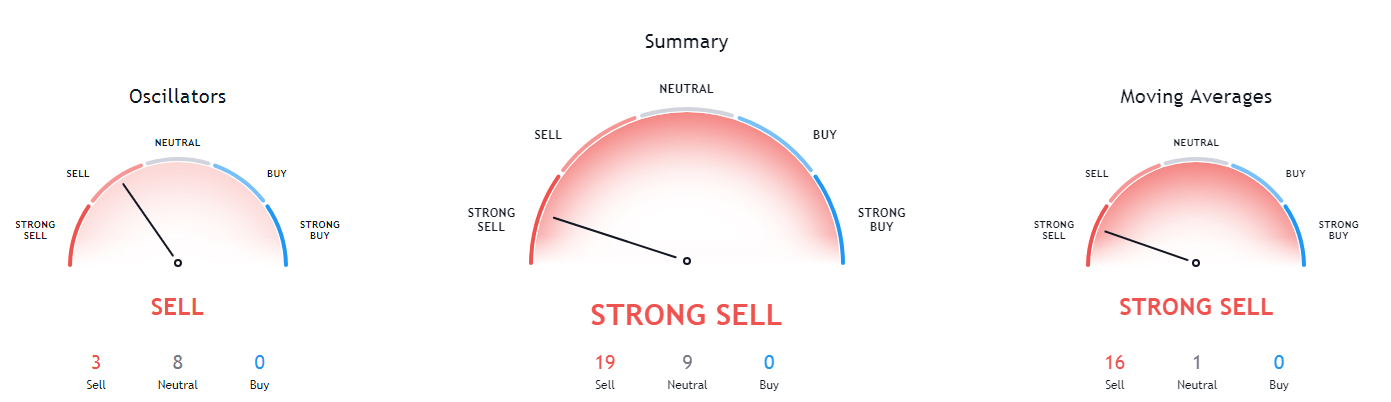
Bitcoin’s technical overview follows what we previously said, with short-term technicals being bearish, while the longer-term ones are bullish. Its 4-hour and 1-day overview tilting towards the downside, while its longer-term technicals have remained bullish.
BTC/USD 4-hour Technicals
Technical factors (4-hour Chart):
- Price is below both its 50-period EMA and 21-period EMA
- Price is near the bottom Bollinger band
- RSI is neutral (42.08)
- Volume is average
Key levels to the upside Key levels to the downside
1: $10,630 1: $10,500
2: $10,850 2: $10,360
3: $11,000 3: $10,015
Ethereum
Ethereum was moving towards the downside throughout the day, testing its $334 support level once again. Trading volume faded as Ethereum couldn’t break this support, therefore staying above $334. On top of that, the near-oversold RSI oscillator shows that the move might be over for the time being.
As we mentioned many times now, traders should be careful and pay attention to any increase in volume, but should ultimately try to trade Ethereum’s movements between $334 and $360.
ETH/USD 4-hour Chart
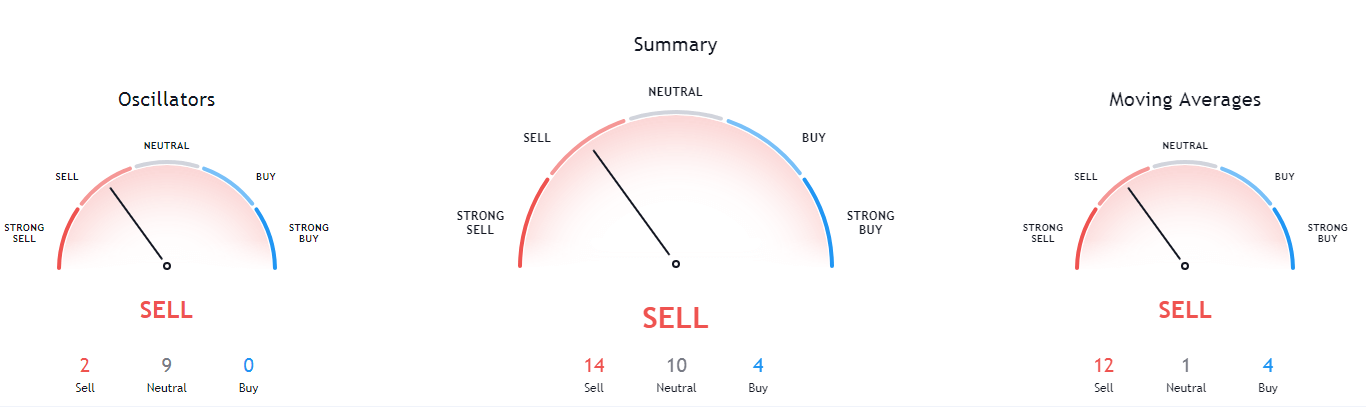
Ethereum’s short-term and long-term technical overviews both look very similar to Bitcoin’s. While its short-term technicals (4-hour and 1-day) are heavily tilted towards the sell-side, its weekly and monthly outlooks are still quite bullish (though the bearish sentiment in short-term technicals is stronger than with Bitcoin, while the bullishness of its long-term overviews is weaker than with Bitcoin).
ETH/USD 4-hour Technicals
Technical Factors (4-hour Chart):
- The price is below both its 50-period and 21-period EMA
- The price is at its lower Bollinger band
- RSI is neutral (37.59)
- Volume is descending
Key levels to the upside Key levels to the downside
1: $360 1: $334
2: $371 2: $300
3: $400 3: $289
Ripple
XRP did not differ much from the aforementioned two cryptocurrencies, and pushed towards the downside itself as well. The third-largest cryptocurrency by market cap has broken the $0.2454 level to the downside and entered the “safe zone” between $0.235 and $0.2454. However, the fight for $0.2454 is not over yet, and XRP still has a chance to regain this high, even though it is highly unlikely at this point.
XRP will most likely stay below $0.2454, and traders can use that to their advantage when trading as they could trade XRP’s sideways movements.
XRP/USD 4-hour Chart
XRP 4-hour overview is tilted towards the sell-side, while its daily and weekly overviews are completely bullish. However, its monthly overview is just as bearish as the 4-hour one, showing signs of pre-established bearish sentiment.
XRP/USD 4-hour Technicals
Technical factors (4-hour Chart):
- The price is at its 50-period EMA and below its 21-period EMA
- Price is close to its bottom Bollinger band
- RSI is neutral (46.60)
- Volume is average
Key levels to the upside Key levels to the downside
1: $0.266 1: $0.2454
2: $0.27 2: $0.235
3: $0.273 3: $0.227
Related posts
 Daily Crypto Review, Sept 21 – Crypto Market is Preparing For a Bearish Move; UNI Token Booming
 Daily Crypto Review, Sept 24 – Bitcoin Following Gold: $9,300 On The Horizon
 Daily Crypto Review, Nov 2 – Ethereum’s Price Explodes; Bitcoin’s Whitepaper Celebrates its 12th Birthday
 Daily Crypto Review, Nov 6 – Bitcoin Zooming Past $15,000: How Far Can it Go Before Pulling Back?