
The cryptocurrency sector has spent the past 24, mostly consolidating, as it failed to reach past its resistance levels on Monday. Bitcoin is currently trading for $19,180, representing a decrease of 0.65% compared to our last report. Meanwhile, Ethereum’s price has decreased by 1.14% on the day, while XRP managed to lose 1.65%.
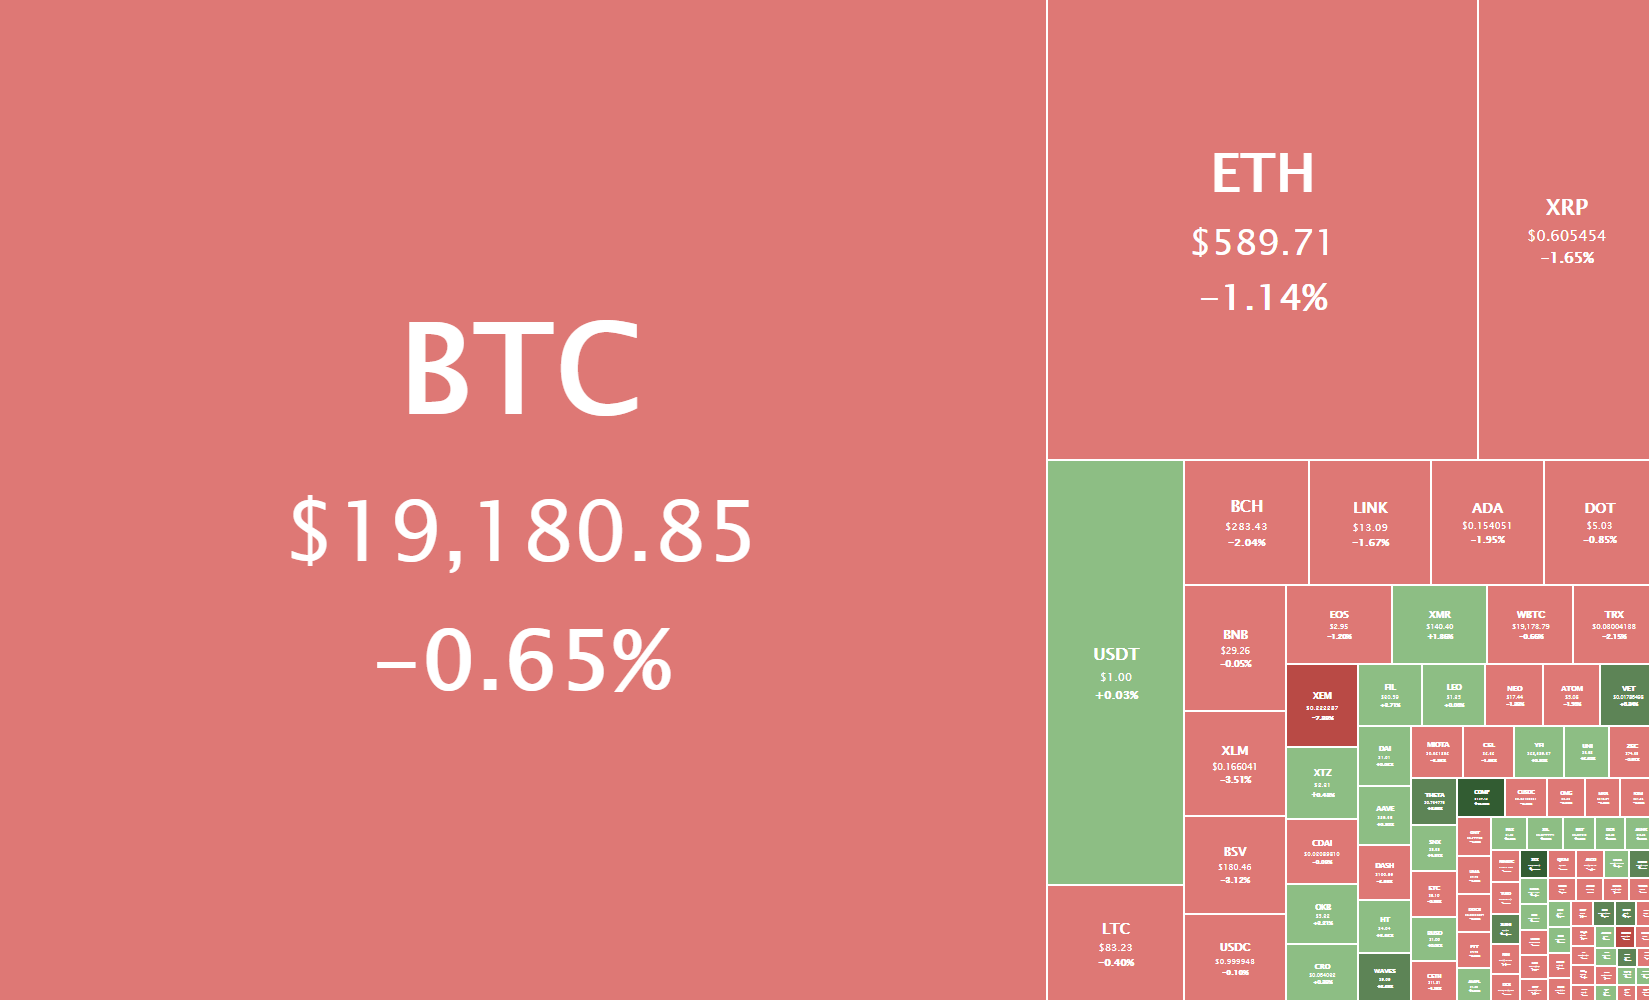
Daily Crypto Sector Heat Map
Prophet gained 358.97% in the past 24 hours, making it the most prominent daily crypto gainer. It is closely followed by Seigniorage Shares’ 344.54% and xBTC’s 340.23% gain. On the other hand, CryptoBet lost 95.85%, making it the most prominent daily loser. It is followed by Semux’s loss of 90.60% and Bitball Nyan v2’s loss of 51.05%.
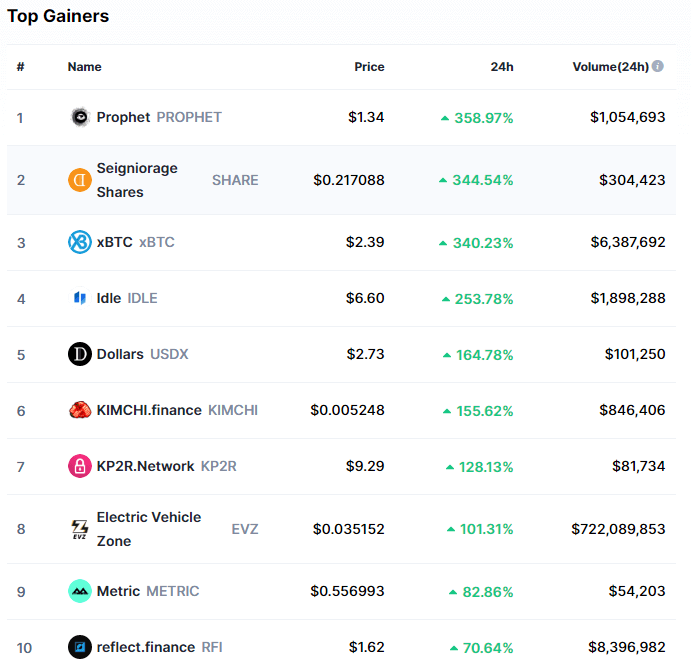
Top 10 24-hour Performers (Click to enlarge)
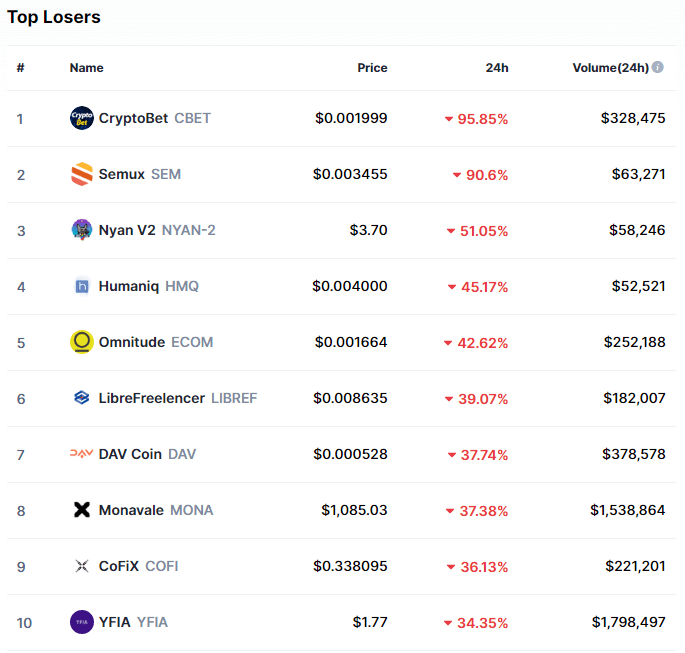
Bottom 10 24-hour Performers (Click to enlarge)
Bitcoin’s market dominance has moved to the upside over half a percent since we last reported, with its value currently being 62.6%. This value represents a difference of 0.6% to the upside when compared to yesterday’s value.
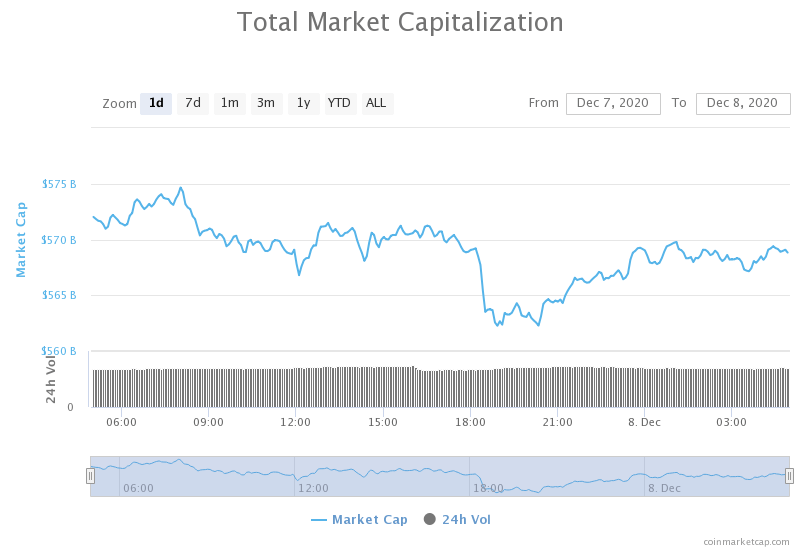
Daily Crypto Market Cap Chart
The crypto sector capitalization has increased in the past 24 hours, with its current value being $568.82 51.68 billion. This represents a $17.24 billion increase when compared to our previous report.
_______________________________________________________________________
What happened in the past 24 hours?
_______________________________________________________________________
- Carpe ‘Diem’: Lawsuit threatened over Facebook’s Libra rebrand plan (Cointelegraph)
- Key Bitcoin futures metrics show traders are bullish despite flat BTC price (Cointelegraph)
- Spain’s Second-Largest Bank Will Soon Launch Crypto Services: Sources (Coindesk)
- The average DeFi coin is up 50% since the end of October, outperforming Bitcoin’s 38% rally (Cryptoslate)
- Coinbase Pro Adds Support for Filecoin, FIL Jumps 6% (Cryptobriefing)
- Blockstack Says STX Will Become a Non-Security Asset (Cryptobriefing)
- XRP Looks Toward 60% Breakout Despite Consolidation (Cryptobriefing)
- Crypto assets discussed during G7 meeting, states US Treasury Department (The Block)
- MicroStrategy wants to raise $400 million via convertible notes and use the funds to buy bitcoin with the net proceeds (The Block)
- Coinbase’s Web traffic surges 64% when compared to the previous month as exchanges see 158.8 million visits in November (The Block)
_______________________________________________________________________
Technical analysis
_______________________________________________________________________
Bitcoin
Bitcoin has continued with its slow movement as another low volatility day passed. The largest cryptocurrency by market cap oscillated between $18,905 and $19,431. The one time it dropped under the $19,000 mark, it found support in the 50-period moving average, which has proven to be a strong (both support and resistance) level.
Due to the low volatility, traders can’t really do much at the moment. However, they can prepare for the next move Bitcoin makes.
Lastly, the Hash Ribbons (one of the best accumulation indicators) indicator has posted a buy signal, giving long-term investors the green light.
BTC/USD 4-hour chart
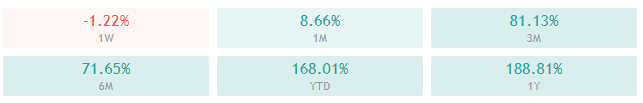
Bitcoin’s technicals on both short and long time-frames are bullish, with its weekly time-frame showing full tilt to the buy-side and its 4-hour, daily, and monthly time-frames tilting more towards neutrality.
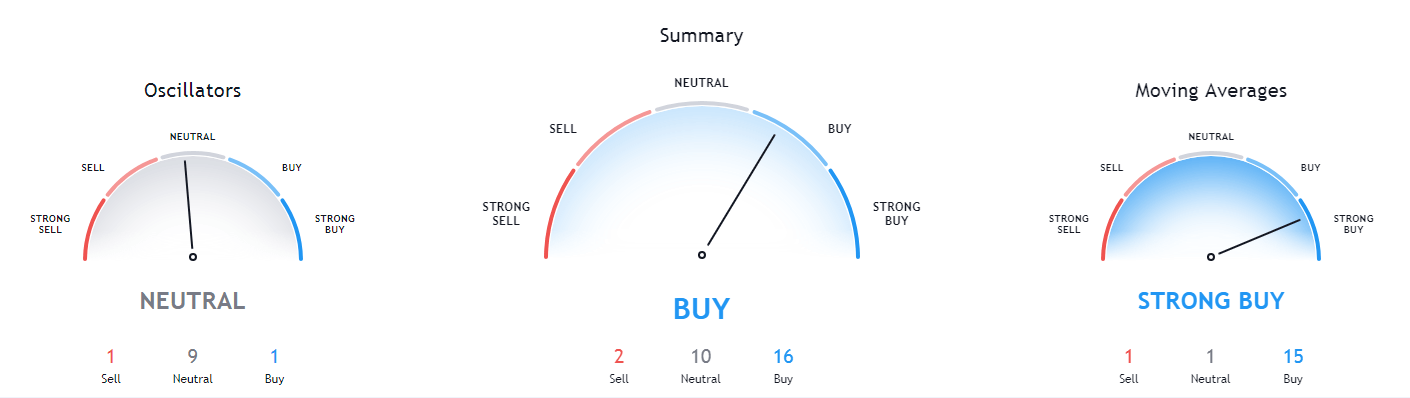
BTC/USD 1-day Technicals
Technical factors (4-hour Chart):
- Price is slightly above its 50-period EMA while being at its 21-period EMA
- Price is at its middle Bollinger band
- RSI is neutral (51.61)
- Volume is slightly below average
Key levels to the upside Key levels to the downside
1: $19,500 1: $19,000
2: $19,666 2: $18,790
3: $20,000 3: $18,600
Ethereum
Ethereum has, just like Bitcoin, had quite a slow day, with its price moving slightly down. At the moment, the second-largest cryptocurrency by market cap doesn’t seem like it will tackle $600, as its volume is too low to pressure this major resistance level. However, if and when a bull run past $600 happens, traders will have a great opportunity to catch a safe trade with a stop-loss slightly below $600 and a possible target of $620 or $630.
ETH/USD 4-hour Chart
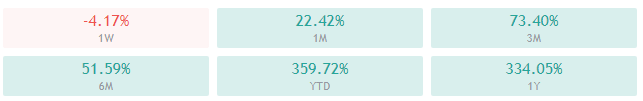
Ethereum’s monthly overview shows a full tilt towards the buy-side, while its daily and weekly overviews show some signs of neutrality. On the other hand, its 4-hour overview is completely bearish.

ETH/USD 1-day Technicals
Technical Factors (4-hour Chart):
- The price is slightly above its 50-period EMA while being slightly below its 21-period EMA
- Price is at its middle Bollinger band
- RSI is neutral (48.32)
- Volume is below average
Key levels to the upside Key levels to the downside
1: $620 1: $600
2: $630 2: $530
3: $735 3: $510
Ripple
The fourth-largest cryptocurrency by market cap has close to no volatility, as well as very low volume on most exchanges. With the price movement being non-existent, there is not much to say about the current XRP trading. However, whenever the trading range is getting this narrow, a breakout is on the horizon.
XRP has created a flag formation on the 1-day chart, signaling that an increase in volume could bring a breakout to the upside and a possible spike of up to 60%, which would take the coin’s price above $1,00.
XRP/USD 4-hour Chart
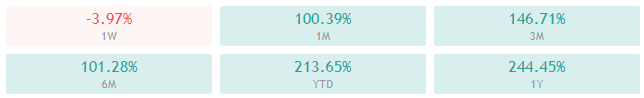
XRP’s longer time-frames (weekly and monthly) show complete bullishness, while its 4-hour and daily overviews show some signs of neutrality or even bearishness.
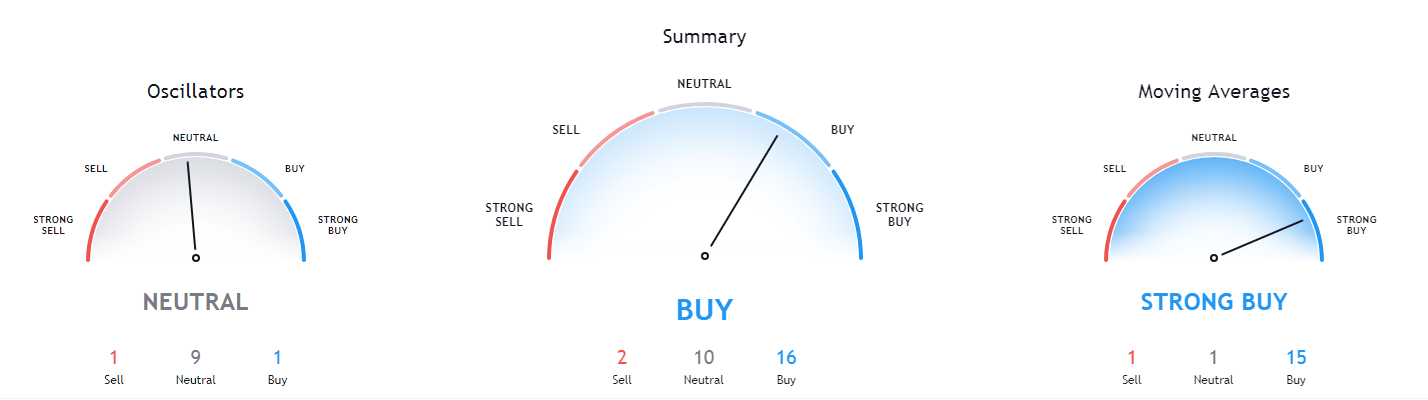
XRP/USD 1-day Technicals
Technical factors (4-hour Chart):
- The price is at its 50-period EMA, as well as at its 21-period EMA
- Price is at its middle Bollinger band
- RSI is neutral (50.46)
- Volume is well below average
Key levels to the upside Key levels to the downside
1: $0.666 1: $0.6
2: $0.78 2: $0.596
3: $0.79 3: $0.535
Related posts
 Daily Crypto Review, Apr 9 – BCH surges after halving, BSV outperforming
 Daily Crypto Review, Apr 17 – Bitcoin above $7,000; The US expanding on the idea of the Digital Dollar
 Daily Crypto Review, Apr 20 – Blockchain Jobs Booming; Lightning Network Unsafe?
 Daily Crypto Review, August 18 – Crypto Fundamentals Booming: Bitcoin Above $12,000; XRP Skyrocketing to $0.315