
The cryptocurrency market made another slight move towards the upside in the past 24 hours. Bitcoin is currently trading for $9,414, which represents an increase of 1.39% on the day. Meanwhile, Ethereum gained 2.91% on the day, while XRP gained 3.34%.

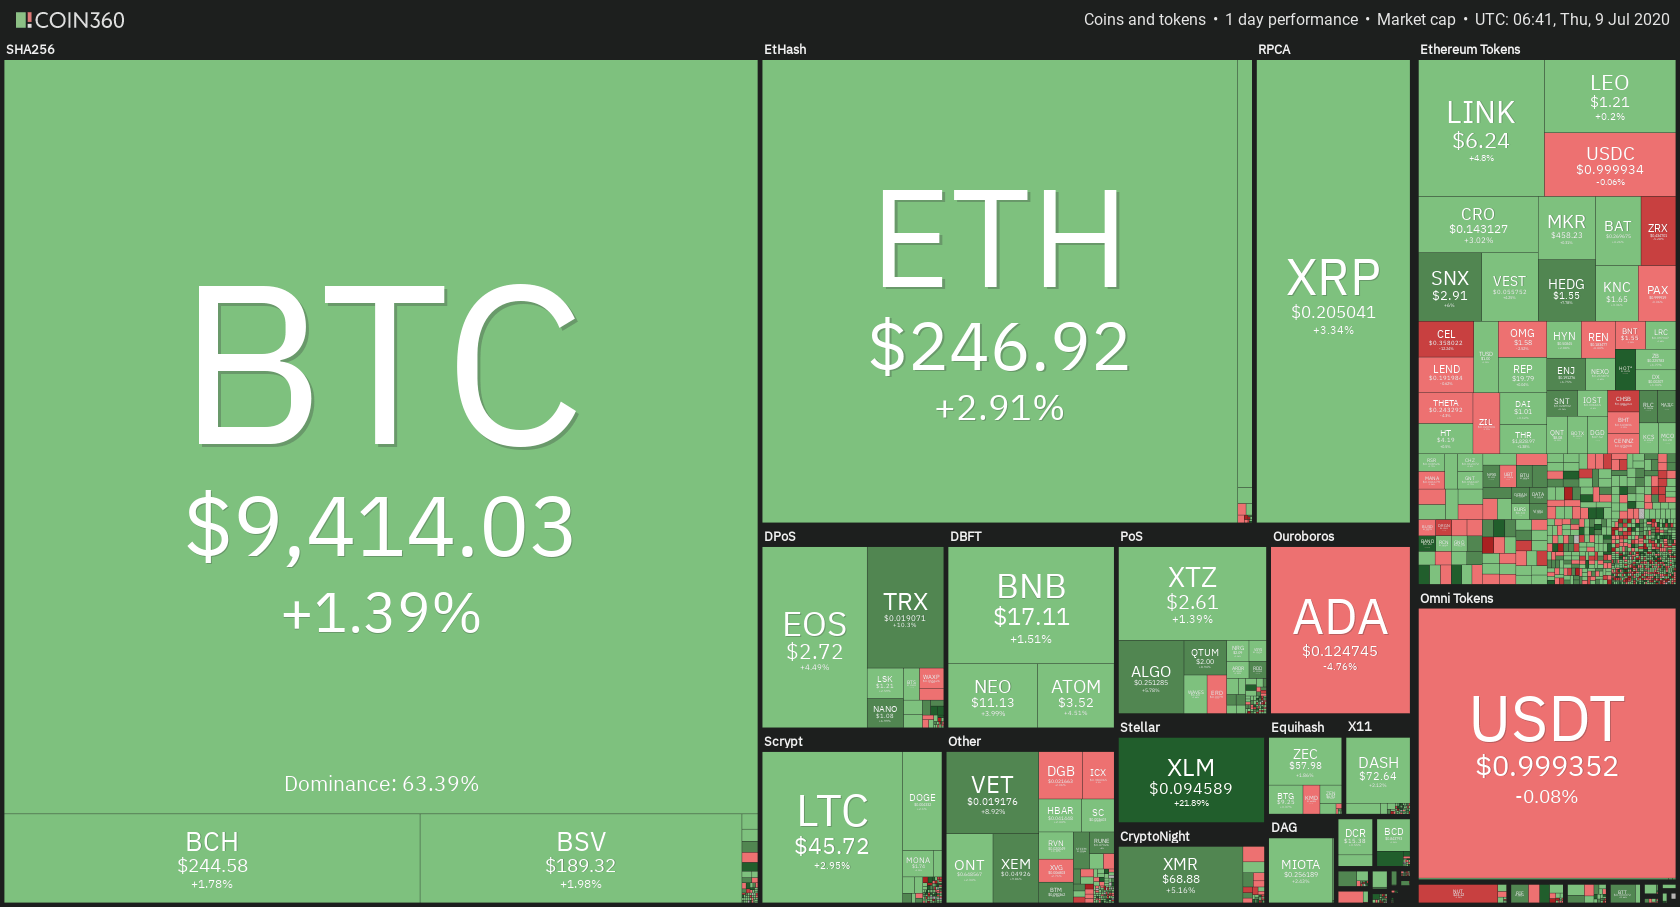 Daily Crypto Sector Heat Map
When talking about top100 cryptocurrencies, Holo gained 40.15% on the day, making it by far the most prominent daily gainer. Stellar (20.70%) and Nervos Network (16.73%) also did great. On the other hand, Quant has lost 11.42%, making it the most prominent daily loser. It is followed by SwissBorg’s loss of 6.36% and Cardano’s loss of 6.16%.
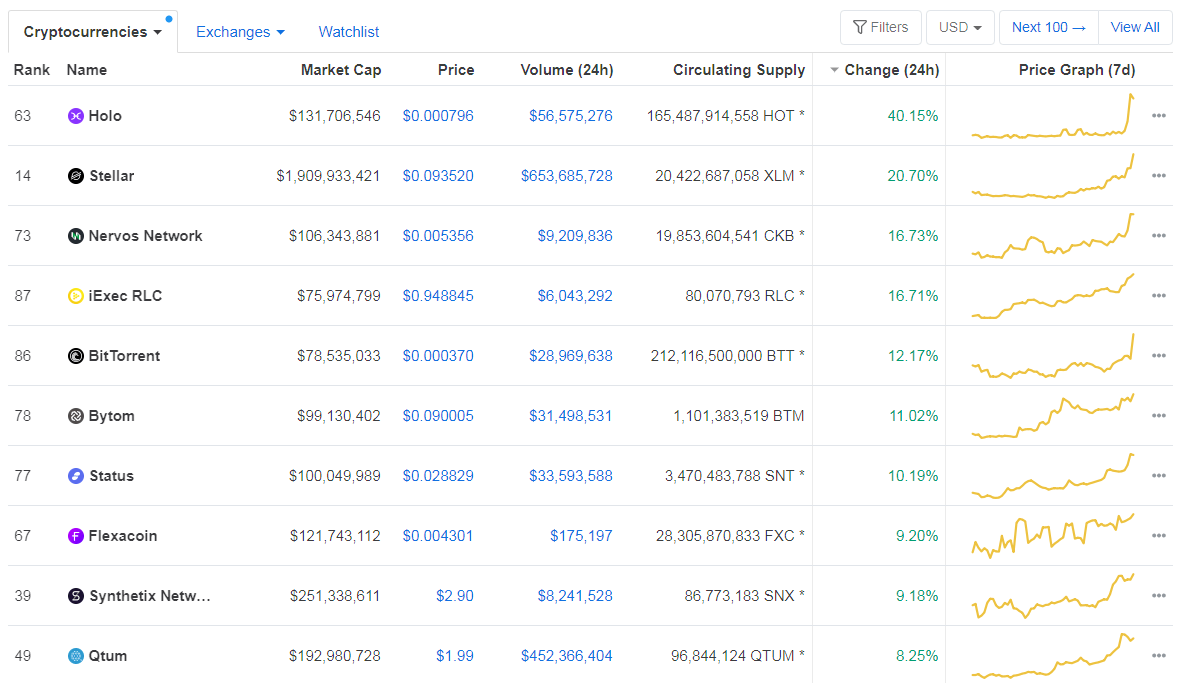
Top 10 24-hour Performers (Click to enlarge)
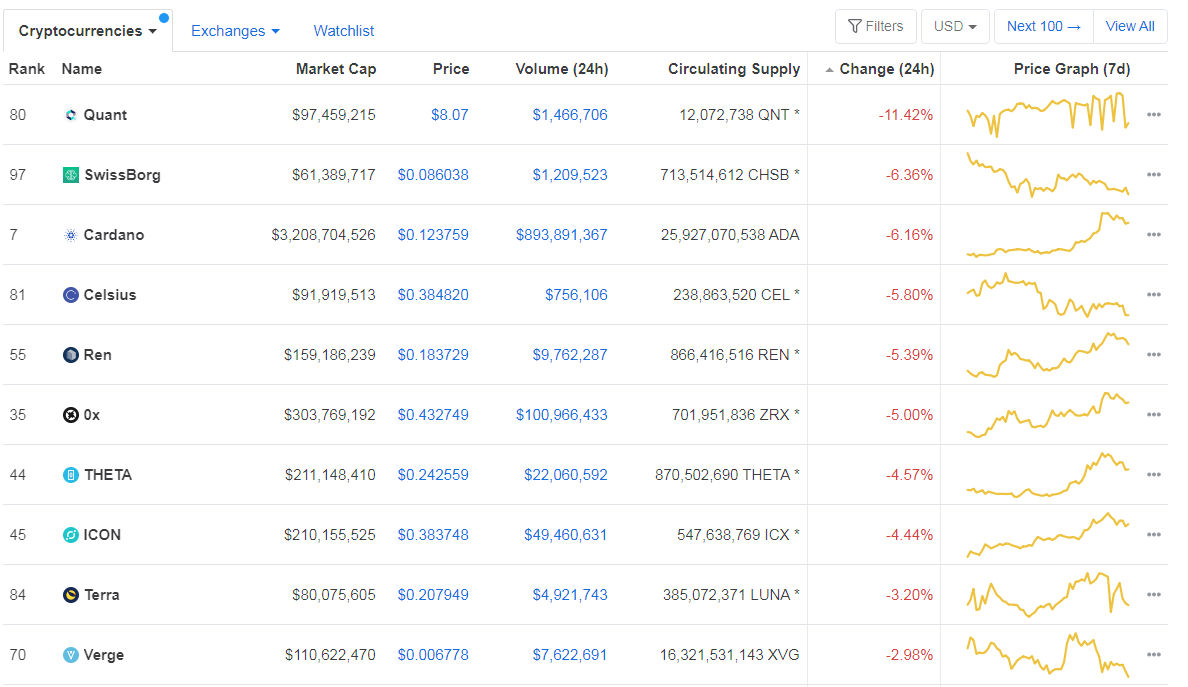
Bottom 10 24-hour Performers (Click to enlarge)
Bitcoin’s dominance level increased since we last reported, with its value currently at 63.39%. This value represents a 0.14% difference to the upside when compared to yesterday’s value.
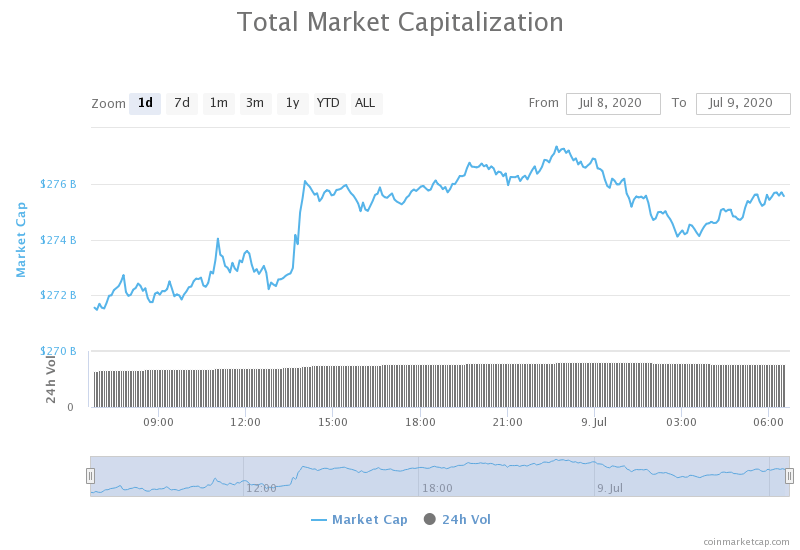
Daily Crypto Market Cap Chart
The cryptocurrency market capitalization increased slightly when compared to when we last reported, with the market’s current value being $275.70 billion. This value represents an increase of $3.55 billion when compared to the value it had yesterday.
_______________________________________________________________________
What happened in the past 24 hours?
_______________________________________________________________________
- Here are the numbers behind TikTok’s crazy Dogecoin moment (The Block)
- Galaxy Digital’s next step on the road to becoming the Goldman Sachs of crypto: prime brokerage (The Block)
- Former Goldman CFO breaks down why a digital dollar is better than bitcoin and stablecoins (The Block)
- Italian Banking Industry Chose Decentralization Over Centralization (Cointelegraph)
- $100,000 USDC Blacklisted, Highlighting Importance of Decentralized Stablecoins (Cryptobriefing)
- Ethereum miners set a record for revenue from transaction fees in June (The Block)
- Introducing the CoinDesk 20: The Assets That Matter Most in Crypto (Coindesk)
- Monex Becomes First Japanese Securities Firm to List Cryptocurrency CFD (Cointelegraph)
- ‘Fireworks Are Coming’ — FX Markets Will Boost Bitcoin, Says Analyst (Cointelegraph)
- Kraken Discovers Potential Attacks Against Ledger Wallets, User Funds Unaffected (Cointelegraph)
_______________________________________________________________________
Technical analysis
_______________________________________________________________________
Bitcoin
The largest cryptocurrency by market capitalization has made another move towards the upside as bulls gathered up. The price managed to push above the descending trend line and reach just shy of $9,500 before returning down to test the newly conquered line as a support level. The line was tested successfully, and Bitcoin seems like it’s consolidating at the $9,400 level.
As mentioned yesterday, the descending line forced a move on Bitcoin, which ended up in BTC crossing to the upside. As with most BTC trades, trading confirmations and pullbacks are the safest way to profit.
BTC/USD 4-hour Chart
Technical factors:
- Price is above its 50-period EMA and its 21-period EMA
- Price is between the upper B.B. and middle line (20-period SMA)
- RSI at the upper levels (65.5)
- Increased volume (returning to average)
Key levels to the upside Key levels to the downside
1: $9,580 1: $9,251
2: $9,735 2: $9,120
3: $9,870 3: $8,980
Ethereum
Ethereum made a move towards the upside as well. In fact, it broke a much stronger resistance level than Bitcoin. The ascending resistance level was broken as volume skyrocketed, but the price fell back under it during the confirmation period. However, Ethereum passed to the upside again, where it is now. It is important to note that this price level is unstable because it has not been properly confirmed, as well as because the line is moving sharply towards the upside, which Ethereum might not be able to follow for a long period of time.
Ethereum traders should look for an opportunity to trade around the ascending line (possibly when ETH falls back under it again).
ETH/USD 4-hour Chart
Technical Factors:
- Price above the 50-period EMA and the 21-period EMA
- Price slightly below the upper B.B.
- RSI almost in the overbought territory (68)
- Increased volume
Key levels to the upside Key levels to the downside
1: $240 1: $228
2: $251.4 2: $225.4
3: $260 3: $217.7
Ripple
The third-largest cryptocurrency by market cap had much more uniformed moves. After days of almost no volume and volatility, the past couple of days have been extremely interesting for XRP’s price. XRP managed to break the $0.19 resistance (now support) yesterday, while its most recent spike brought its price above $0.2. However, the move got stopped at the $0.205 resistance level a couple of times, so XRP is now trading within a small range.
XRP traders can look for an opportunity to trade now since XRP is trading within a range bound by $0.2 and $0.205.
XRP/USD 4-hour Chart
Technical factors:
- XRP in a mid-term descending trend (though it broke the trend in the short-term)
- XRP lacks strong support levels below $0.178
- Price is above the 21 and 50-period EMA
- Price slightly below the upper B.B.
- RSI is in the overbought territory (71)
- Increased volume
Key levels to the upside Key levels to the downside
1: $0.205 1: $0.2
2: $0.214 2: $0.19
3: $0.227 3:$0.178
Related posts
 Daily Crypto Review, Sept 16 – Ethereum Facing a 35% Drop; Bitcoin Remains Bullish
 Daily Crypto Review, Sept 17 – Bitcoin Above $11,000; XRP Skyrocketing
 Daily Crypto Review, Sept 22 – Crypto Sector Plummets Alongside Stocks and Gold; Markets Preparing for the US Presidential Election
 Daily Crypto Review, Oct 20 – Bitcoin Above $12,000 by the End of the Month? Bull Market has Already Started