
The cryptocurrency market had a day without much movement. Bitcoin is currently trading for $11,166, which represents a decrease of 1.52% on the day. Meanwhile, Ethereum lost 2.66% on the day, while XRP lost 6%.

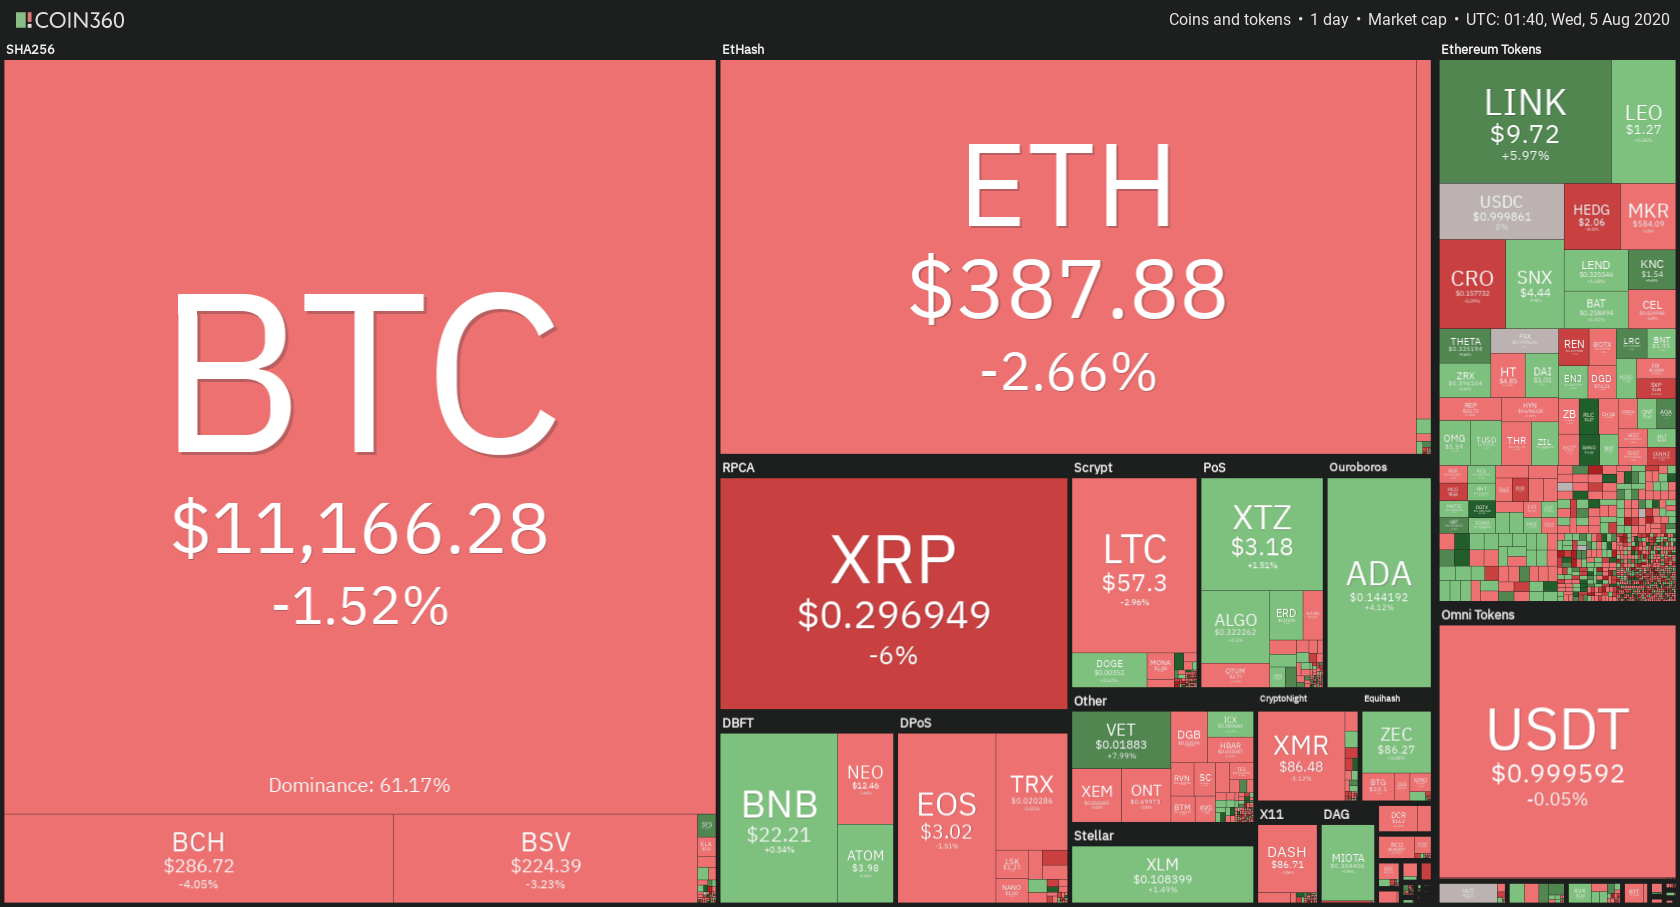
Daily Crypto Sector Heat Map
When talking about top100 cryptocurrencies, Band Protocol gained 15.33% on the day, making it the most prominent daily gainer. The Midas Touch (13.97%) and Kava.io (12.79%) also did great. On the other hand, Quant has lost 15.75%, making it the most prominent daily loser. It is followed by Ampleforth’s loss of 14.84% and MCO’s loss of 11.32%.
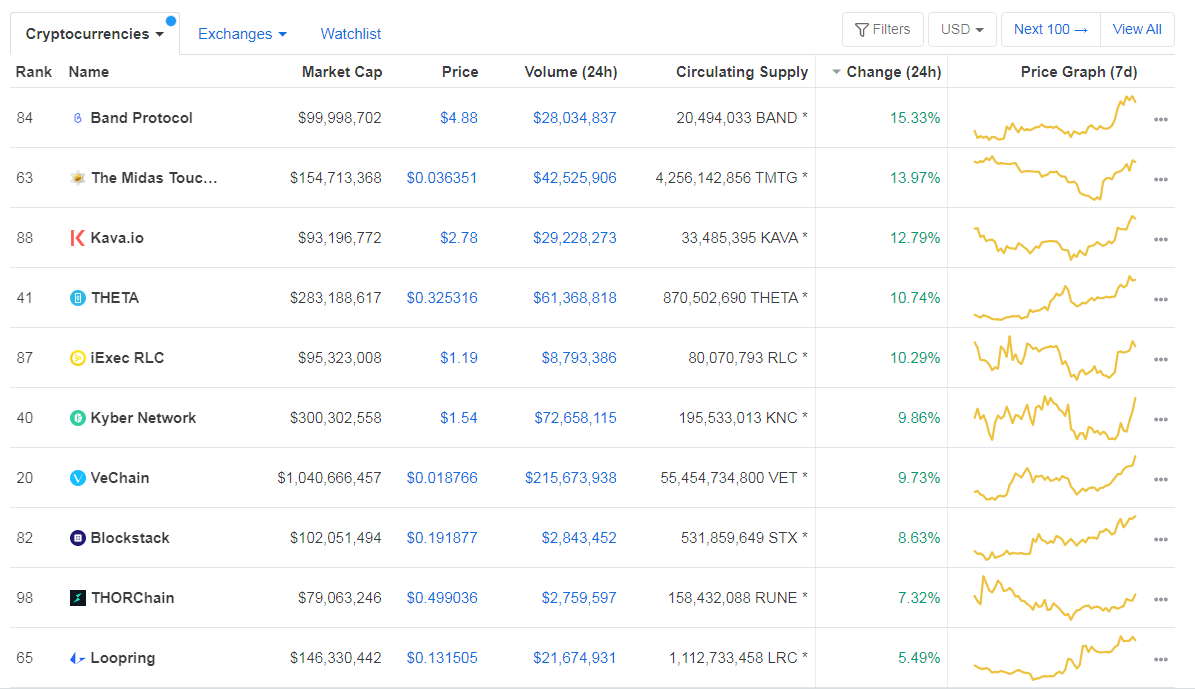
Top 10 24-hour Performers (Click to enlarge)
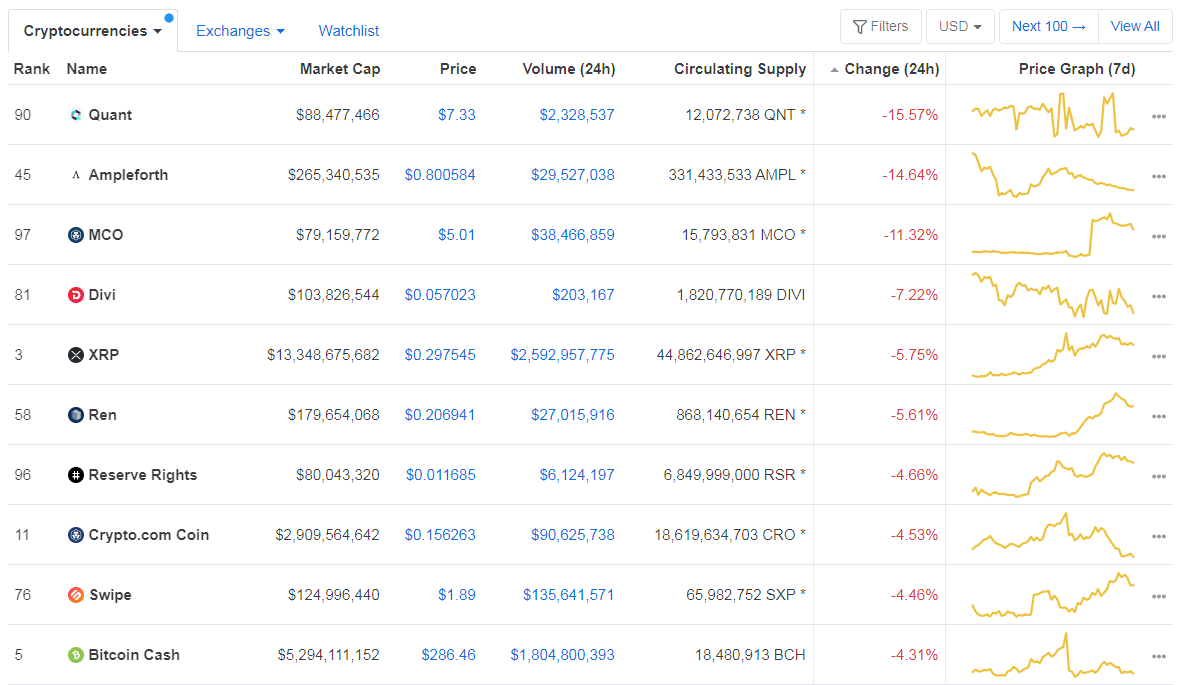
Bottom 10 24-hour Performers (Click to enlarge)
Bitcoin’s dominance level has increased since we last reported, with its value currently at 61.17%. This value represents a 0.37% difference to the upside when compared to yesterday’s value.
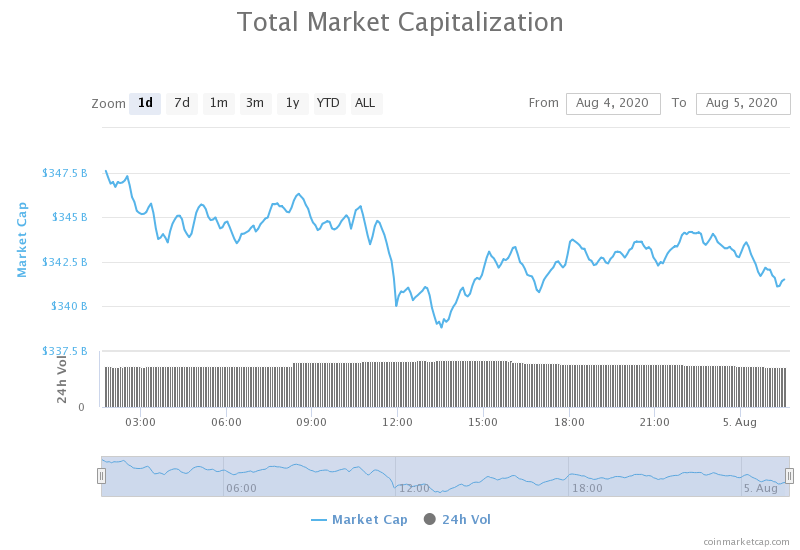
Daily Crypto Market Cap Chart
The cryptocurrency market capitalization has decreased slightly since we last reported. Its current value is $341.39 billion, which represents a decrease of $6.78 billion when compared to the value it had yesterday.
_______________________________________________________________________
What happened in the past 24 hours?
_______________________________________________________________________
- Ethereum 2.0 Testnet Medalla Goes Live With 20,000 Validators (Coindesk)
- US Lawmakers Don’t Want Proof-of-Stake Networks to Get Overtaxed (Coindesk)
- Russian Voters’ Data on Sale After Blockchain Poll to Keep Putin in Power: Report (Coindesk)
- Institutions that want in on DeFi are buying Ethereum first: fund manager (Cryptoslate)
- Ripple Increases XRP Sales by 18x in Q2 After Earlier Cutbacks (Cryptobriefing)
- Square says Cash App generated $875 million in bitcoin revenue during Q2, posting $17 million in gross profit (The Block)
- DEX volumes made up almost 4% of centralized exchange volumes in July — a monthly high (The Block)
- The SEC wants to buy a blockchain forensics tool for monitoring smart contracts (The Block)
- Russia’s Biggest Bank Considers Launching Its Own Stablecoin (Cointelegraph)
- Dash Launches Latin America’s First Ever Crypto Debit Card (Cointelegraph)
_______________________________________________________________________
Technical analysis
_______________________________________________________________________
Bitcoin
The largest cryptocurrency by market cap had a slow day, with its price being locked in a range bound by The $11,460 resistance and $11,090 support. Bitcoin continuously retested its immediate support, but the lack of volume and pressure towards the downside brought nothing to the BTC bears. Bitcoin’s downside is also guarded by the 50-period moving average, which is sitting right under $11,090.
BTC traders should look for an opportunity to make a trade when BTC breaks $11,460 or falls below $11,090.
BTC/USD 4-hour Chart
Technical factors:
- Price is currently above its 50-period EMA, but below its 21-period EMA
- Price is near its middle B.B (20-period SMA)
- RSI is neutral (47.67)
- Volume decreasing
Key levels to the upside Key levels to the downside
1: $11,460 1: $11,090
2: $11,630 2: $10,855
3: $12,000 3: $10,505
Ethereum
Ethereum has a slow day as well, with its volume normalizing and volatility fading. The second-largest cryptocurrency by market capitalization oscillated between $401 and $380 over the course of the day. The cryptocurrency seems like it will be trading within the range bound by $415 and $362 for some time now.
Traders should look for a trade opportunity within the range ETH is currently in.
ETH/USD 4-hour Chart
Technical Factors:
- Price is above its 21-period EMA and its 50-period EMA
- Price is currently at its middle B.B. (20-period SMA)
- RSI is elevated (57.69)
- Descending volume
Key levels to the upside Key levels to the downside
1: $415 1: $362
2: $496 2: $340
3: $302
Ripple
XRP experience a day with a bit more volatility than Bitcoin and Ethereum, with its price dropping down to below $0.3 levels. While the move to the downside seems to be stopped by the 21-period moving average for now, XRP will certainly move somewhere (more likely to the downside. On top of that, XRP has formed a triangle formation, which gives us a possible time estimate of its next move.
Traders can look for an opportunity to trade when XRP breaks the triangle formation.
XRP/USD 4-hour Chart
Technical factors:
- Price above 21-period and the 50-period EMA
- Price is below the middle B.B. (20-period SMA)
- RSI is neutral (54.18)
- Average volume
Key levels to the upside Key levels to the downside
1: $0.32 1: $0.285
2: $0.3328 2: $0.266
3: $0.245
Related posts
 Daily Crypto Review, Sept 21 – Crypto Market is Preparing For a Bearish Move; UNI Token Booming
 Daily Crypto Review, Sept 24 – Bitcoin Following Gold: $9,300 On The Horizon
 Daily Crypto Review, Oct 22 – PayPal to Enable its Users to Buy and Sell Crypto; Bitcoin Skyrockets to $13,000 as a Response
 Daily Crypto Review, Oct 27 – Bitcoin Preparing For a Retracement; XRP Tumbles on the Daily