
The cryptocurrency sector has mostly stayed at the same place over the weekend as Bitcoin was trying to break the psychological $11,000 resistance. Bitcoin is currently trading for $10,935, which represents an increase of 0.28% on the day. Meanwhile, Ethereum lost 1.58% on the day, while XRP lost 1.27%.

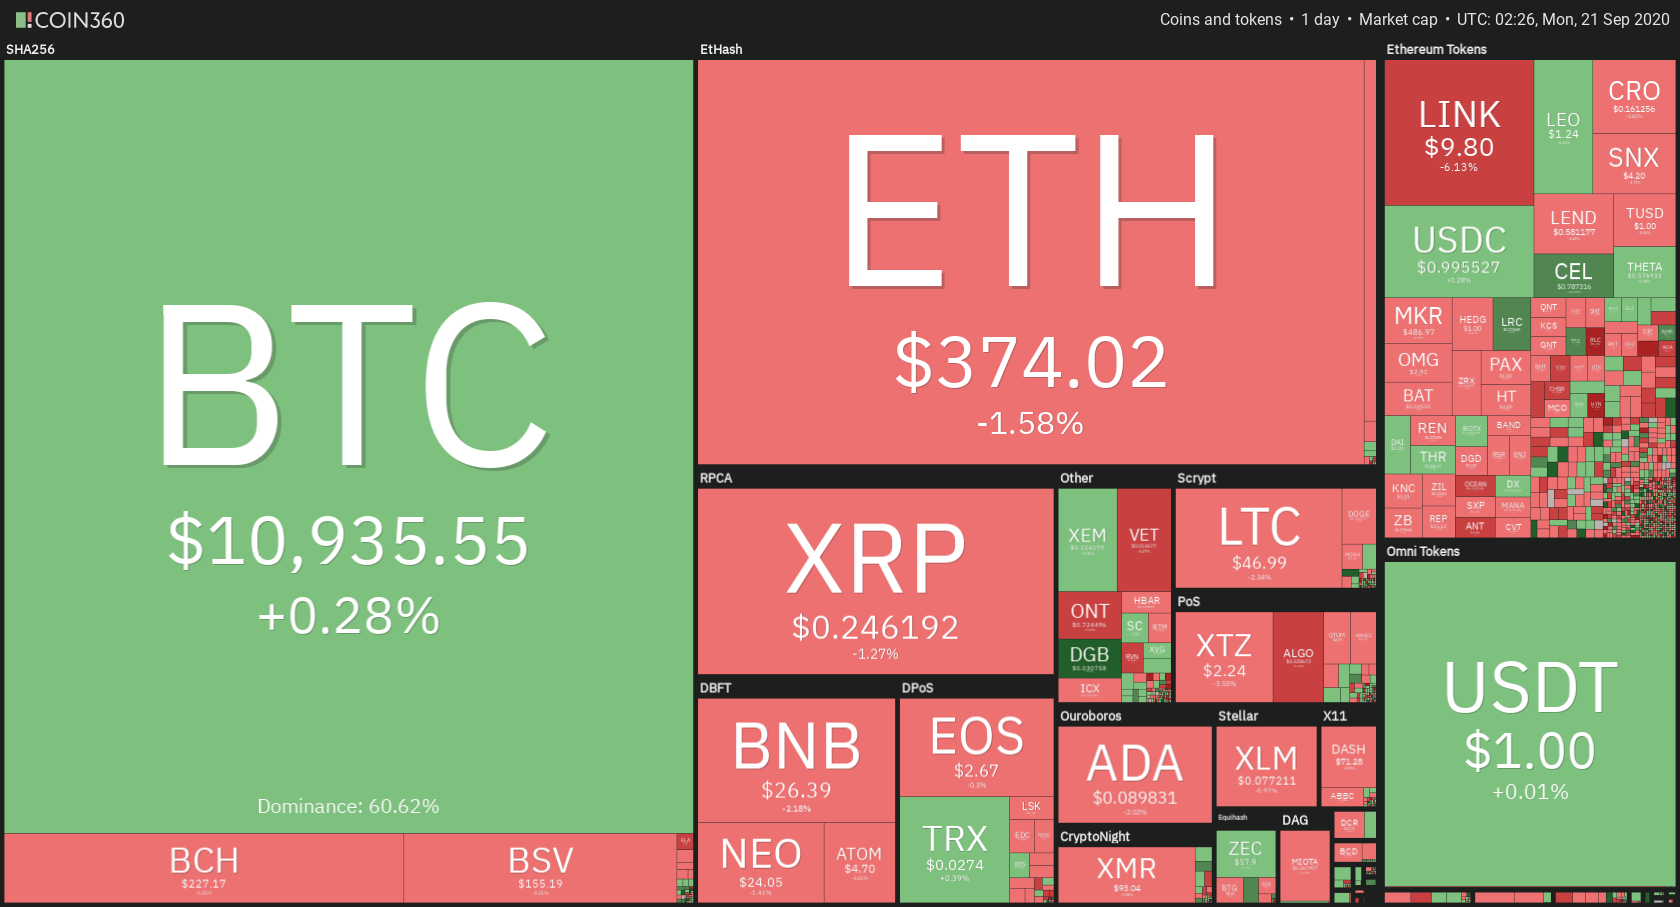
Daily Crypto Sector Heat Map
If we look at the top100 cryptocurrencies, Celo gained an astonishing 45.37% on the day, making it the most prominent daily gainer. ZB Token (33.20%) and DigiByte (15.24%) also did great. On the other hand, HedgeTrade lost 13.52%, making it the most prominent daily loser. It is followed by Flexacoin’s loss of 12.67% and yearn.finance’s loss of 9.63%.
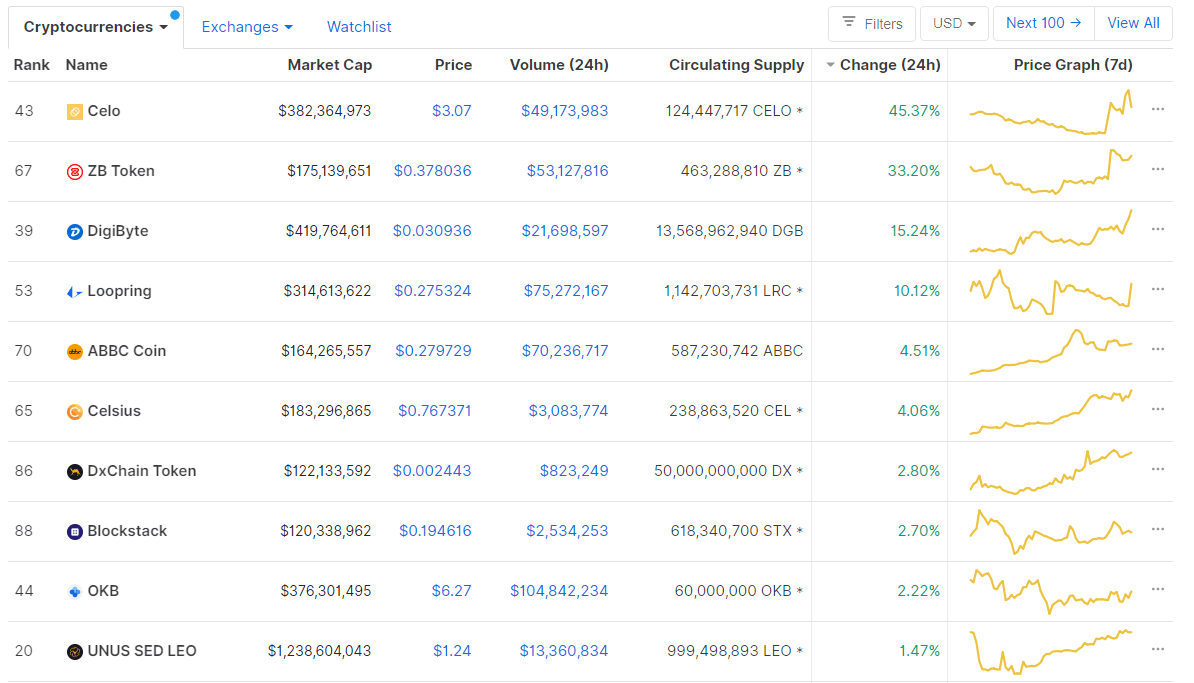
Top 10 24-hour Performers (Click to enlarge)
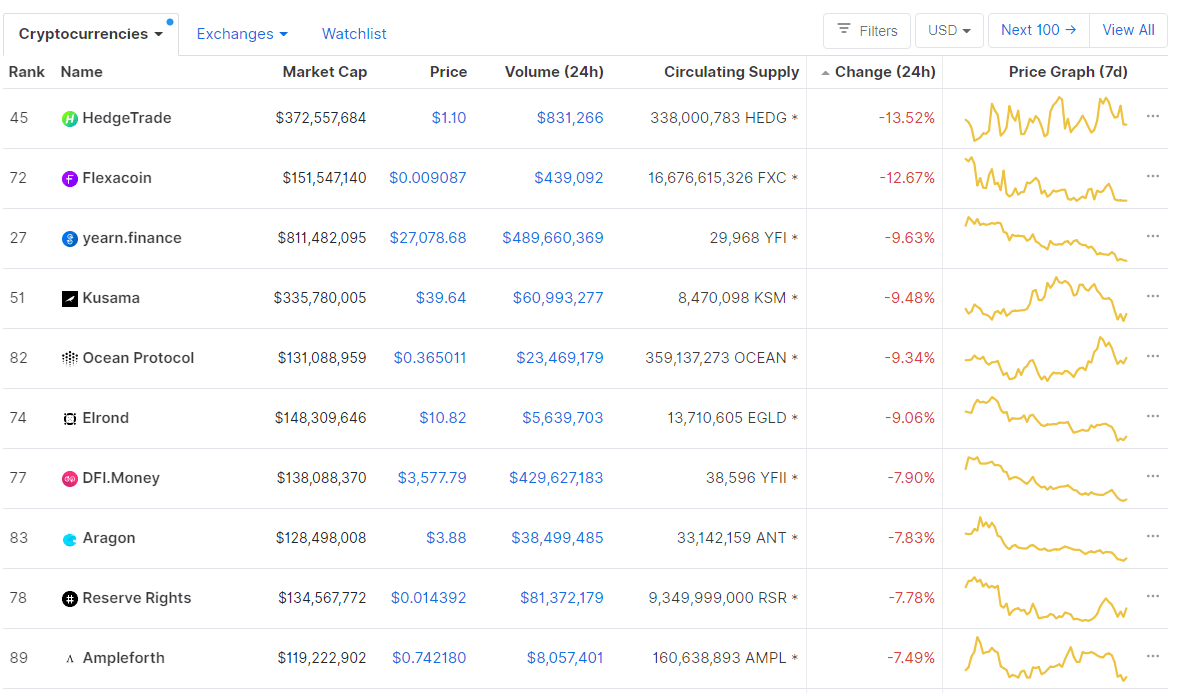
Bottom 10 24-hour Performers (Click to enlarge)
Bitcoin’s dominance level experienced a slight increase since our last report, with its value currently being at 60.62%. This value represents a 0.48% difference to the upside when compared to when we last reported.
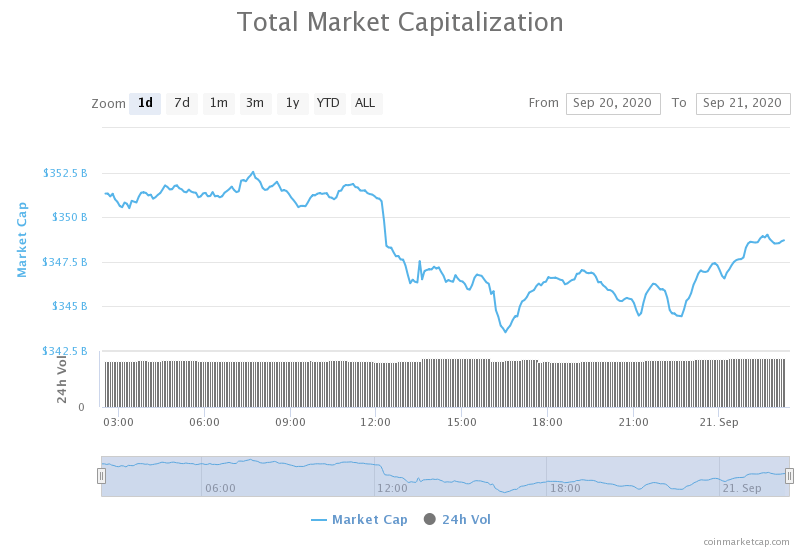
Daily Crypto Market Cap Chart
The crypto sector capitalization stayed at virtually the same place over the weekend. Its current value is $351.13 billion, which represents a decrease of $3.37 billion when compared to our previous report.
_______________________________________________________________________
What happened in the past 24 hours?
_______________________________________________________________________
- DEXs rake in the retail volume while institutions stay on the sidelines (The Block)
- New EU crypto assets rules to be released by 2024: report (The Block)
- Over 140,000 addresses have claimed their 400 UNI token airdrops (The Block)
- Crypto exchange bitFlyer Europe links up with PayPal, enabling account deposits with euros (The Block)
- DeFi’s Obsession With “Fair Launches” Is Killing Innovation (Cryptobriefing)
- $165 Million Bitcoin Moved to Ethereum after Uniswap’s UNI Token Launch (Cryptobriefing)
- ETH 2.0 Won’t Fix Ethereum’s Scalability Problems, Analyst Argues (Cryptobriefing)
- Here’s how Uniswap’s (UNI) 600% rally could trigger another DeFi boom (Cryptoslate)
- Even after parabolic rally, top crypto VC thinks Ethereum DeFi isn’t overvalued (Cryptoslate)
- Profit taking Bitcoin miners won’t stop the next bull run: On-chain analyst (Cointelegraph)
_______________________________________________________________________
Technical analysis
_______________________________________________________________________
Bitcoin
Bitcoin has spent the weekend trying to get past the psychological resistance of $11,000, but failed to do so. The daily chart shows a possible resistance level at the 61.8% Fib retracement from the Head and Shoulders pattern. If that happens, we may expect lows of $9,300 to $9,500.
BTC/USD 4-hour Chart
If we take a look at the 4-hour time frame, Bitcoin fell under the pink ascending line, which is now acting as resistance. However, this resistance is not as strong and may be surpassed with ease. Bitcoin is still struggling and trading within the range bound by $11,000 and $10,850 to the upside and downside, respectively.
BTC/USD 4-hour Chart
Bitcoin’s short-term technicals are showing bullish sentiment, while its mid-term technicals are slightly more bearish. While Bitcoin shows the most bullish sentiment out of the top three cryptocurrencies, we can expect a rebound from the current highs as BTC is unable to gain any meaningful bull push.
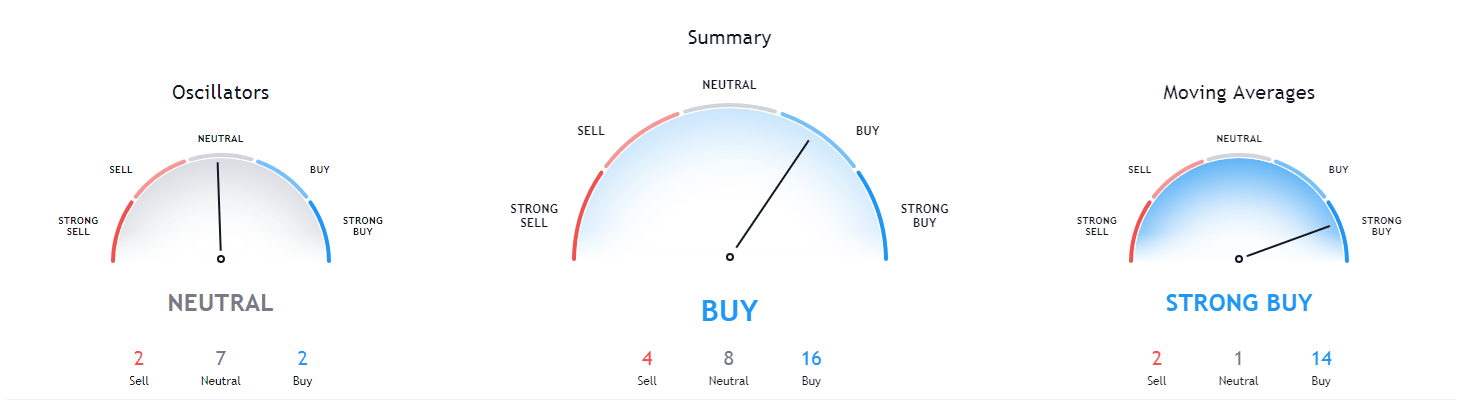
BTC/USD 4-hour Technicals
Technical factors (4-hour Chart):
- Price is above its 50-period EMA and just slightly above its 21-period EMA
- Price is at its middle Bollinger band
- RSI is flat but overextended to the upside (53.96)
- Volume is slowly descending
Key levels to the upside Key levels to the downside
1: $11,000 1: $10,850
2: $11,090 2: $10,630
3: $11,460 3: $10,500
Ethereum
Ethereum’s price has been squeezed out of its current levels over the weekend, pushing it below the yellow bottom support (now resistance) line. However, the bears didn’t do much either, with ETH’s price descent ending after failing to break $371 to the downside. If this level breaks, we can expect a push towards the $360 support level.
ETH/USD 4-hour Chart
Ethereum’s technicals have turned towards the bear side as the price went down. While the DeFi surge should be taken into account, Ethereum looks like it will push towards the downside in the short-term.
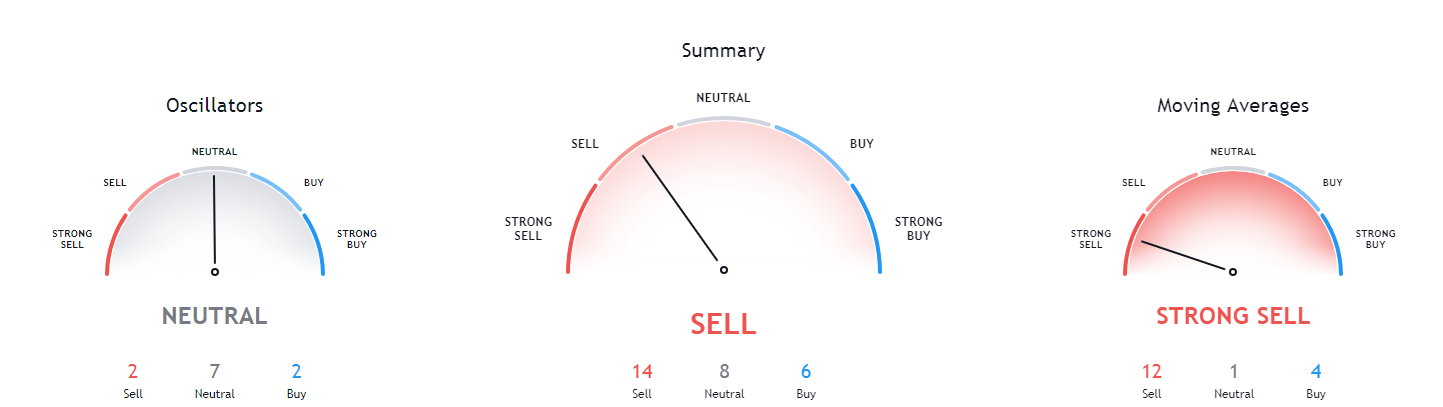
ETH/USD 4-hour Technicals
Technical Factors (4-hour Chart):
- The price is below both its 21-period and its 50-period EMA
- The price below its middle Bollinger band
- RSI neutral and stabilizing (45.44)
- Volume is average (two-candle spike during the downswing)
Key levels to the upside Key levels to the downside
1: $400 1: $371
2: $415 2: $360
3: $445 3: $340
Ripple
When taking a look at the 1-day chart, XRP has continued its Elliot Wave impulse pattern, nearly ending the fourth part of the wave. It is expected for XRP to push towards the downside (most likely towards $0.21) as a final leg of the impulse wave.
XRP/USD 1-day Chart
XRP spent its weekend in a slow push towards the upside as a continuation of its 4th leg of the impulse wave. With that being seemingly done, we can expect more bears to enter the market quite soon. This prediction is also confirmed by XRP finding much resistance at its 21-period and 50-period moving averages.
Taking a look at its technicals, XRP is (just as Ethereum) tilted towards the sell-side. Unlike Ethereum, however, XRP is showing even more bearish sentiment on longer time frames.
XRP/USD 4-hour Chart
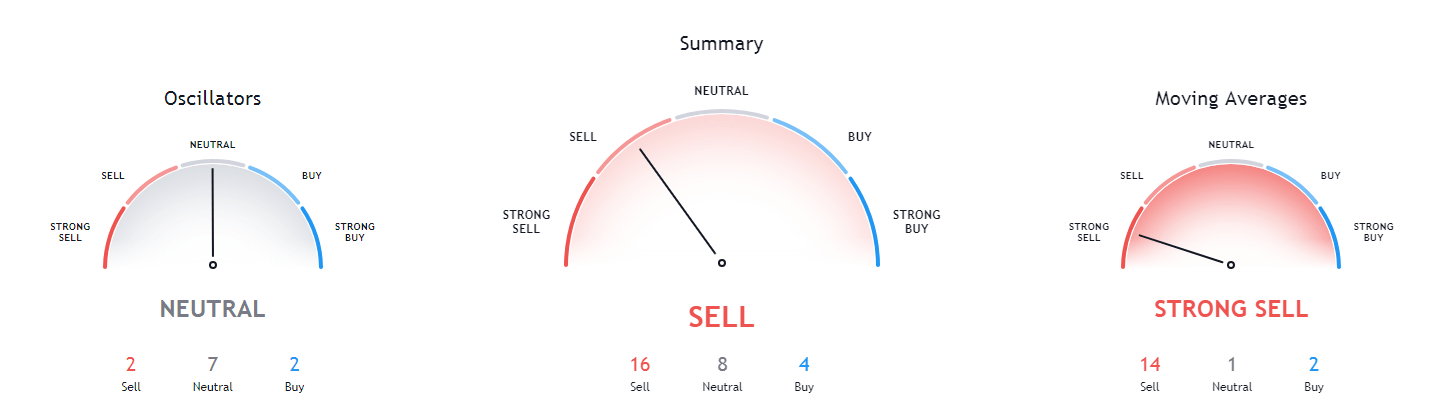
XRP/USD 4-hour Technicals
Technical factors (4-hour Chart):
- The price is below both its 21-period EMA and its 50-period EMA
- Price is slightly below its middle Bollinger band
- RSI is neutral and stabilizing (43.93)
- Volume is average (low)
Key levels to the upside Key levels to the downside
1: $0.266 1: $0.2454
2: $0.285 2: $0.235
3: $0.31 3: $0.227
Related posts
 Daily Crypto Review, Feb 24 – New Jersey regulating crypto?
 Daily Crypto Review, Feb 28 – CFTC approaching stablecoin projects; Crypto market preparing for a move
 Daily Crypto Review, Mar 5 – Bitcoin uncertainty leading to a lack of buying or selling pressure
 Daily Crypto Review, Oct 19 – Stablecoin Market Surpasses $20 Billion; Tether Dominating With Market Cap of Almost $16 Billion
One reply on “Daily Crypto Review, Sept 21 – Crypto Market is Preparing For a Bearish Move; UNI Token Booming”
sliding hard today