
The cryptocurrency sector has spent the weekend pushing towards higher highs but ultimately being stopped out at the most recent highs. Bitcoin is currently trading for $11,471, representing an increase of 0.71% on the day. Meanwhile, Ethereum gained 1.63% on the day, while XRP gained 0.35%.

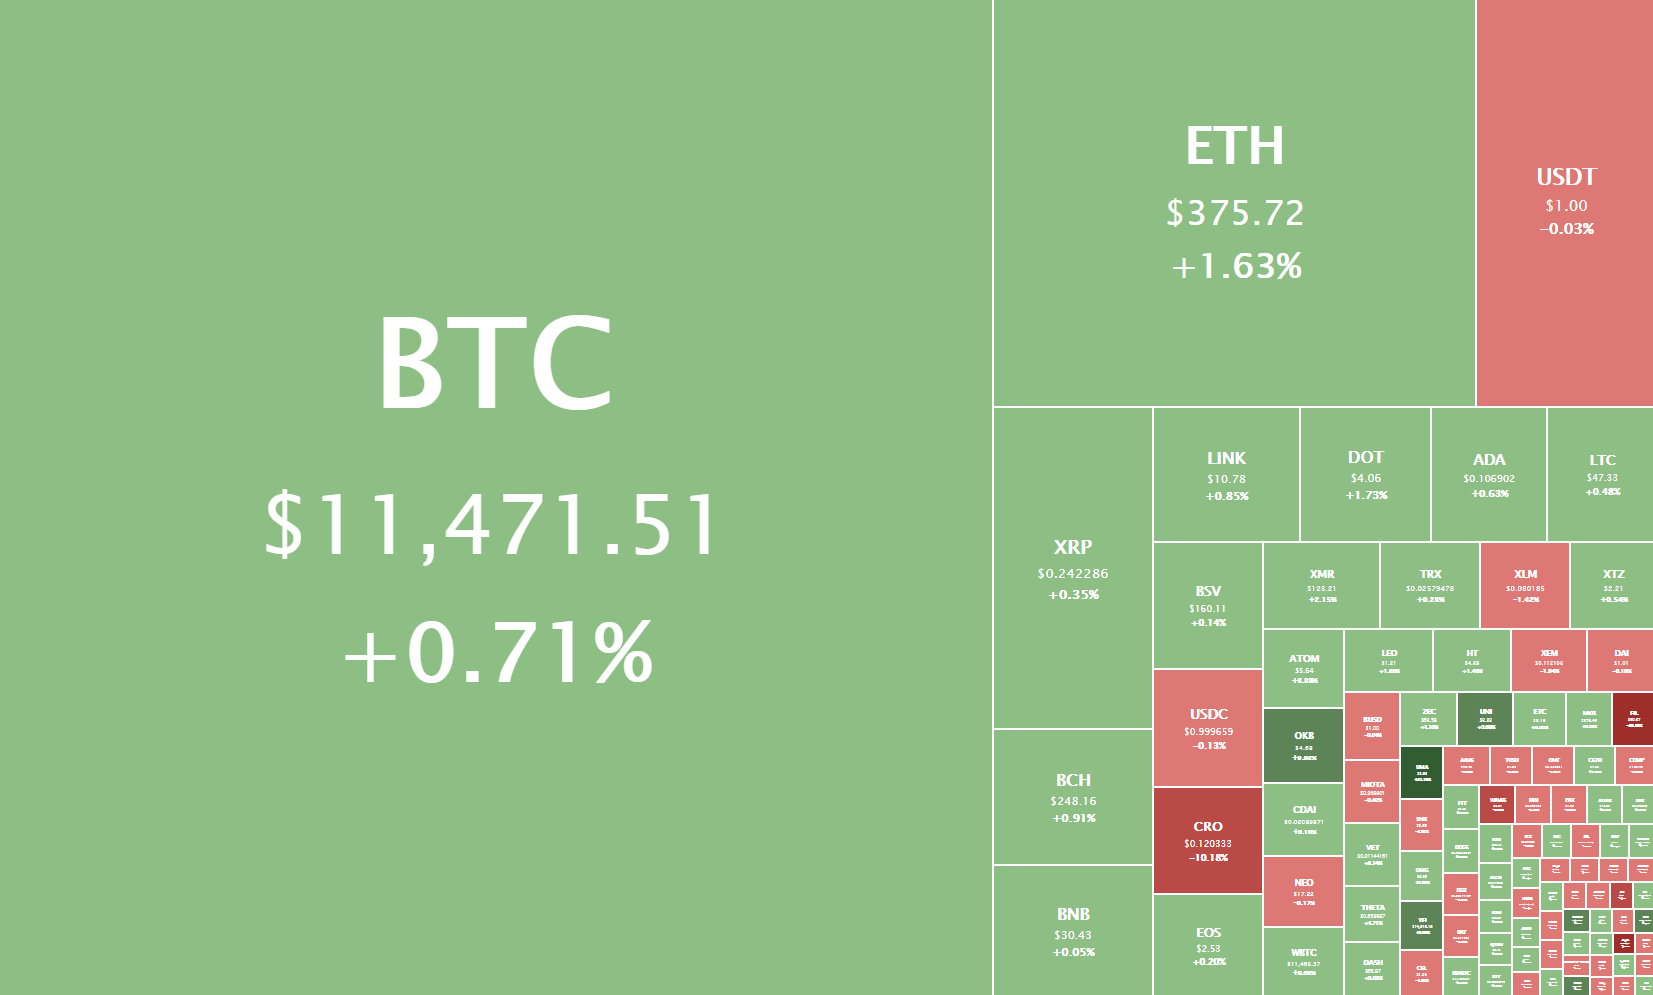
Daily Crypto Sector Heat Map
If we look at the top 100 cryptocurrencies, we can see that UMA gained 24.3% in the past 24 hours, making it the top daily gainer. Aave (19.42%) and Reserve Rights (14.8%) also did great. On the other hand, Filecoin lost 23.88%, making it the most prominent daily loser. It is followed by Crypto.com Coin’s loss of 8.92% and Waves’ loss of 4.28%.
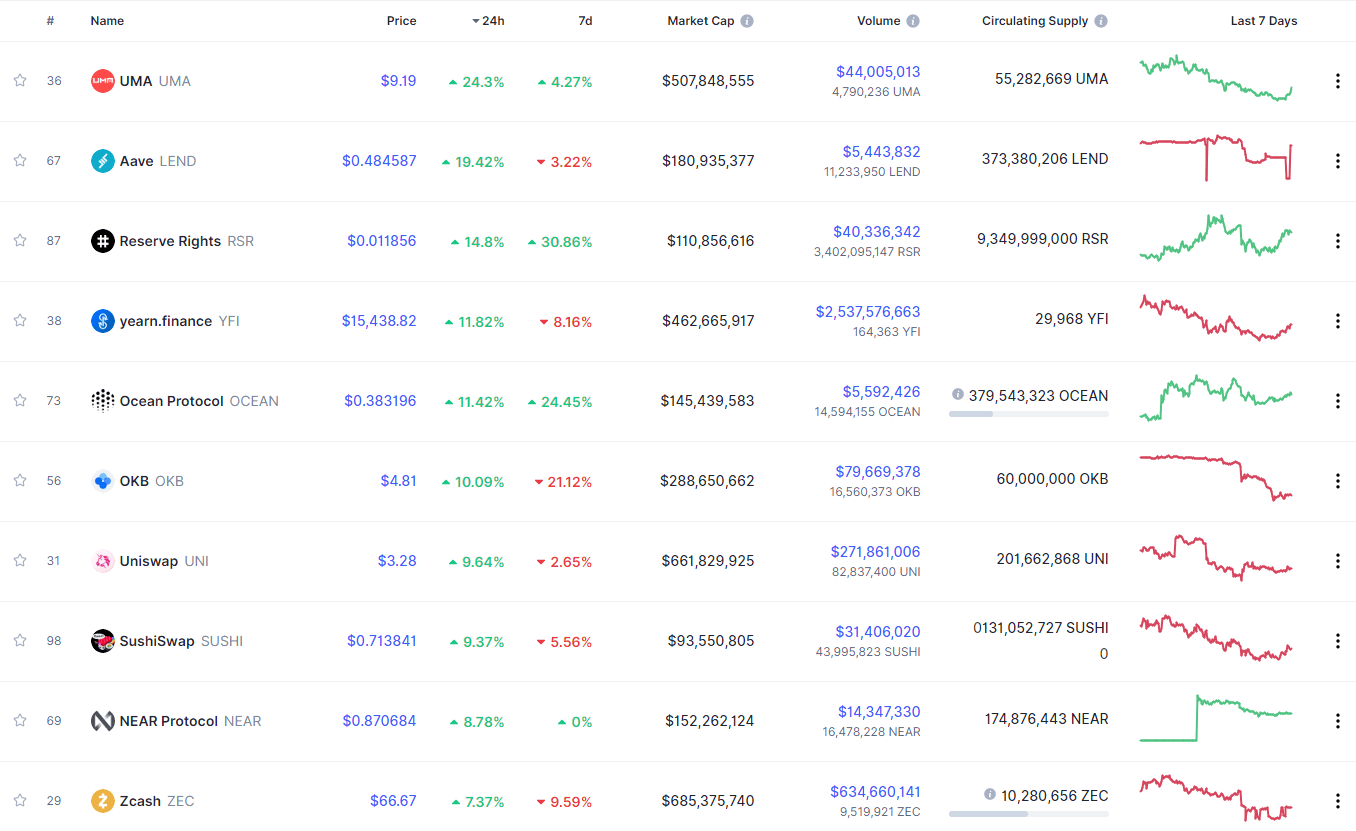
Top 10 24-hour Performers (Click to enlarge)
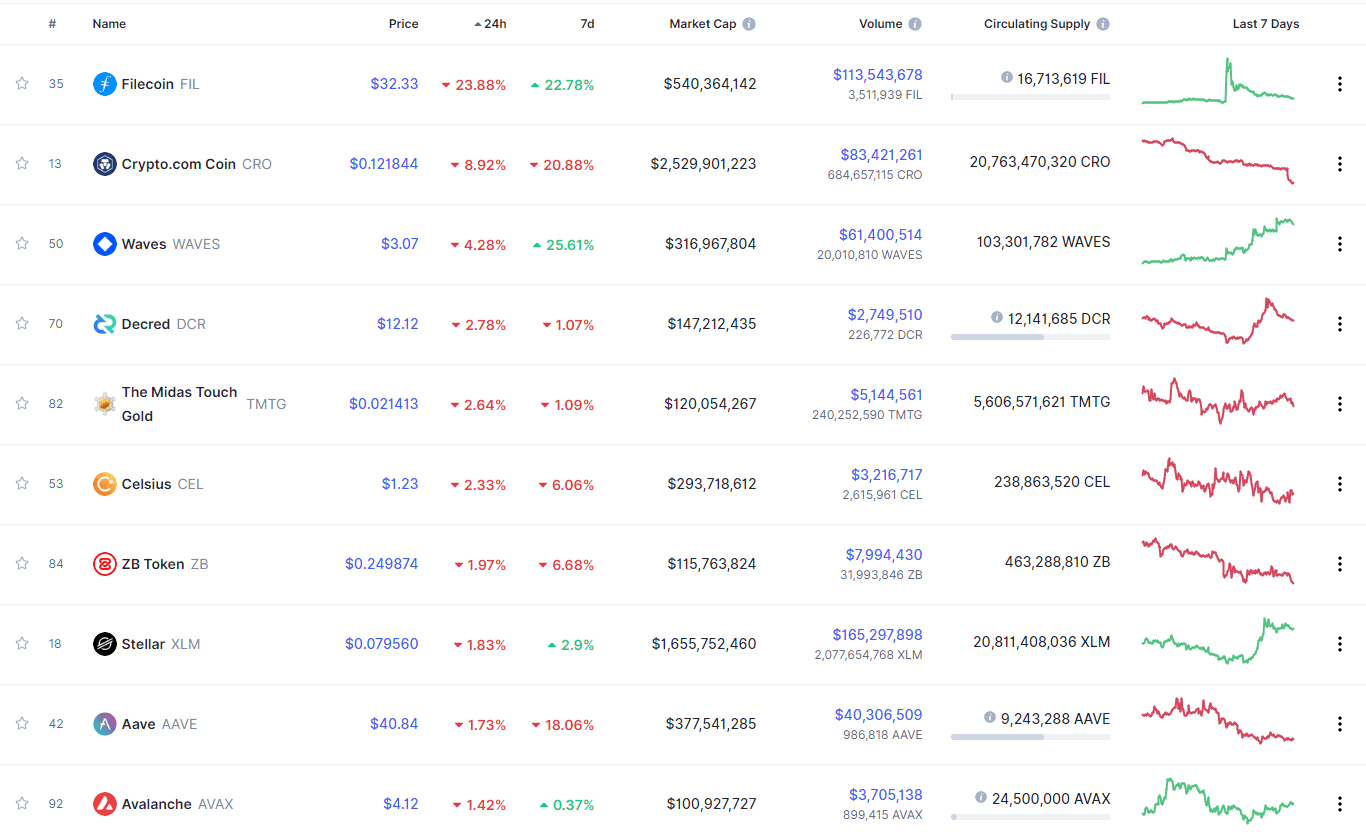
Bottom 10 24-hour Performers (Click to enlarge)
Bitcoin’s market dominance level has increased slightly since our last report, with its value is currently 58.9%. This value represents a 0.2% difference to the upside when compared to when we last reported.
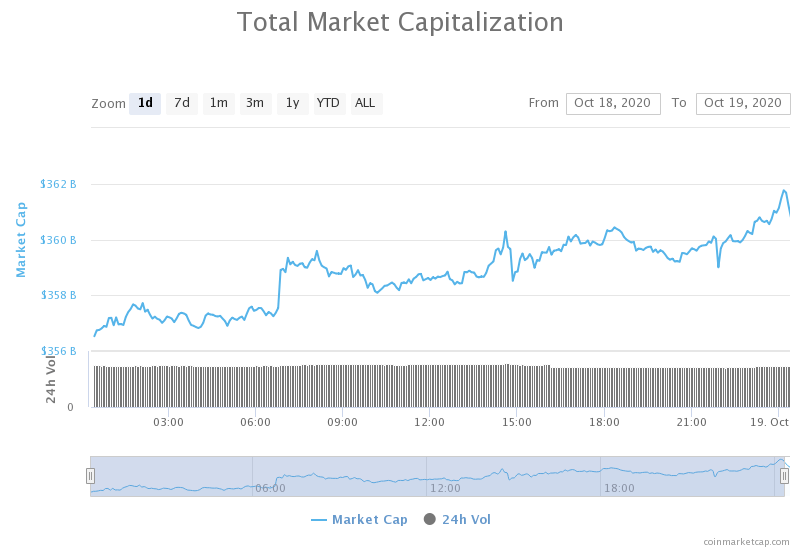
Daily Crypto Market Cap Chart
The crypto sector capitalization has lost a bit of its value since Friday. Its current value is $361.12 billion, representing a decrease of $1.44 billion compared to our previous report.
_______________________________________________________________________
What happened in the past 24 hours?
_______________________________________________________________________
- Stablecoin supply has surged past $20 billion, driven by the derivatives market (The Block)
- New data show how dominant Tether has become as a trading pair on crypto exchanges (The Block)
- Nearly $900 million in VC went to crypto companies in the third quarter of 2020 (The Block)
- Data firm: OKEx saw $113m in Bitcoin outflows just before suspending withdraws (Cryptoslate)
- Why Filecoin’s hyped token launch was a multimillion “failure” (Cryptoslate)
- Monero Scales Up 10% With Latest Upgrade (Cryptobriefing)
- Bitcoin Takes One Step Closer to becoming More Scalable and Private Future (Cryptobriefing)
- NuCypher Launches Mainnet, Distributes $45M in Tokens to Nodes (Cryptobriefing)
- Institutions Take Record Bullish Bets in Bitcoin Futures, Shrugging Off Exchange Missteps (Coindesk)
- With job listing, Canada’s central bank takes additional steps towards a CBDC (Cointelegraph)
_______________________________________________________________________
Technical analysis
_______________________________________________________________________
Bitcoin
The largest cryptocurrency by market capitalization has spent its weekend building up a bull presence and trying to push towards (and past) the $11,500 resistance level. However, the move failed, and Bitcoin is now trading just under the resistance line. With that being said, the volume that followed this move was incredibly low, which implies that a bigger move is ahead, and that traders should pay attention to what happens with the volume in the near future.
Bitcoin will most likely either go up or stay above $11,300, as many analysts say that Bitcoin is done with its sub-$11,000 area. However, we do have to pay attention to the Bitcoin CME Futures Gap.
BTC/USD 1-day Chart
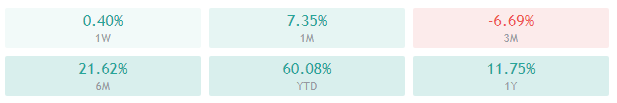
Bitcoin’s technical overview is tilted towards the buy-side on every single time-frame. While its 4-hour and 1-day time-frames are showing neutral bullishness, its weekly and monthly sentiment is extremely positive.
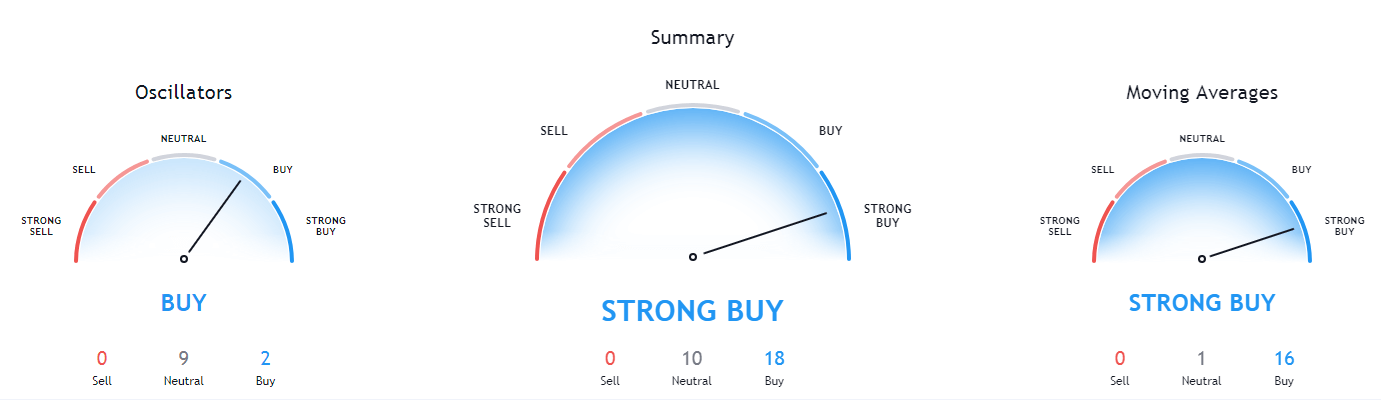
BTC/USD 1-day Technicals
Technical factors (4-hour Chart):
- Price is above its 50-period EMA and at its 21-period EMA
- Price near its top Bollinger band
- RSI is neutral (57.29)
- Volume is below average and descending
Key levels to the upside Key levels to the downside
1: $11,500 1: $11,300
2: $11,630 2: $11,180
3: $12,000 3: $11,000
Ethereum
Ethereum’s price movement throughout the weekend looked a lot like Bitcoin’s, but with a twist. The second-largest cryptocurrency by market cap moved towards the downside and (just like Bitcoin) created three lower highs on the way down. However, unlike Bitcoin, Ethereum has broken the downtrend and shot up in recent hours, though only to be stopped by the $378 resistance level. While there is still a chance for Ethereum to break this level, it will most likely be stuck below it (possibly within a range bound by $371 and $378) in the short-term.
ETH/USD 4-hour Chart
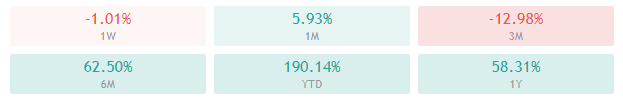
Ethereum’s technicals are showing a tilt towards the buy-side on all time-frames, with lower time-frames being more positive, while longer time-frames being more tilted towards the neutral stance (mostly oscillators).
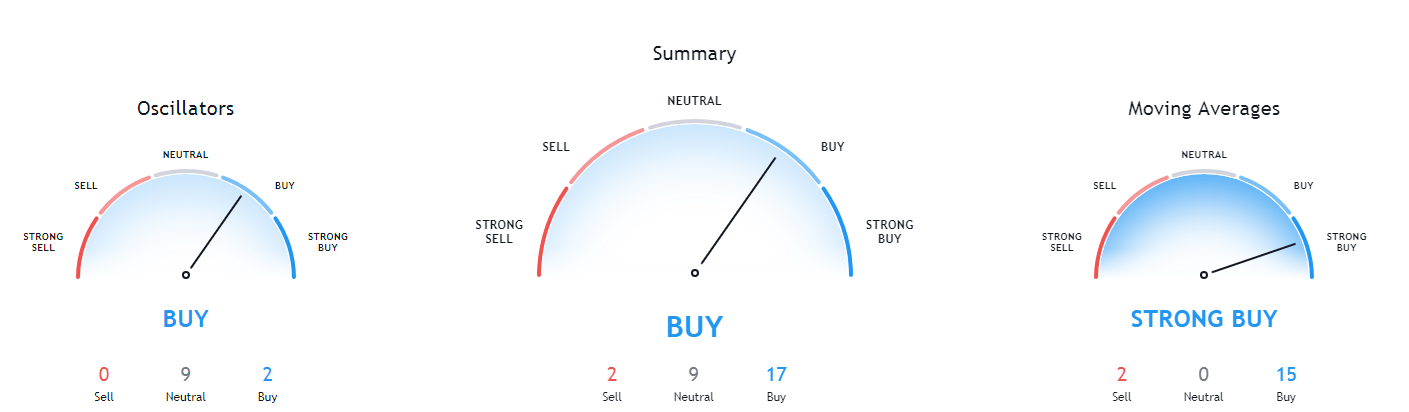
ETH/USD 1-day Technicals
Technical Factors (4-hour Chart):
- The price is above its 50-period and its 21-period EMA
- The price at its middle Bollinger band
- RSI is neutral (54.55)
- Volume is descending
Key levels to the upside Key levels to the downside
1: $378 1: $371
2: $400 2: $360
3: $415 3: $334
Ripple
XRP spent the weekend mostly trading sideways or rising a little after a whole week of price drops. The fourth-largest cryptocurrency by market capitalization fell under the $0.2454 and stayed below it over the weekend, and even though it is moving towards it, the current volume would not support a break of such a major resistance level.
Many analysts are calling for even more downward movement from XRP, justifying it by saying that this is a continuation of a trend dating back from 2018. The reduced volatility and range-bound trading seem to be confirming this thesis.
XRP/USD 4-hour Chart
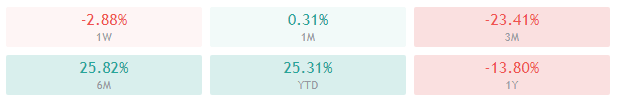
XRP’s technicals are extremely bearish. Its 4-hour and daily sentiment being tilted towards the sell-side fully, while its weekly and monthly overviews are showing some signs of neutrality, though they are also heavily bearish.
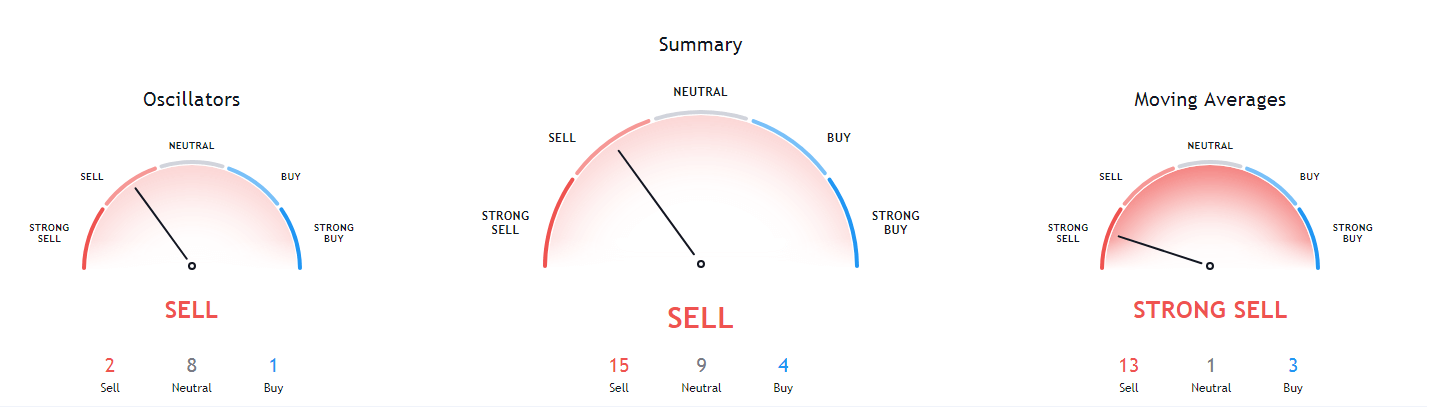
XRP/USD 1-day Technicals
Technical factors (4-hour Chart):
- The price is below both its 50-period EMA and its 21-period EMA
- Price is at its middle Bollinger band
- RSI is neutral (42.17)
- Volume is below average
Key levels to the upside Key levels to the downside
1: $0.2454 1: $0.235
2: $0.26 2: $0.227
3: $0.266 3: $0.221
Related posts
 Daily Crypto Review, Oct 14 – Analysts Calling for a Bull Market; Bitcoin Back Under $11,500
 Daily Crypto Review, Oct 21 – Bitcoin Above $12,000; Bull Market in Full Swing
 Daily Crypto Review, Oct 23 – PayPal Enabling Crypto Not as Good as it Sounds; Ethereum Pushes Towards $420
 Daily Crypto Review, Oct 29 – Bitcoin Back At $13,000: What’s Next? Trading Ideas and Market Overview