
The cryptocurrency sector was mostly consolidating after Bitcoin’s surge, with almost every single cryptocurrency in the top100 ending up in the green. Bitcoin is currently trading for $12,961, representing an increase of 1.21% on the day. Meanwhile, Ethereum gained 5.64% on the day, while XRP gained 2.34%.

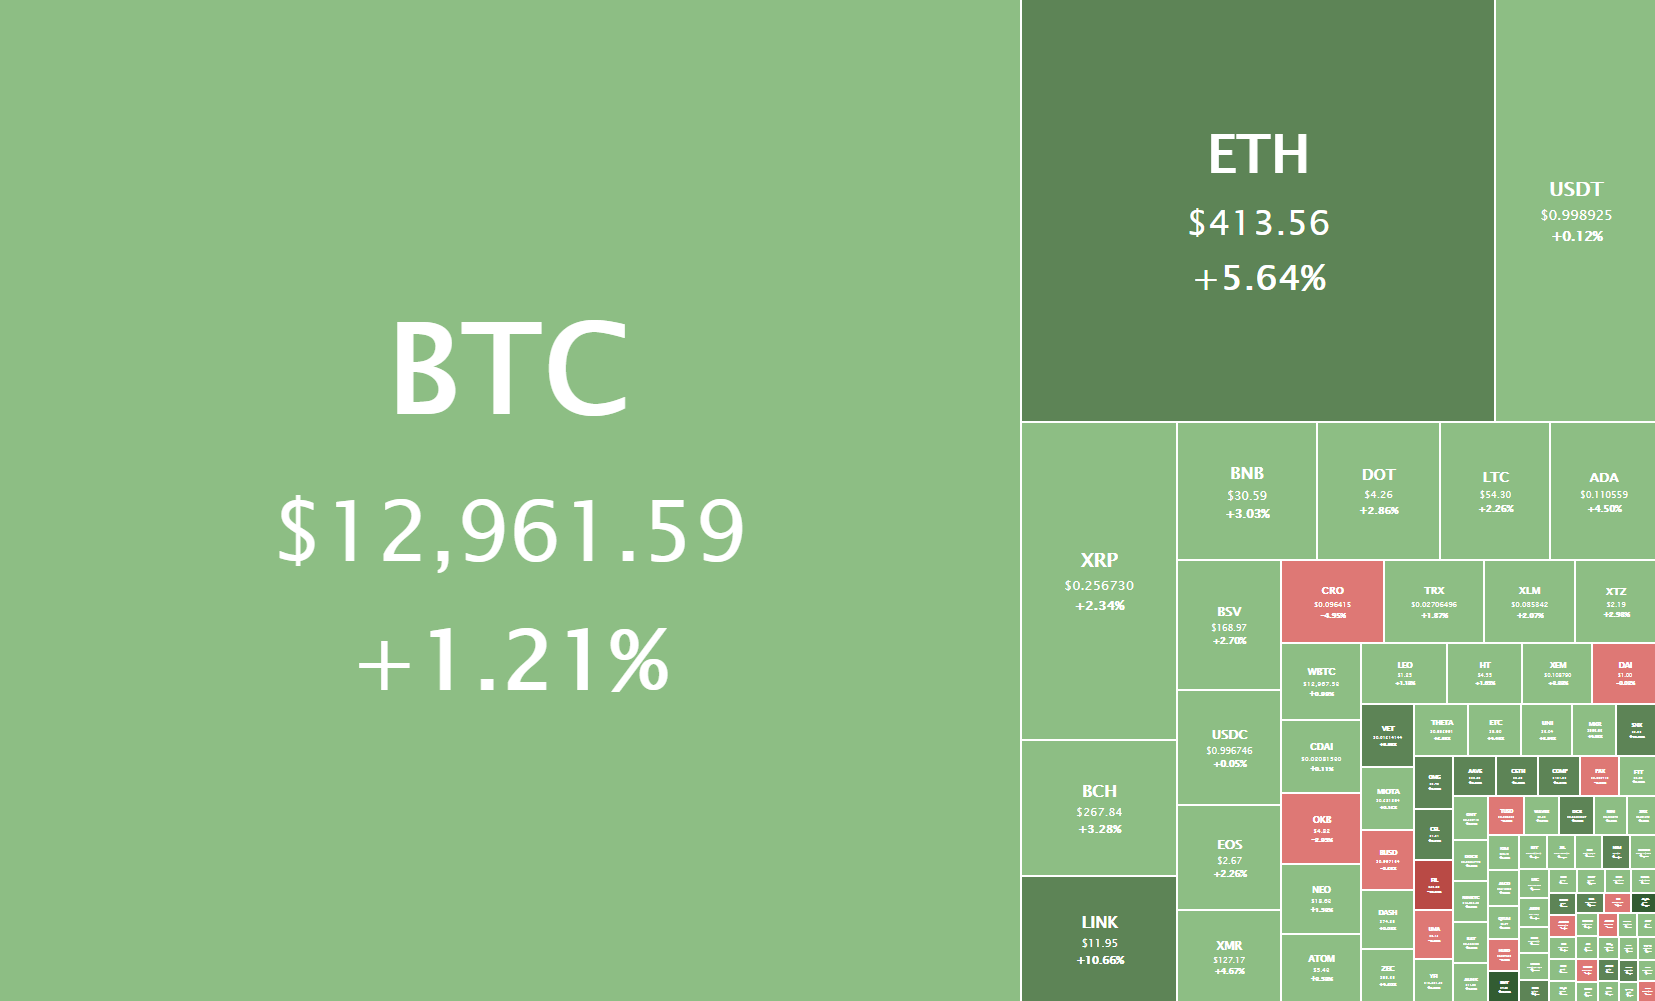
Daily Crypto Sector Heat Map
If we check out the top 100 cryptocurrencies, Ampleforth gained 19.04% in the past 24 hours, making it the crypto to gain the most in a day. Energy Web Token (17.44%) and Reserve Rights (12.20%) also did great. On the other hand, Filecoin lost 13.57%, making it the most prominent daily loser. It is followed by HedgeTrade’s loss of 8.57% and ABBC Coin’s loss of 8.49%.
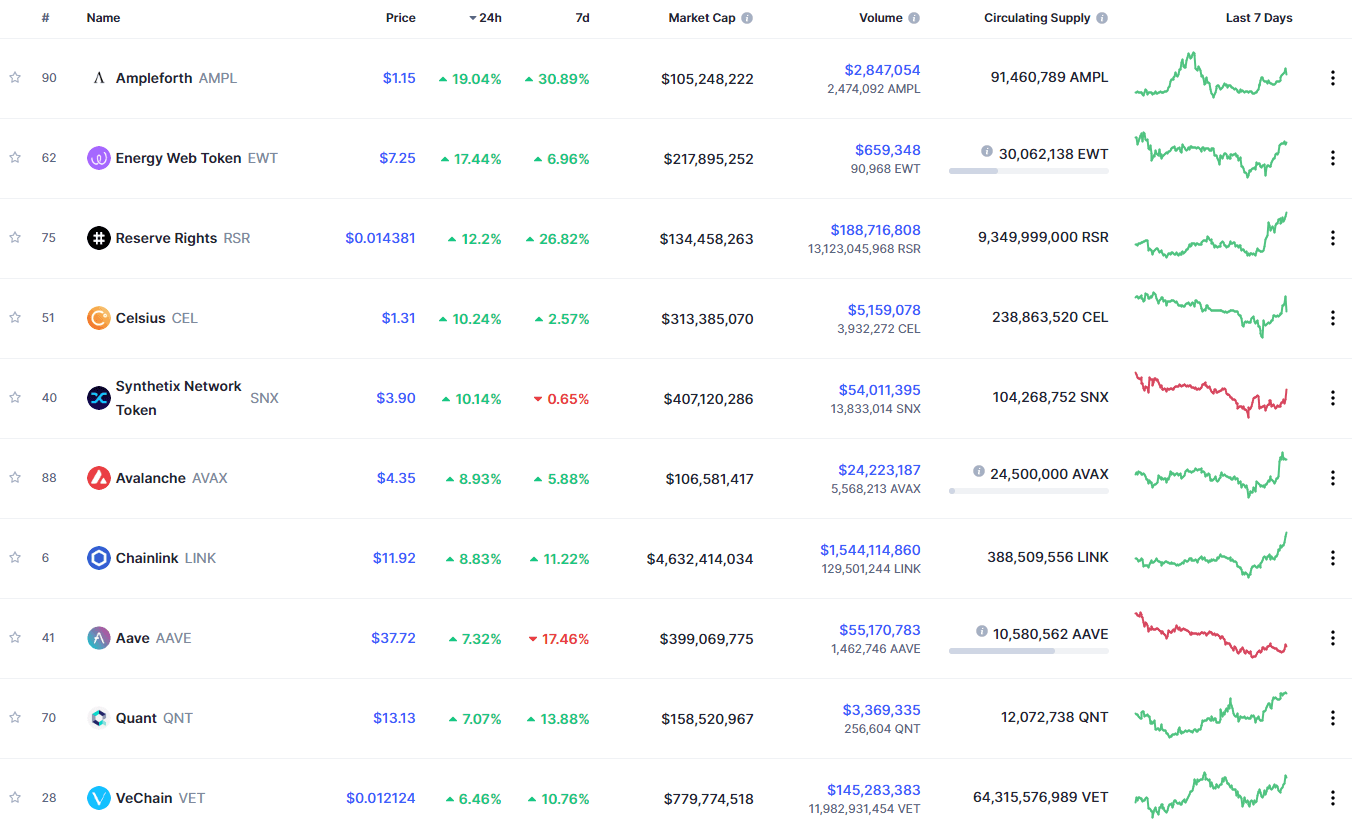
Top 10 24-hour Performers (Click to enlarge)
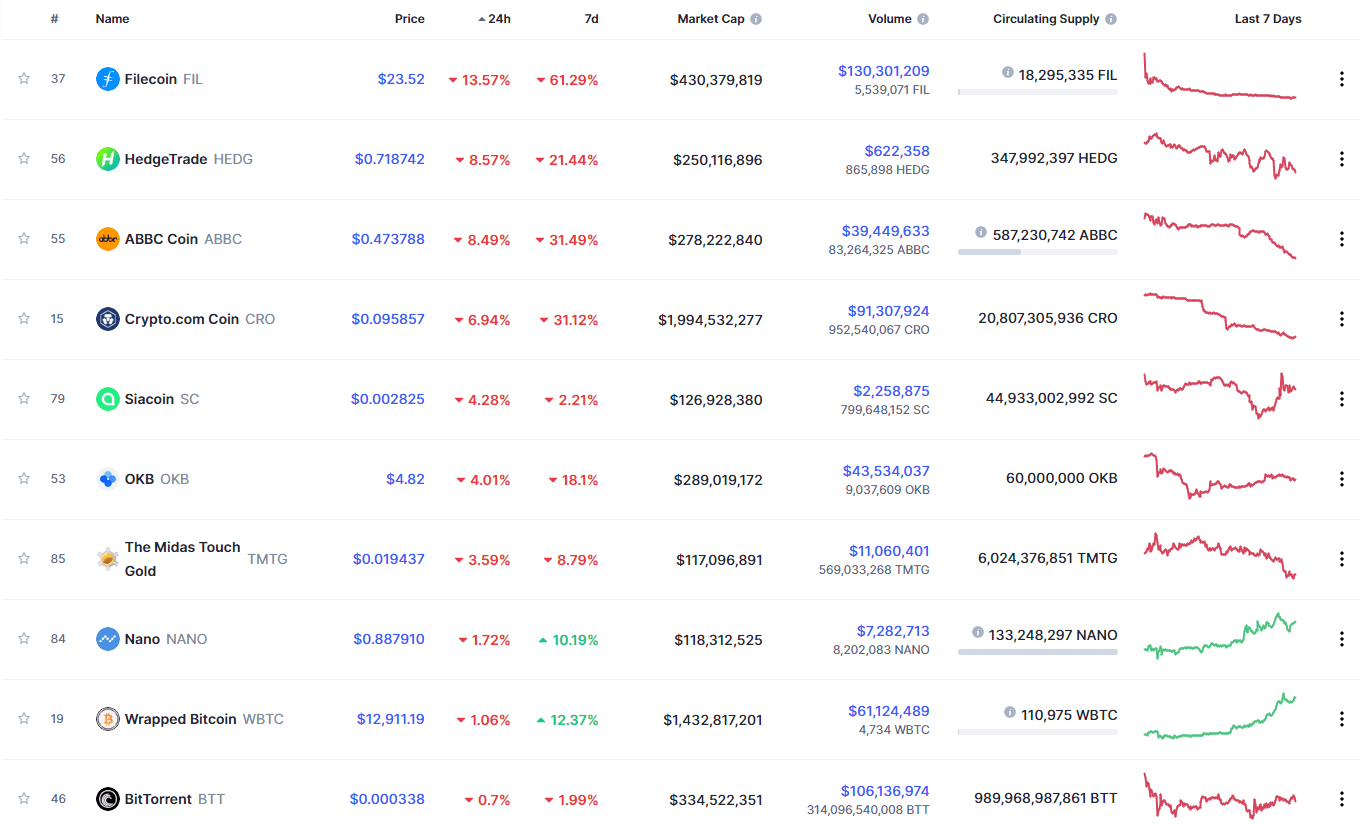
Bottom 10 24-hour Performers (Click to enlarge)
Bitcoin’s market dominance level had decreased slightly since when we last reported, with its value is currently 60.8%. This value represents a 0.4% difference to the downside when compared to when we last reported.
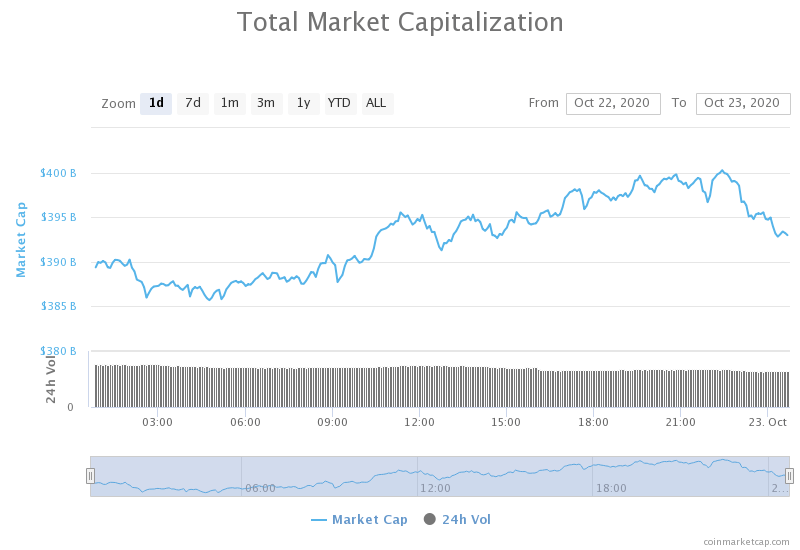
Daily Crypto Market Cap Chart
The crypto sector capitalization has experienced an increase since we last reported. Its current value is $394.96 billion, representing an increase of $4.72 billion compared to our previous report.
_______________________________________________________________________
What happened in the past 24 hours?
_______________________________________________________________________
- Bitcoin’s market run-up sends options to an all-time high for open interest (The Block)
- Crypto firms have granted millions to Bitcoin developers in recent months. Here’s why (The Block)
- Filecoin miners will now receive 25% of block rewards immediately with no vesting period (The Block)
- Waves announces ERC20 interoperability with Ethereum network (Cryptoslate)
- Bitcoin Pullback on Horizon as Key Indicator Flashes Overbought (Cryptobriefing)
- Following 60% Retracement, VeChain Screams Buy as Technicals Turn Bullish (Cryptobriefing)
- PayPal Rumored to Buy BitGo Days After Launching Bitcoin Services (Cryptobriefing)
- Hedge Fund Billionaire Tudor Jones Says Bitcoin Rally Only in ‘First Inning’: Report (Coindesk)
- Top traders say that BTC log chart points to a 2017-style Bitcoin bull run (Cointelegraph)
- Not everyone in the crypto sector is thrilled about PayPal’s recent news (Cointelegraph)
While most of the market rejoices Bitcoin’s surge, confirmation of a bull market, and PayPal enabling its users to buy, sell and hold crypto, not everyone is equally happy. Some analysts have pointed out that PayPal will almost certainly bring adoption, but perhaps at a steep price. If the payment processor giant doesn’t get involved in the community and refuses to give private keys to its users, the benefits may not outweigh the setbacks.
With that being said, additional adoption and introduction of Bitcoin to the wider masses is certainly a positive thing.
_______________________________________________________________________
Technical analysis
_______________________________________________________________________
Bitcoin
The largest cryptocurrency by market capitalization stayed strong after yesterday’s push and even gained some more value. The price pushed past $13,000 once again but couldn’t hold the level, which prompted a pullback towards the sub-$13,000 level. However, the $12,870 level has turned to a support level (though it still needs proper confirmation), which is certainly positive.
At the moment, traders should look Bitcoin’s pullback and trade-off of that. However, if Bitcoin manages to push past $13,000 with confidence, traders shouldn’t wait much but rather join in quickly.
BTC/USD 4-hour Chart
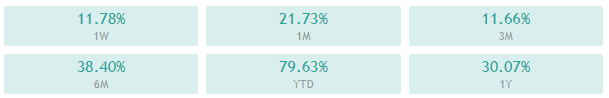
Bitcoin’s technical overview has a strong bullish sentiment on longer time-frames (weekly and monthly), while its short-term sentiment is slightly more neutral.
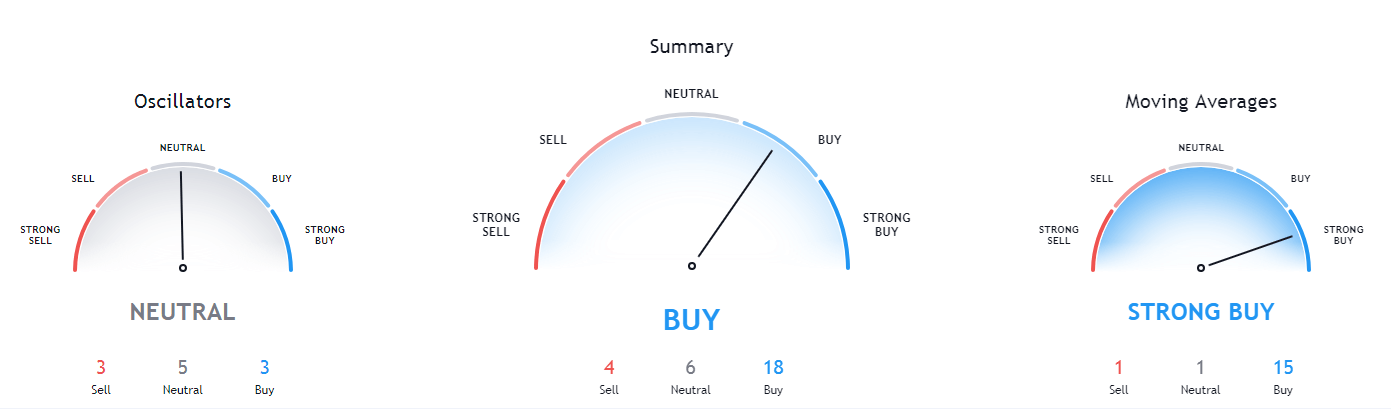
BTC/USD 1-day Technicals
Technical factors (4-hour Chart):
- Price is far above its 50-period EMA and at its 21-period EMA
- Price between its middle and top Bollinger band
- RSI is overbought but descending(73.99)
- Volume is extremely elevated
Key levels to the upside Key levels to the downside
1: $12,870 1: $12,500
2: $13,200 2: $12,300
3: $14,000 3: $12,000
Ethereum
Ethereum’s push from yesterday was just a weaker iteration of Bitcoin’s push. However, the second-largest cryptocurrency by market cap has pushed further towards the upside on its own today, testing the $415 and $420 levels. While tests towards both levels failed, Ethereum is still very near $415 and may have the opportunity to strike again, or just consolidate near this level.
Traders should pay attention to Ethereum’s pullback towards $400 or push past $415 and trade off of that.
ETH/USD 4-hour Chart
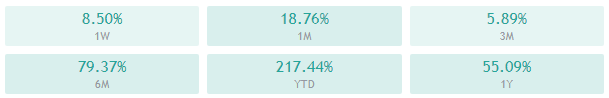
Ethereum’s technicals are slightly confusing, as its 4-hour overview is completely bullish, while its daily overview is neutral-bullish. However, its long term technicals all tilt towards the buy-side.
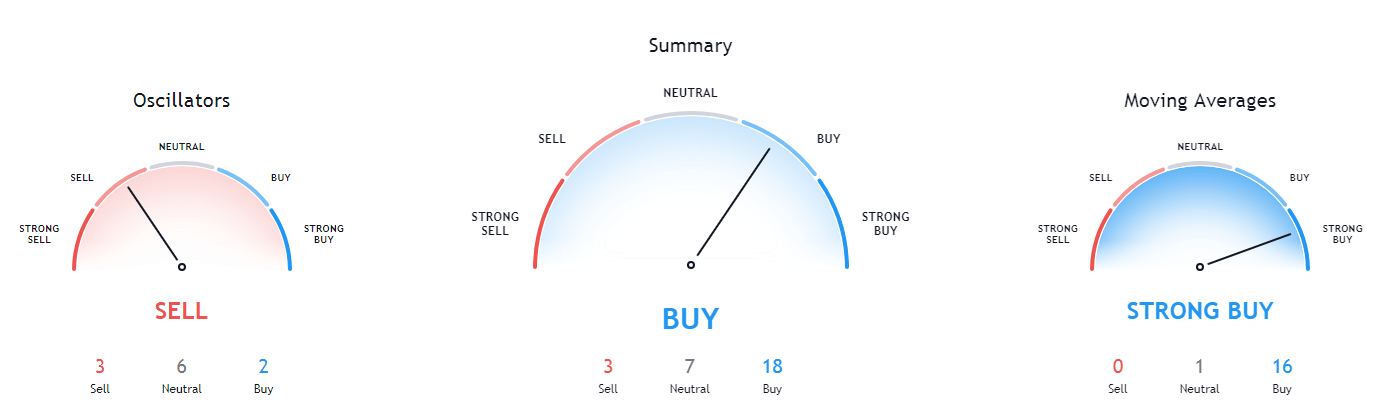
ETH/USD 1-day Technicals
Technical Factors (4-hour Chart):
- The price is far above its 50-period and its 21-period EMA
- Price is near the top Bollinger band
- RSI is overbought (75.95)
- Volume is elevated
Key levels to the upside Key levels to the downside
1: $415 1: $400
2: $420 2: $378
3: $435 3: $371
Ripple
The fourth-largest cryptocurrency by market cap had a day filled with volatility, ups, and downs. XRP started the day off strong with a push past $0.26 and towards $0.266. However, bulls have reached exhaustion quickly, and bears stepped in, pulling the price back down to $0.257, where XRP is now consolidating.
XRP has a high-resistance zone above $0.26, which we have seen today as well. For this reason, it is much more plausible that XRP will push towards the downside and retest the $0.25 or $0.2454 levels.
XRP/USD 4-hour Chart
XRP’s technicals are extremely bullish on the 4-hour and 1-day chart, while they are tilting towards the sell-side the longer time-frame we choose.

XRP/USD 1-day Technicals
Technical factors (4-hour Chart):
- The price far above its 50-period EMA and above its 21-period EMA
- Price is between its middle and top Bollinger band
- RSI has left the overbought territory (61.12)
- Volume is elevated
Key levels to the upside Key levels to the downside
1: $0.26 1: $0.2454
2: $0.266 2: $0.235
3: $0.2855 3: $0.227
Related posts
 Daily Crypto Review, Feb 6 – Is this the Start of the Altcoin Season?
 Daily Crypto Review, May 18 – Robert “Rich Dad Poor Dad” Kiyosaki predicts $75,000 BTC
 Daily Crypto Review, May 20– Will BTC reach $20,000 in 2020? Option Traders Say No
 Daily Crypto Review, May 21 – Satoshi Nakamoto Moving Crypto? Crypto Payments Available on Shopify