
Position Sizing V: Optimize your returns using the Percent Risk Model
Besides the constant position size, the Percent Risk Model is the most used method. The Percent Risk Model allows us to define the number of lots (or mini/micro Lots) as a fixed percentage of the available cash in the trading account.
The risk is defined as the loss incurred if the trade hits the stop-loss order. Thus, every trade must have at least a pre-defined entry and stop-loss. The monetary value in pips from the entry point to the stop-loss is the risk of the trade. The size is determined by MCP simple formula, as already stated in a previous video presentation.
M=C/P
M is the number of mini-lots, C is the cash at risk, the percent risk decided by the trader, and P is the pip distance from entry to stop-loss.
C, the cash at risk, can vary widely, and it will determine the profitability of the strategy and, also, the max drawdown incurred.
From the MCP formula, we can deduct that M increases as P decreases. So tight stops wold allow traders to increase M without increasing the dollar risk C, but, before analyzing this methodology, we have to emphasize that the stop-loss setting must be set at its optimal place. Setting them too close to the entry to increase the position size will force the trader to close a position that would be profitable with a proper stop setting.
In our site, Forex.academy, we have already published several methods to optimize the stops. We recommend you to give them a look.
Masteting Stop-Loss setting: How about using Kase Dev-Stops?
The Constant Size Risk Model
The Percent Risk Model is a compounding method. The constant-size trading method uses a single size, independent of the amount of cash available, so it has drawbacks. The first one is that the size of the position does not decrease on drawdowns. Imagine a trader risking One-tenth of the initial cash, experiencing a 10-losing streak. He will be wiped out! Also, If he is successful, this position sizing method does not allow him to use the money gained in the markets to make more profits. It is like having a constant account and withdrawing all the gains. Thus it is much more difficult to create wealth.
To see the importance of compounding, let’s look at the difference between a constant mini-lot size and a compounding 1% risk in one year of trading using the trade signals of our Live Signal Service, starting in both cases with $10,000:
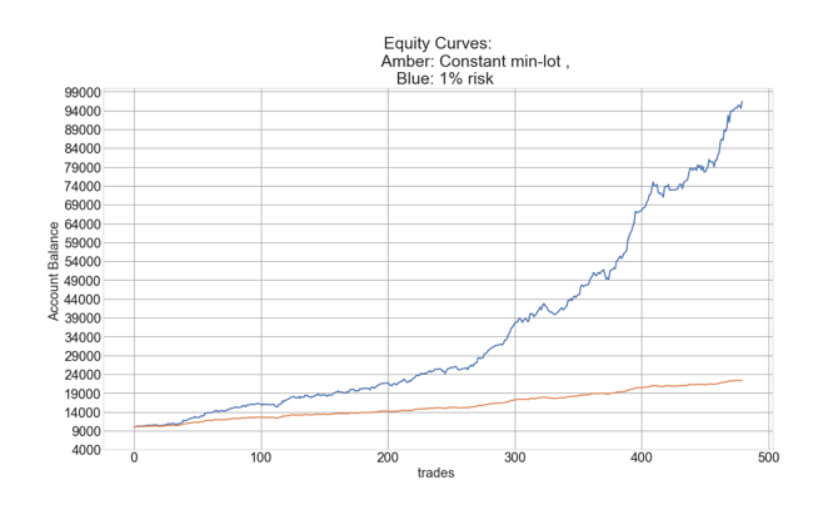
In the image, we can see that while the profits of the constant-sizing methodology are linear, the equity curve of the percent-risk model is exponential. We can also observe by the ripples of the curve that the Percent Risk Model has higher drawdowns, which grow (moneywise) with the trading account’s growth. These are the main features of these sizing models.
Optimizing Our Percent Risk Model
The figure below, shows the hypothetical position sizing curves of 1%, 2%, 5%, 10%, and 20% risk models in log-scale, for the same segment of a trading system with 68% winners and 1.1 reward/risk factor, which shows similar figures as our Live Signal Service. We can see that the theoretical account growth can be made astronomical by increasing the position sizing. Unhappily, the future is not written in stone, and future returns can vary substantially from past performances. Thus, the trader must set his trading goals taking into consideration no only the growth but also the drawdown.
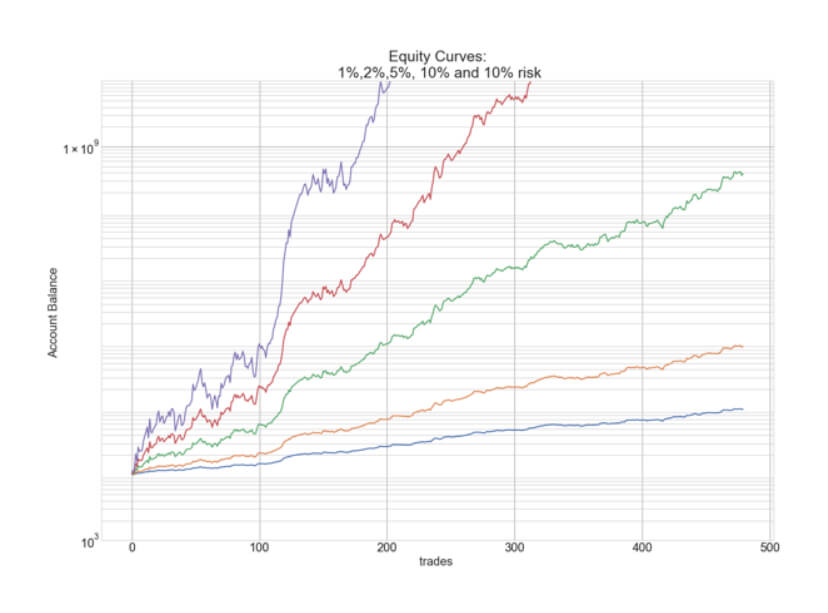
For instance, in the figure above, the steepest curve, corresponding to the 20% risk model, shows several 90% drawdown segments. Are you willing to accept to lose 90% of your hard-earned profits to push your returns to the sky? Indeed, there is a limit to the amount a trader can withstand to lose. Thus, it seems reasonable to define our desired maximum drawdown and set the percent risk accordingly.
Let’s say our risk appetite allows us to lose up to 25% Drawdown, and that our system is well below 10 losing streaks. An approximation of our ideal Percent Risk Model Size is to divide 25% by 10 and set our trade size to 2%.
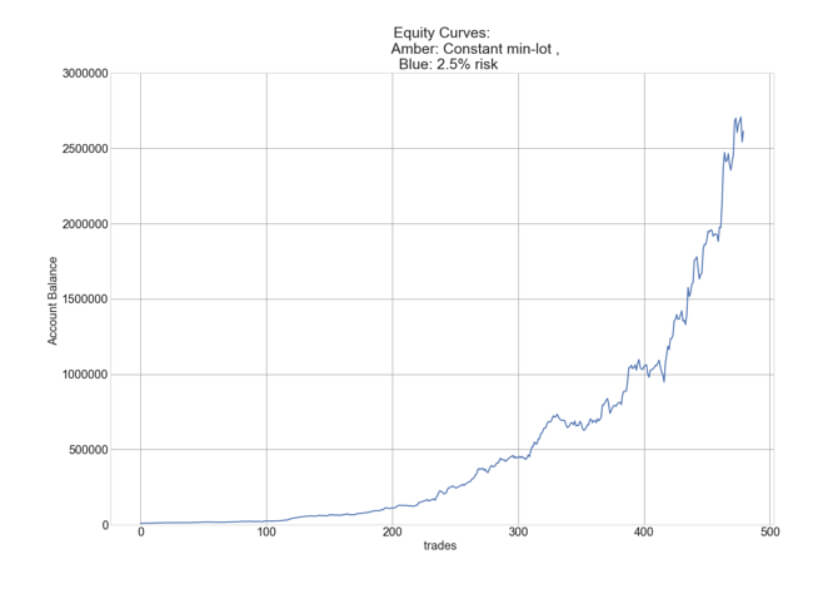
To verify this figure, traders with programming abilities could create a code to produce a Monte Carlo simulation of futures trades. That is what we have done here. The curve below corresponds to the drawdown histogram of 10,000 synthetic trade histories.
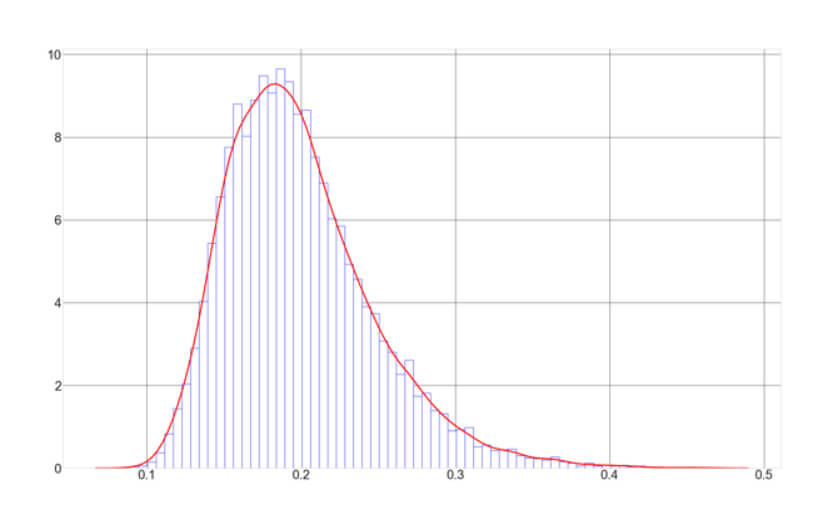
Mean Drawdown: 21.02 %
Our little exercise tells us that the average max drawdown is 21.02%, but there is a 3% chance that we could experience a 30% drawdown in a year. A small sacrifice to convert $10,000 into $2.5 million in 12 months.
In a future video, we will discuss improvements on this basic model.