Position Sizing VIII – Optimal F Revisited: Why You Must Know it?
Now that we know the properties of optimal f, many of you may ask why we bother with this theme, that Optimal f is just a theoretical limit nobody would even approach.
Well, that may be true ( or not). Nonetheless, information is power, and knowing the optimal f of our strategy or system is quite informative. To begin with, maybe unknowingly, you are trading beyond the optimal point.
The next graph shows several distributions’ f-curves with different percent winners and payoff (reward/risk ratios) that may match different trading systems.
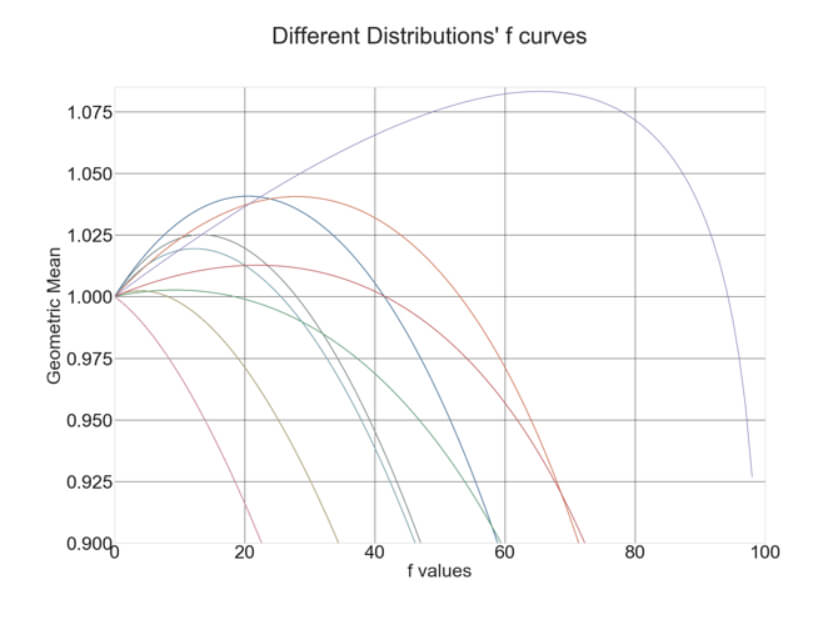
In the graph, we can see that one of them, shown in red, is unprofitable, so the best position size is zero. The first profitable distribution shows its optimal f in the vicinity of 5%. That may indicate the system is poor, and a trader will be beyond its optimal f when several simultaneous trades are taken.
By knowing the optimal f of the strategy we are using, we can assess its quality and figure if we breach the optimal trading limit, risking too much. Thus, optimal f will allow us to compare the real power of a trading system, measured by its geometric mean. The best attainable geometric mean will indicate which trading system to choose among a list of candidates.
A safer way to compute optimal f?
Ralf Vince defines Optimal f as the divisor of the biggest loss, the result of which is divided by the total cash to know how many pips or contracts to have in the next trade. But he assumes that the worst loss has already happened. It is much better for a trader to assume it has not happened.
Due to the properties of the random processes, the statistical properties vary from sample to sample. There is no way to assess the real value, and that is true for all statistical distributions of trading systems.
Montecarlo resampling
With the use of computers and high-level programming languages such as Python, we have on our hands the possibility to create variations of the sequence of trades we took in real life. The use of Monte Carlo resampling will show a more realistic picture of a trading system, signaling its limits and allowing us to be on the safe side.
As an example, let’s examine the performance of forex.academy’s Live Signal service.
The system shows the following basic stat parameters:
STRATEGY STATISTICAL PARAMETERS :
Nr. of Trades: 145.00
Percent winners: 67.59%
Profit Factor: 2.41
Reward Ratio: 1.16
The code to create several thousand different histories is simple. We use Cython to speed up the process. Cython translates Python into C:
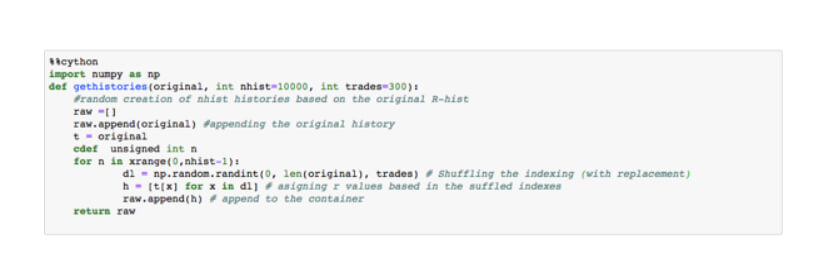
The gethistories() function returns a container with the desired number of trade histories, and with the number of desired trades on each history. This function returns just wins and losses, not capital accumulation.
Using a fixed trade size of 0.1 lots, applied to 10,000 paths, resulting from the Monte Carlo resampling of the original path, on a hypothetical account starting with $5,000, we obtain the following graph, representing about one year of trade activity.
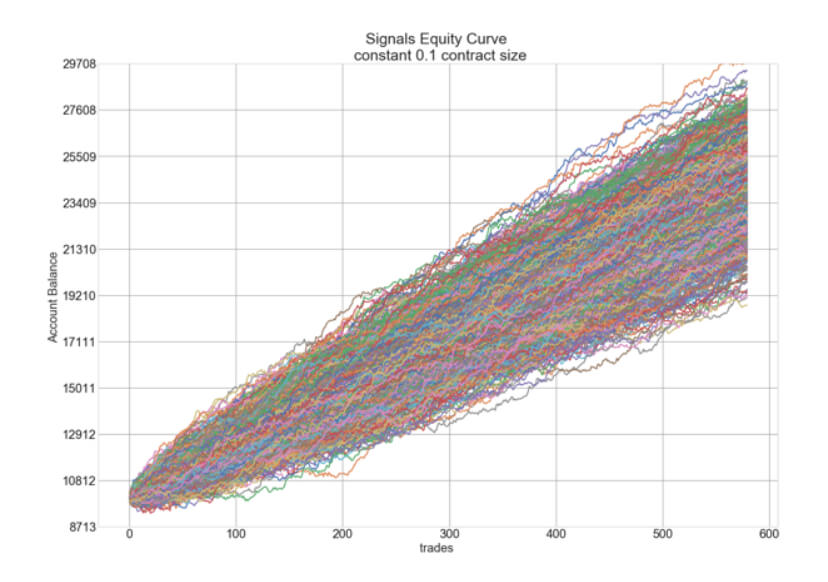
The “smoke cloud” seen is typical of resampling. In the figure, we can see that some paths are luckier than others. The less lucky path shows a final equity of about $19,200, while the most profitable goes over $29,700. This will result in differing optimal f values. That happens because the laws of chance change the sequence’s values; so, every sequence will have its optimal fraction. We look for the lowest optimal f, which will minimize the risk of overtrading.
Finding a safer opt f
This procedure will also help us better assess the optimal f. That means we will compute all the optimal f of the resampled paths. As shown in the histogram below, we obtain a distribution of values that follows a normal distribution.
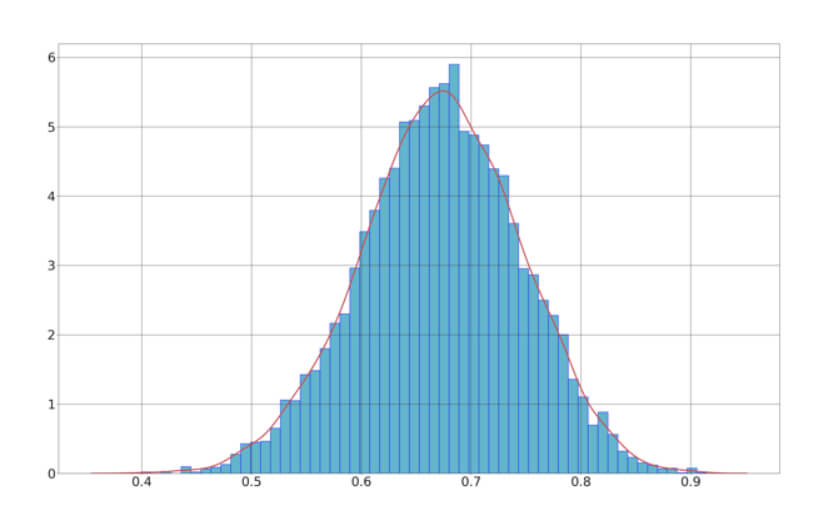
We can, then, compute the mean, max, and min of the optimal f collection. In this case, are:
- max opt f: 0.915
- mean opt f: 0.672
- min Opt f: 0.39
What we look for with this procedure is to find out the minimum opt f value, since we want to minimize the risk of overtrading. In this case, our min opt f is 0.39, which is large enough to be on the safe side when using multiple positions.
For computer geeks, this is the Python code to do optimal f
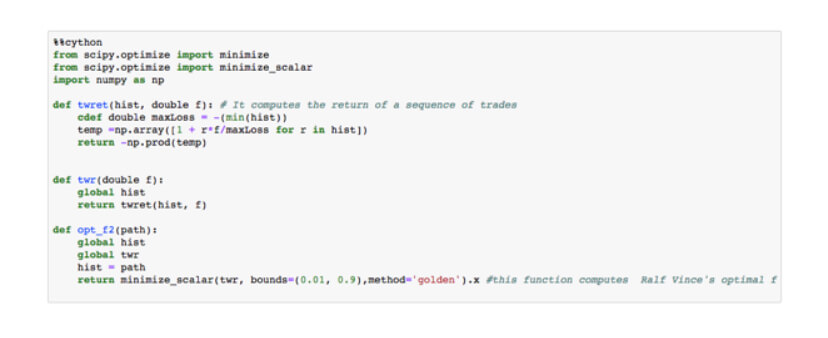
Using these three functions, we can easily compute the opt f values of a collection of trade sequences in just one line of code. The second line is just to plot its histogram.
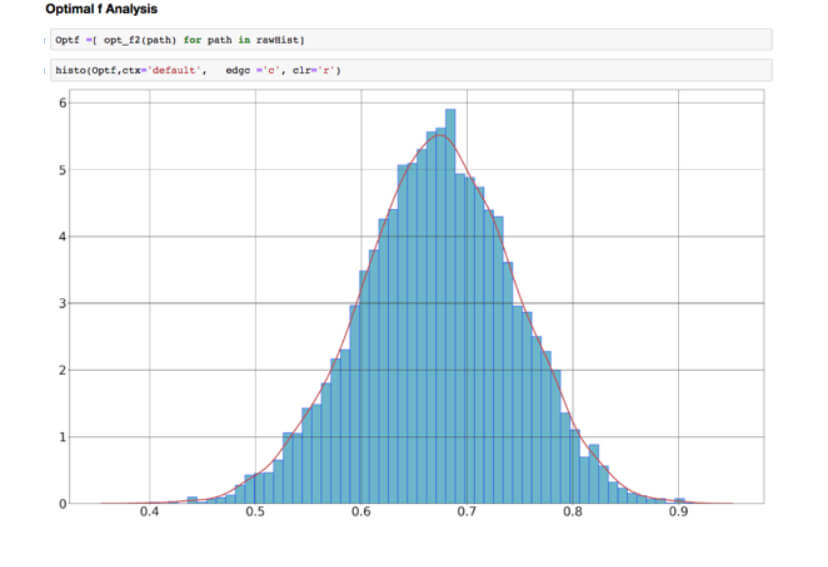
Here rawHist is a container of these sequences or histories. Optf is used to store the values obtained.
Stay tuned! The next episodes will explore more position sizing strategies.