Position Sizing. Drawdown- The dark side of Trade
This video will be dedicated to explaining the relation between performance and drawdown. It is an essential topic since most of the trading community ignores the fact that the drawdown of a trading strategy or system is not an independent value. It is position sizing dependent. Furthermore, the profitability of a trading system is also dependent on the size of the position.
Imagine several investors trying to choose a copy-trading service, and you need to rank the potential candidates. Which parameter do you think most of them would choose to grade the quality of that group of systems? Total returns? Average trade return? Percent winners? Drawdowns?
The majority would rank them by total returns, without any further analysis on how the returns were obtained. This could lead them to select the worst candidate instead.
The fact is that returns and risks are interlinked in all investments. You cannot increment returns without increasing the risk. Consequently, traders and investors must analyze both simultaneously.
Let’s look at the characteristics of returns vs. drawdown using a simple position sizing method applied to the trades of one year using a sound system such as our Live Signals Service.
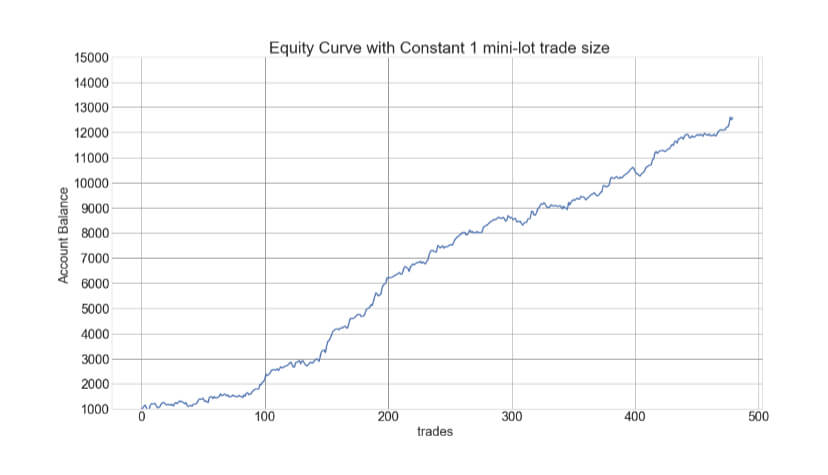
Let’s see first how this system behaves using just one mini-lot size, which corresponds to $1 per pip gained or lost.
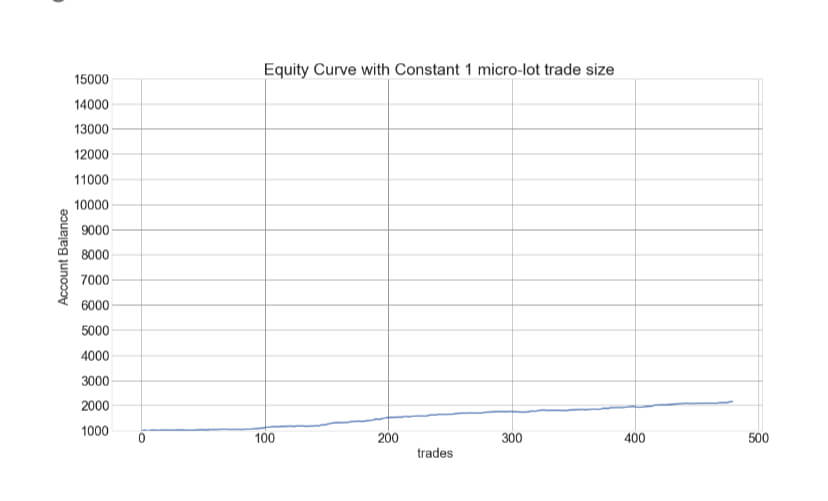
The figure corresponds to a trader having $1,000 initial capital, using a constant one micro-lot trade. To compute the maximum drawdown, we created 10,000 synthetic account paths using Monte Carlo resampling. The corresponding max drawdown distribution is shown below.
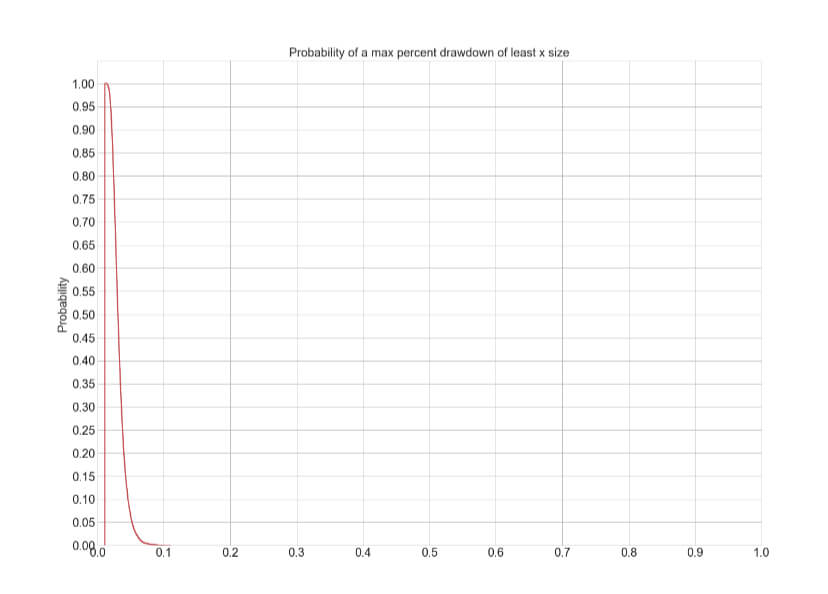
The Average Max Drawdown is 1.94 % with a very tiny possibility a 8% drawdown.
Let’s see how this system performs under increasing lot sizes:
1 mini-lot size
The corresponding drawdown curve is shown below:
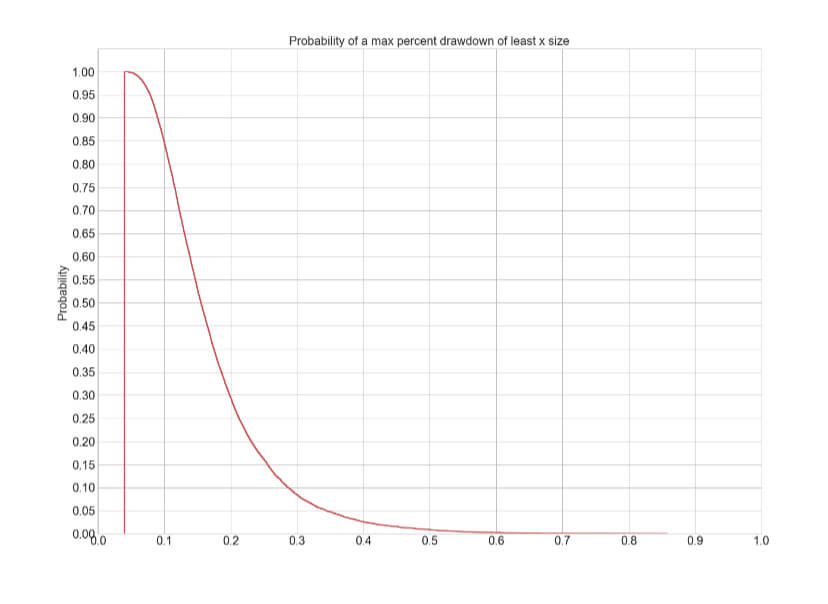
In this case, the average max drawdown goes to 11.77%. But, there is a 30% chance (about one in three) that max drawdown goes to 20%, and in about 2.5% of the occasions, the max drawdown went as high as 40%.
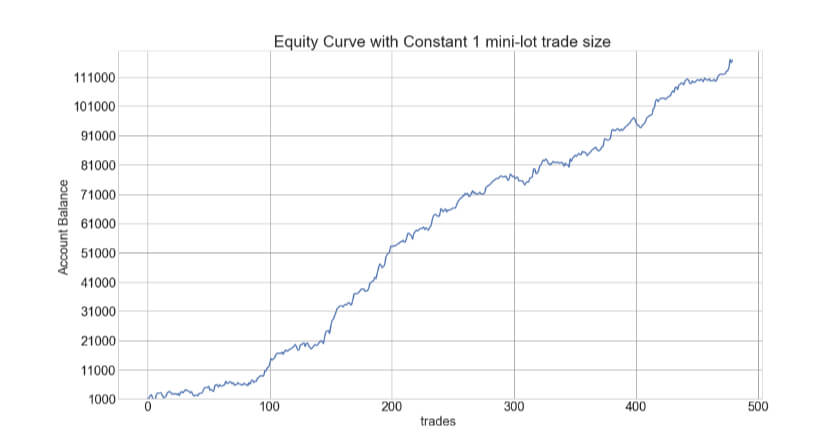
Let’s use now one lot
And the corresponding max drawdown curve is
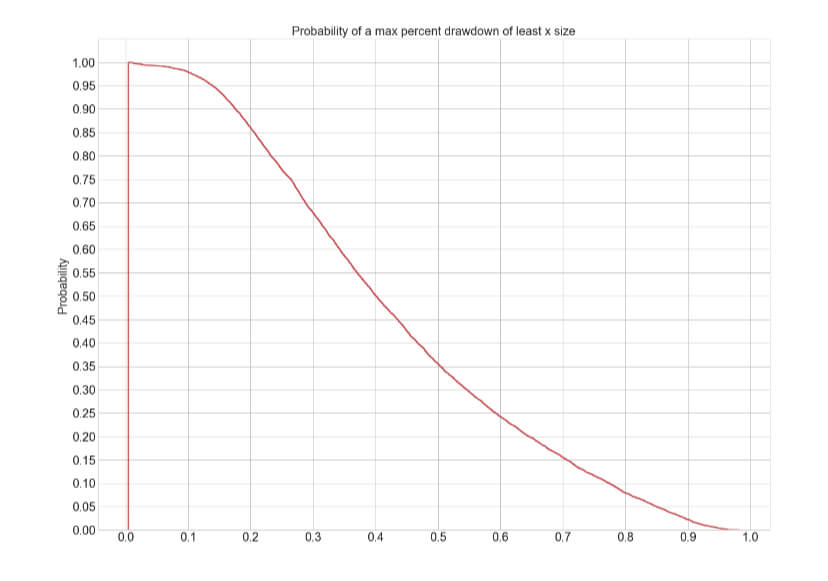
In this case, the average max drawdown is 40%, but there is a 20% chance of a 65% drawdown and a 5% chance of an 85% drawdown. 40% drawdown is about the limit a usual trader can endure, but inevitably a 65% drawdown would force most traders to stop trading, even when we can see that the system is profitable.
We can see that even using a constant trading size, the drawdown grows with the position size. Of course, we can observe that the returns also grow. Furthermore, profits grow at a much higher rate than risk. From the preceding examples, any astute observer can notice that moving from one micro-lot to one lot, 1-year returns went from $1,158 to $115,840, a 100X increment, while the drawdown moved from about 2% to 40%, a 20X increase.
Therefore, the theory behind position sizing is aimed at optimizing both return and drawdown. Of course, there is no single solution to this problem. The solution must fit the particular psychology of the trader.