
Position Sizing XIII- Two-Tier Optimal f Part II
In Two-Tier Optimal f part I, we discussed the virtues and drawbacks of optimal f trading. In this part II video, we will present a methodology that will almost ensure that our initial capital is preserved with the possibility of astonishing growth factors on our trading account. This content is exclusive, and, so far, you will not see it explained elsewhere.
System requirements:
This methodology is valid only with profitable strategies. This method is not a miracle solution for losing systems.
It works best when the risk is homogeneous. That is, the dollar risk is a constant R factor to the rewards.
The better the system, the higher the and smoother are the rewards.
The Two-tier Strategy
1.- We split the trading account un two portions. One portion ( 25% of the total in our case) will be used with Optimal f positioning. The other part will be applied to a 1% risk positioning.
2.- After a determined goal (2X, 5X, 10X, 20X of the Opt-f portion), the account will be rebalanced ( by adding both sub-balances together) and then re-split(25%-75%) to start a new cycle. The cycle will also reboot itself if the Opt-f section’s balance goes below 25% of the value at the beginning of that cycle.
What was the procedure to test the two-tier Opt-f position system?
We took the current Signal Table closes signals and created two 10K trading histories of what would have been one year of trading activity. Thus, resulting in two collections of 10,000m years of trading data. One of the collections was to be used with the Optimal f position sizing portion, and the other one was employed in the 75%-portion of the account. The Python code for the entire simulation is shown below.

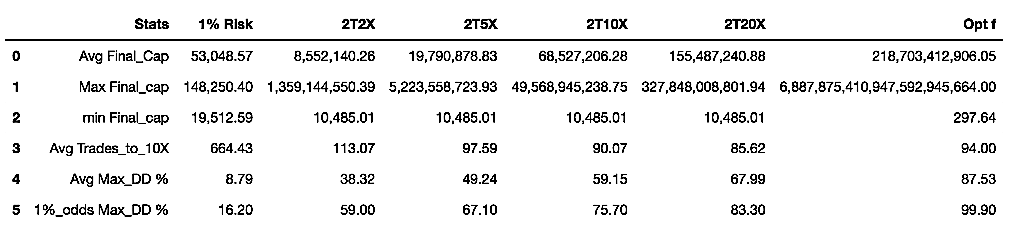
We did this procedure using several targets for the balance of the portion traded using Opt-f: 2X, 5X, 10X, and 20X. We focused the results on the following parameters: Average final capital, max final capital, min final capital, average trades need to 10X total capital appreciation, average max drawdown, The drawdown with 1% probability of occurrence. In the below table, we also present the results of the 1% risk and 100% Opt-f strategies. ( click the image to enlarge).
Discussion
We see that the 1% risk strategy is not bad at all since it can multiply by five the initial balance in one year. It does this with an average max drawdown of 8.79 percent, with the odds of reaching a 16.2% drawdown on one every 100 years. We see also that, on average, it needs 664 trades to multiply by ten the initial capital.
On all two-tier columns, we see a remarkable fact that the min final capital is 10,486. That meant that in all the 10K years of simulated market action, not a single one ended below the initial 10K balance. Thus, this strategy seems to protect us against the loss of the initial capital. That is a terrific psychological reinforcement to withstand the high max drawdowns it presents. The use of the 2X goal is the best choice for the less bold investors, as this method offers an average max drawdown of 38.32%, with a 1% chance of reaching 59% drawdown. After one year, the average final capital is $8.5 million, with a starting capital of only 10K. This positioning strategy multiplies by ten the capital, on average, every 113 trades. The second best choice is a 5X goal. That will more than double the yearly returns at the expense of a near 50% drawdown on average. On the table, we can see that the more we increase the goals to rebalance, the more the account growth, but also the max drawdown.
We can see that these strategies’ growth is orders of magnitude lower than fully Optf position sizing. Still, the attractiveness of this strategy is that the odds of being smaller than 10K after one year of trading are virtually none.
More ideas
We used 1% as the size used in 75% of the total capital in the preceding trading sizing proposals. Of course, we could modify that to better profit from the total capital with almost no increase in drawdown and fully preserving our initial capital. You can make your own simulations on this to find the best fit for you. As examples, let’s present three more simulations using Optf/10, Optf/ 5, and Optf/2 with 2X rebalancing goals.
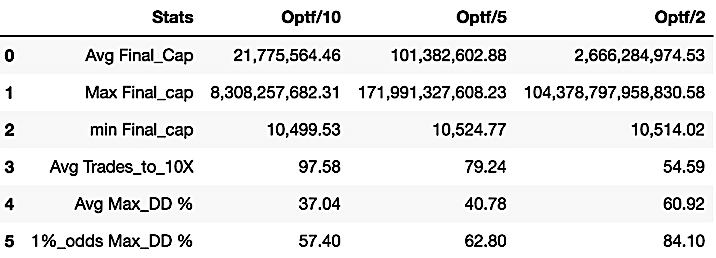
In the image above, we see that using Optf/5 in 75% of the capital will deliver huge profits with 40%-63% Drawdown figures and 79 trades to 10X capital appreciation. All this with almost no chance to blow up the account.
Final words
This video shows exclusive and never taught position sizing methodologies that protect the initial capital and offer vastly superior results to the 1% risk standard methodology. But you must be aware that we are assuming the trading strategy is effective long term. The trader will also need to find the safest optimal f value by performing the proper computer simulations.
That also shows that position sizing is part of a trading system that really helps you achieve your monetary objectives. And for optimizing it, you need to know the optimal f of the system you’re using.
Of course, the market will limit the trading size we can reach without influencing it, but as theory, these methodologies are real wealth multipliers for the serious trader.
To employ a two-tier methodology in the real market, you will need to be fully organized, have an appropriate spreadsheet to follow the trade results, have two split balances, and compute the size of the coming positions.