
The cryptocurrency sector has experienced a surge over the weekend as Bitcoin pushed above $11,000. Bitcoin is currently trading for $11,319, representing a decrease of 0.25% on the day. Meanwhile, Ethereum gained 0.09% on the day, while XRP gained 0.32%.
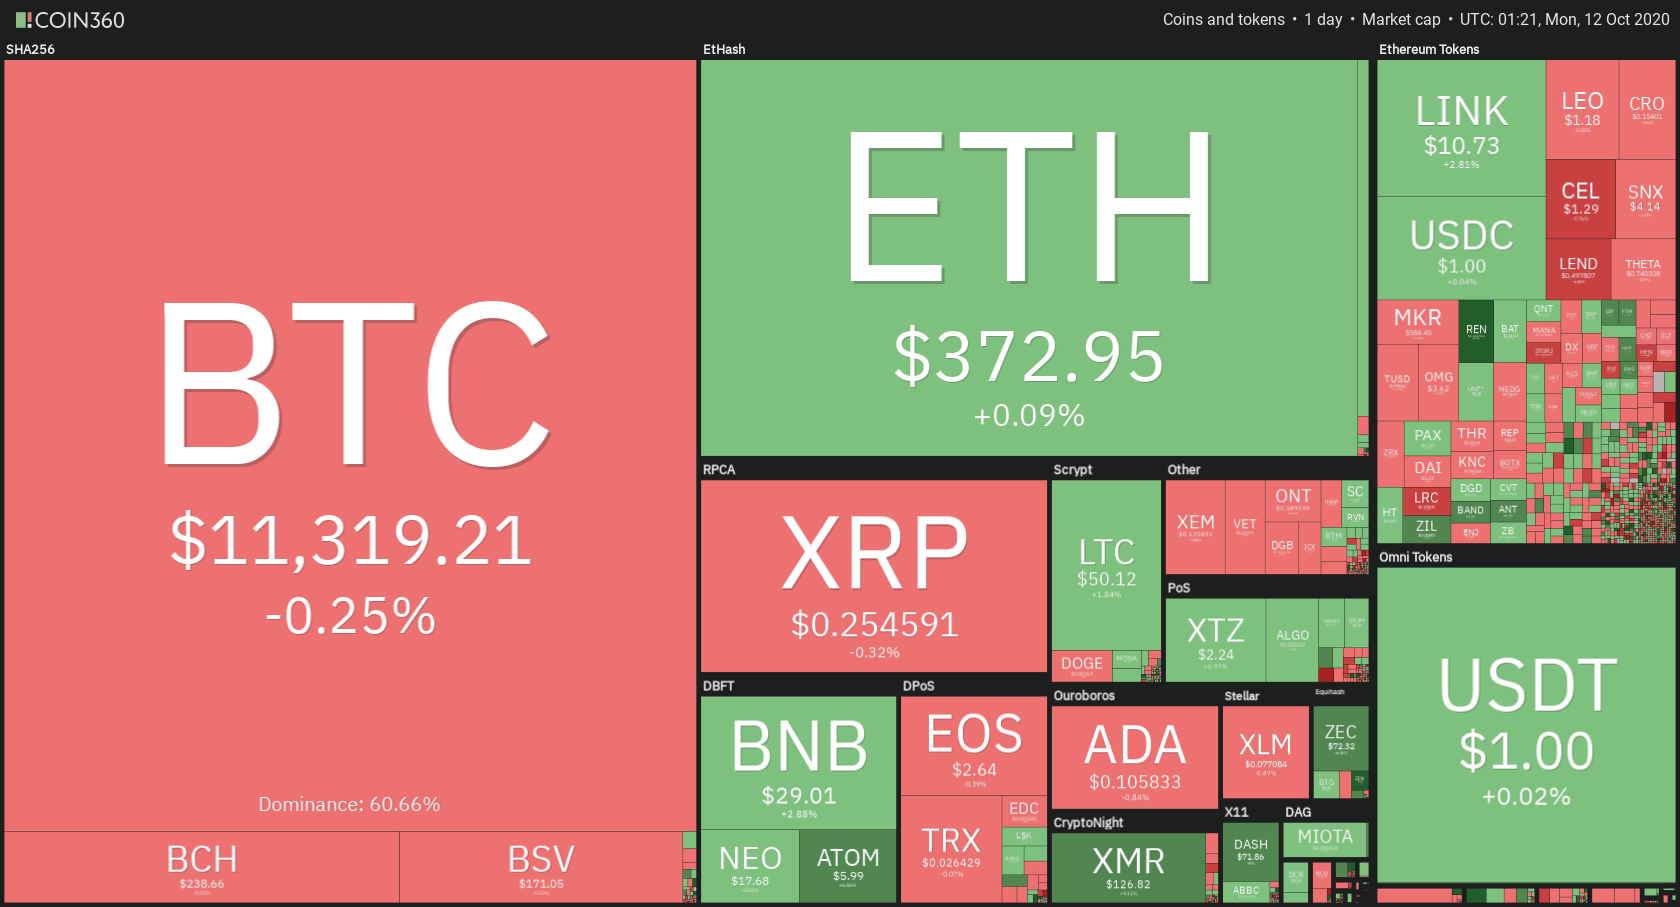
Daily Crypto Sector Heat Map
Taking a look at the top 100 cryptocurrencies, we can see that Ren gained 27.02% in the past 24 hours, making it the top daily gainer. Monero (9.75%) and Cosmos (7.98%) also did great. On the other hand, Loopring lost 7.99%, making it the most prominent daily loser. It is followed by StorJ’s loss of 6.76% and PumaPay’s loss of 6.54%.
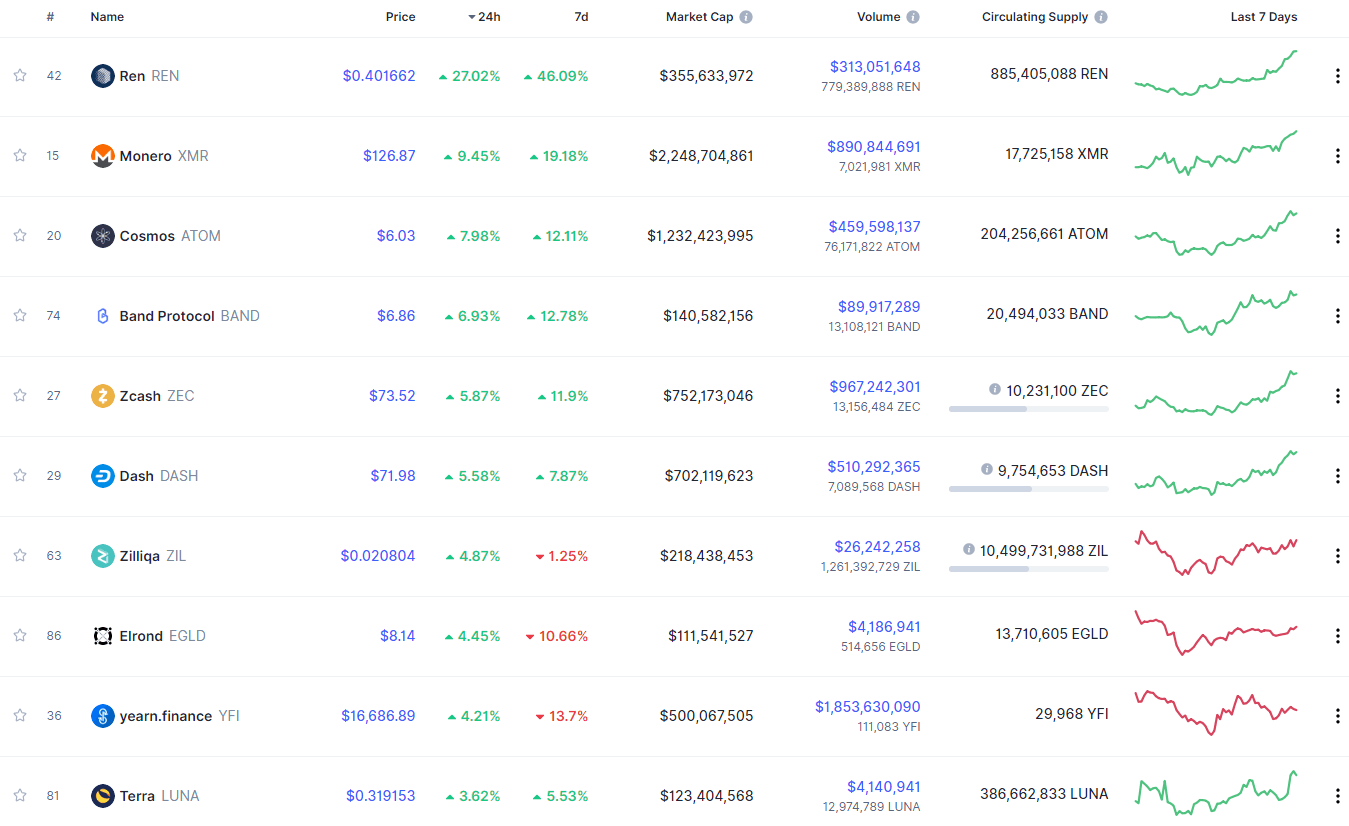
Top 10 24-hour Performers (Click to enlarge)
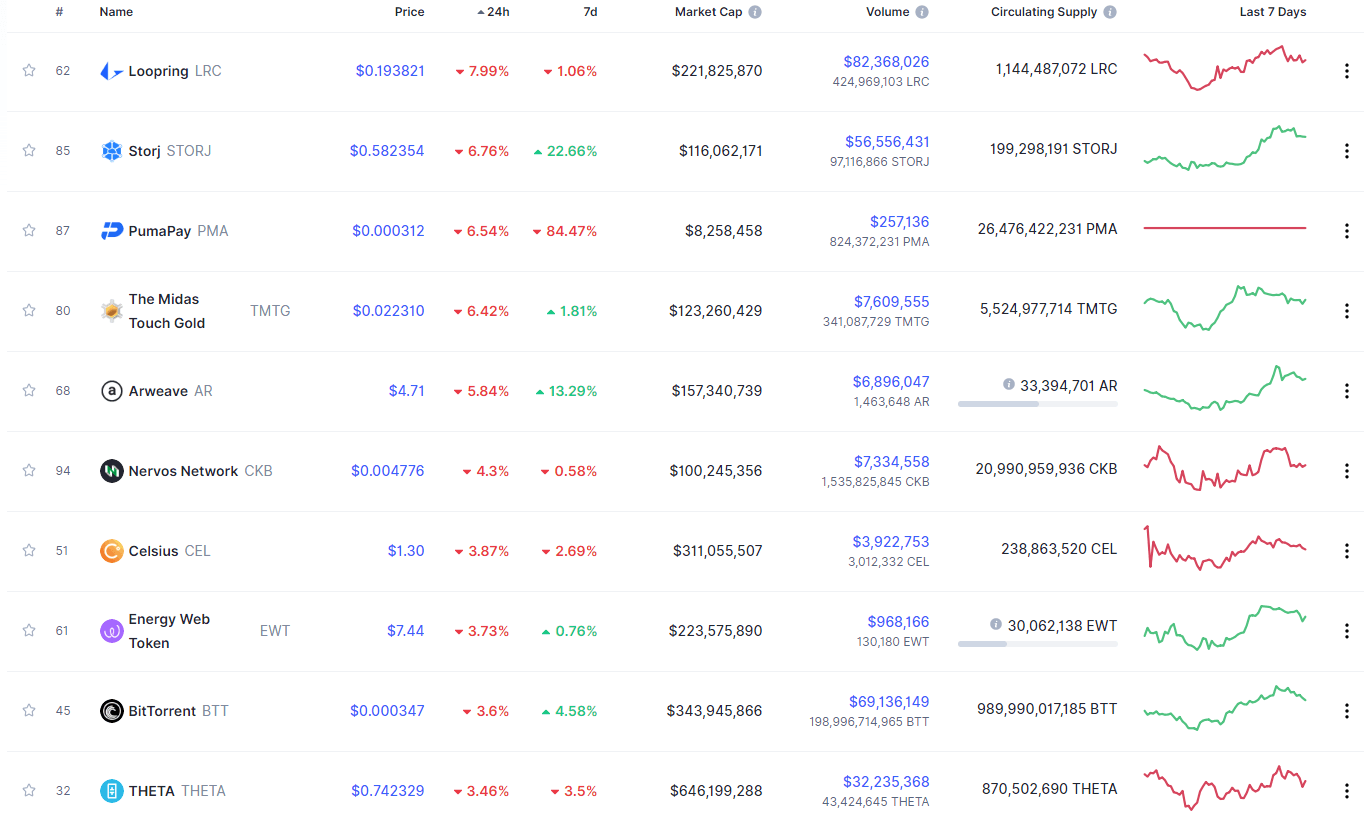
Bottom 10 24-hour Performers (Click to enlarge)
Bitcoin’s market dominance level has decreased slightly since our last report, with its value currently being 60.66%. This value represents a 0.67% difference to the downside when compared to when we last reported.
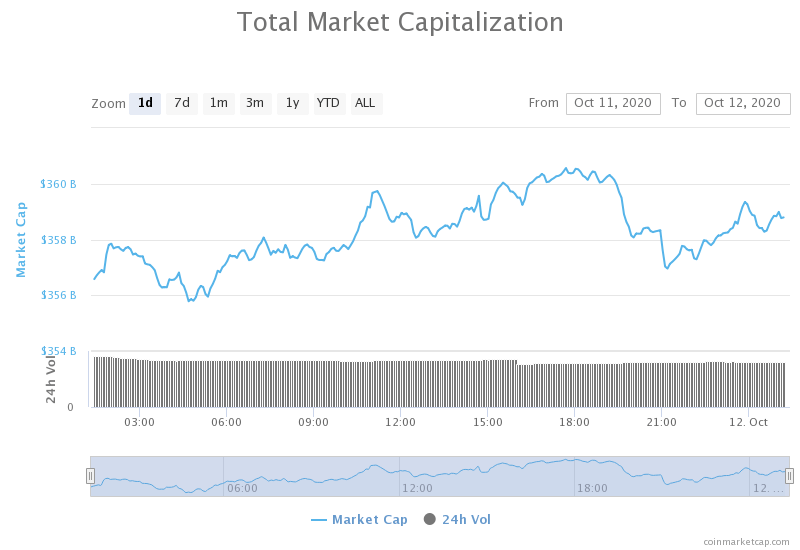
Daily Crypto Market Cap Chart
The crypto sector capitalization has gained quite a bit of value over the course of the weekend. Its current value is $358.48 billion, representing an increase of $14.33 billion compared to our previous report.
_______________________________________________________________________
What happened in the past 24 hours?
_______________________________________________________________________
- Web traffic to cryptocurrency exchanges fell by over 14% in September (The BlocK)
- Bitcoin transaction values and fees grew in 2020’s third quarter (The Block)
- Monthly Ethereum futures volumes hit all-time high in September (The Block)
- “Don’t vacation yet”: Stablecoin supply suggests Bitcoin and altcoins could rally further (Cryptoslate)
- If all US companies followed Square, $250 billion could enter Bitcoin (Cryptoslate)
- Ethereum Miner Revenues Triple from DeFi, Approaches Parity with Bitcoin (Cryptobriefing)
- Technicals Show Tezos Prices Ready for an Impressive Upswing (Cryptobriefing)
- Cosmos Technicals Present Golden Profit Opportunity (Cryptobriefing)
- Spanish lawmakers get crypto in a bid to promote industry (Cointelegraph)
- More investors HODL Bitcoin as they anticipate a 2021 BTC bull market (Cointelegraph)
_______________________________________________________________________
Technical analysis
_______________________________________________________________________
Bitcoin
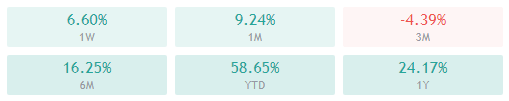
The largest cryptocurrency by market cap has continued its push towards the upside on Friday/Saturday, reaching as high as $11,500. The move has died out since, and Bitcoin is now trading in a narrow range between the $10,300 support level and $10,500 resistance level (61.8% Fib retracement). The volume seems to be dying off, while the RSI is descending, which may indicate a short window where traders shouldn’t expect much volatility, but rather trade within this range. However, Bitcoin cannot stay locked up in such a narrow range for too long and will have to make another move in the short future.
BTC/USD 4-hour Chart
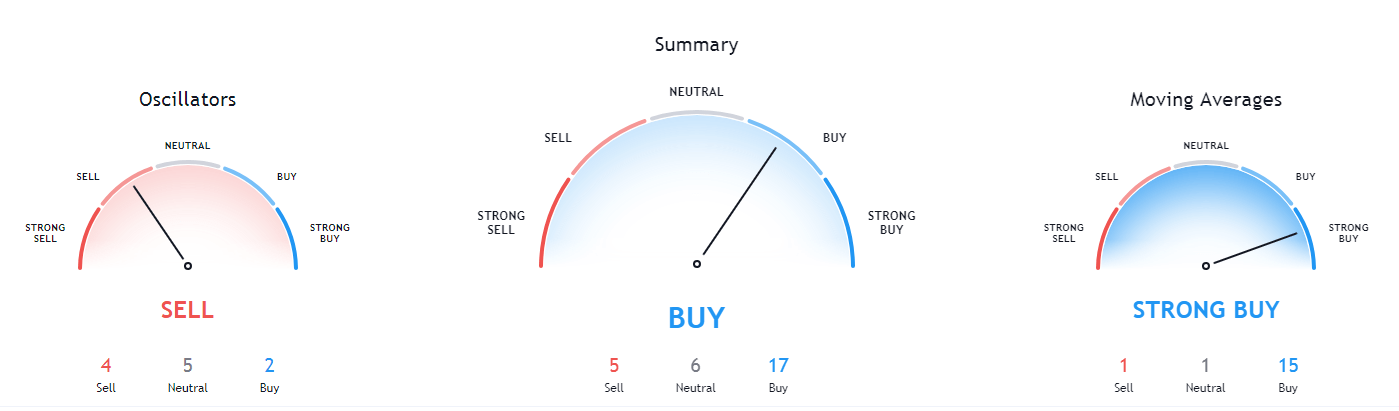
Bitcoin’s technical overview is tilted towards the buy-side overall, but its short-term (4-hour and 1-day) technicals are a bit mixed up, with oscillators questioning the bullishness. However, its long-term outlook is completely bullish
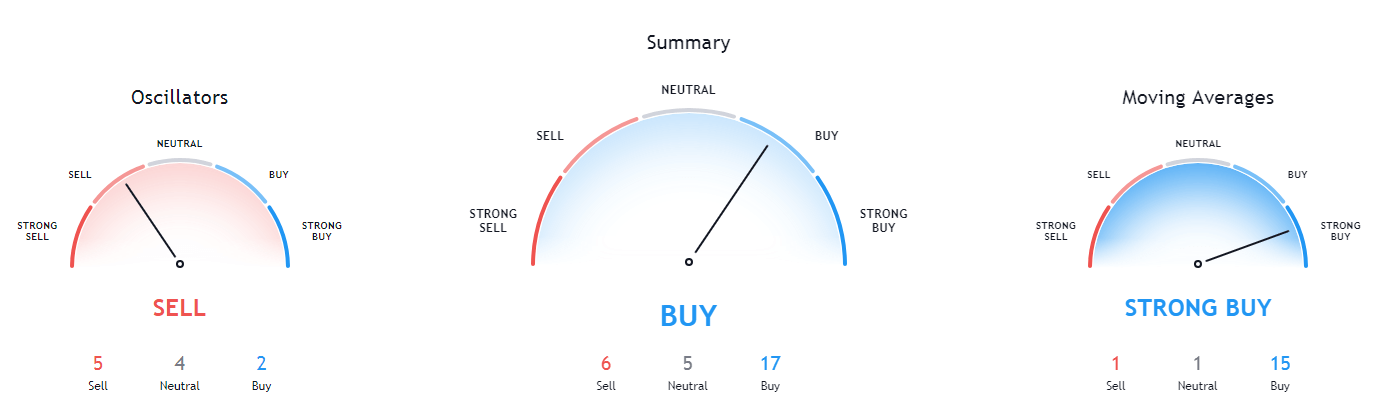
BTC/USD 1-day Technicals
Technical factors (4-hour Chart):
- Price is above both its 50-period EMA and 21-period EMA
- Price is near the middle Bollinger band
- RSI is descending from almost-overbought levels (66.90)
- Volume is descending
Key levels to the upside Key levels to the downside
1: $11,500 1: $11,300
2: $11,630 2: $11,180
3: $12,000 3: $11,000
Ethereum
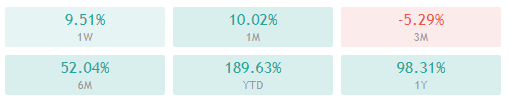
Ethereum’s movement over the weekend was similar to Bitcoin’s, with its price skyrocketing on Friday/Saturday, only to consolidate after the move ended. Ethereum bulls reached exhaustion after the price hit the 38.2% Fib retracement, and started consolidating right below it. Just as with Bitcoin, Ethereum is stuck within a range, bound by $371 to the downside and $378 to the upside.
Ethereum’s flat (and nearly overbought) RSI and descending volume indicate that Ethereum is preparing for a move.
ETH/USD 4-hour Chart
Ethereum’s short-term technicals are somewhat unclear, with its 4-hour overview turning to bullish and 1-day overview still being tilted towards the sell-side quite heavily. On the other hand, its long-term technicals are quite bullish.
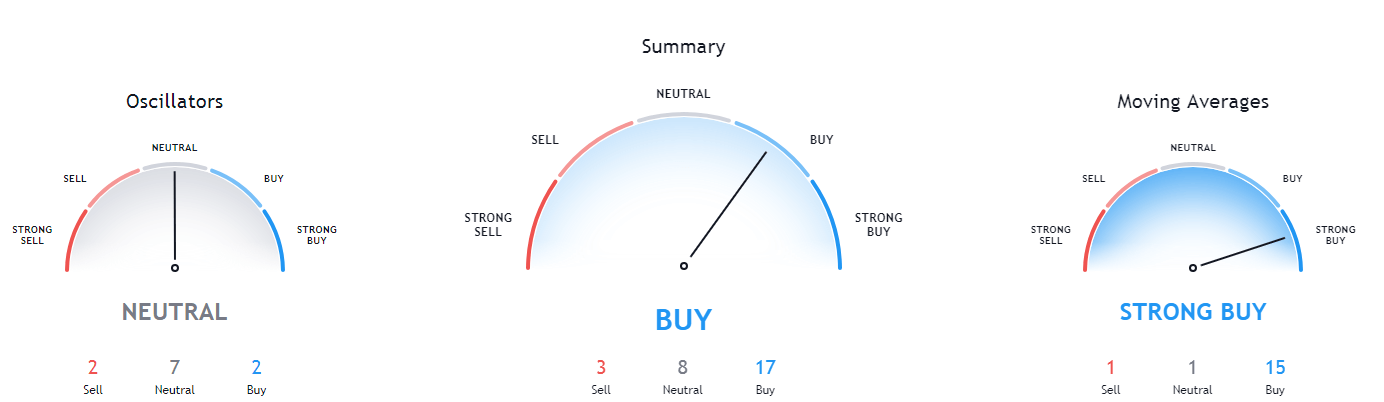
ETH/USD 1-day Technicals
Technical Factors (4-hour Chart):
- The price is above both its 50-period and 21-period EMA
- The price is near its middle Bollinger band
- RSI is flat and nearly overbought(66.85)
- Volume is below average
Key levels to the upside Key levels to the downside
1: $378 1: $371
2: $400 2: $360
3: $415 3: $334
Ripple

While XRP has also moved over the weekend, its move was not as significant as Bitcoin’s or Ethereum’s move. This is simply because it did not break any recent resistances, but rather got stuck at the same one it couldn’t get past on Oct 6. XRP is now consolidating at around $0.255, and we may possibly see a pullback to the orange ascending line as a retest of this upward-facing trend.
XRP has two possibilities now: it will either push towards $0.266 (less likely) or pull back towards the ascending line (more likely). Traders should keep in mind both of these scenarios when attempting to trade XRP.
XRP/USD 4-hour Chart
XRP’s 4-hour, 1-day, and weekly technicals are practically the same and are all tilted towards the buy-side (with oscillators being more or less neutral), while its monthly overview is heavily tilted towards the sell-side.
XRP/USD 1-day Technicals
Technical factors (4-hour Chart):
- The price is above its 50-period EMA and at its 21-period EMA
- Price is at its middle Bollinger band
- RSI is descending (52.16)
- Volume is average (descending)
Key levels to the upside Key levels to the downside
1: $0.266 1: $0.2454
2: $0.27 2: $0.235
3: $0.273 3: $0.227
Related posts
 Daily Crypto Review, July 24 – Bitcoin Above $10,000; Ethereum Passing $300
 Daily Crypto Review, July 28 – Bitcoin Spikes to $11,000; Over $300 Million Liquidated
 Daily Crypto Review, August 11 – yEarn Finance Token Explodes After Binance Listing; BTC Hashrate Unaffected by the Price Upswing
 Daily Crypto Review, Dec 18 – Bitcoin at $23,000; Crypto Sector Preparing for the Next Move