In this weekly BTC /USD analysis, where we are looking at the most recent events, the current technical formations, as well as discussing possible outcomes.
Overview
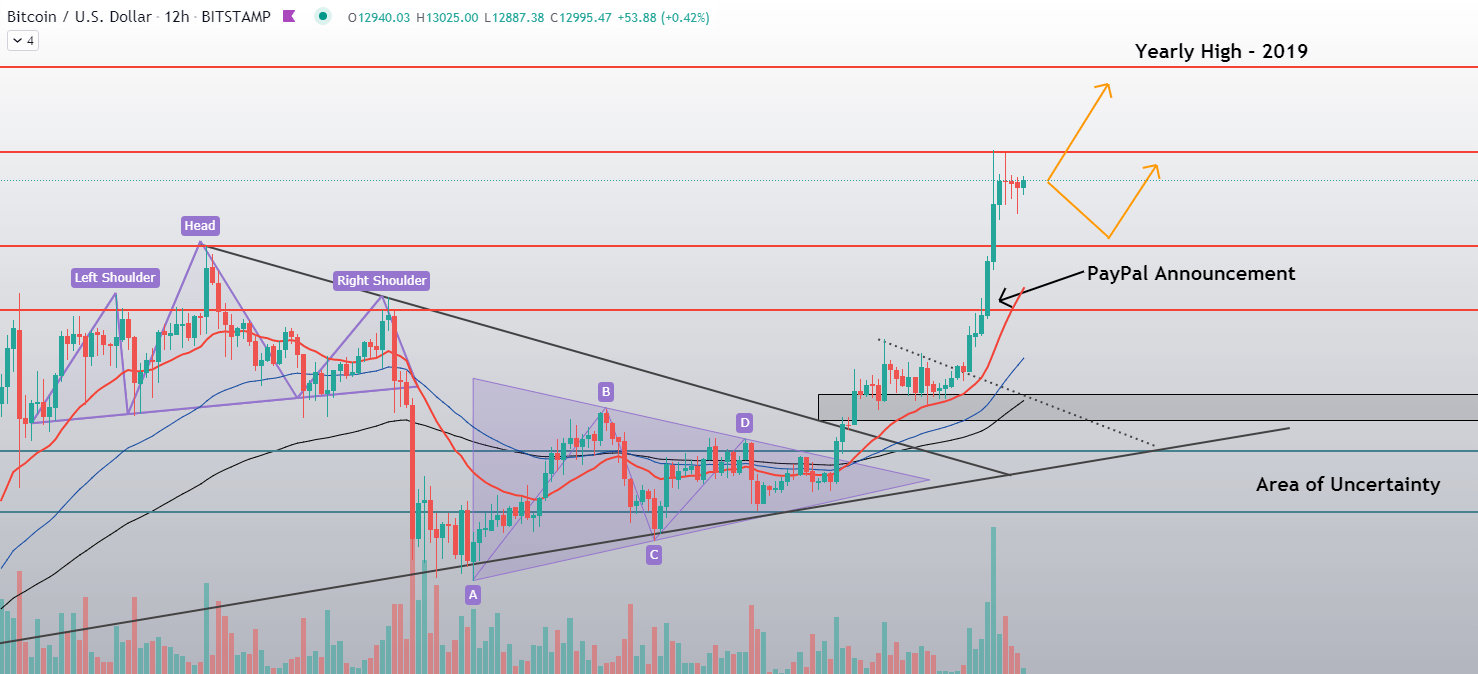
Bitcoin has had another week of explosive gains, mostly due to its fundamentals. This week’s spike can’t go without mentioning PayPal’s announcement that it will enable its users to buy, sell and hold crypto, as well as that it will not be just a gimmick but rather a crucial factor in PayPal’s future business development (PayPal will offer crypto payments to its 26 million merchants, as well as enable the usage of crypto on its payment processing app Venmo). This news, alongside other news of large corporations investing tens of millions in Bitcoin and crypto, sparked the push past $12,000 and up to $13,235.
Technical factors
Bitcoin has abruptly left its triangle formation last week, pushing a little above $11,700 before consolidating and pulling back. After being pressed between $11,300 and $11,500 for some time, the PayPal news broke out, and Bitcoin surged, reaching as far as $13,235 before the move stopped.
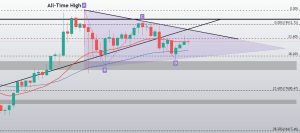
Bitcoin is now in a consolidation phase, creating a triangle formation on the smaller time-frames. The formation is accompanied by descending volume, indicating that the move that will follow will be quite strong. Its RSI is overbought on all time-frames above 4 hours, while its moving averages are at play only at the 1-hour chart, where the current price is supported by the 21-period moving average.
Sentiment built around Bitcoin is certainly bullish at the moment, and any serious downturns are very unlikely. However, a slight pullback before the next push is likely.
Another thing to add is that Bitcoin is one step away from moving into the “fresh air” territory (after the 2019 high of $13,900) where there is no technical or historical volume ahead, meaning that this territory will be full of new people entering the market to chase profits as well as smart money taking profits.
Likely Outcomes
Bitcoin currently has two main scenarios it can play out. Both of these scenarios are bullish, where one breaks out above the current 1h time-frame triangle formation to the upside and past the $13,200 area, while the other one involves a pullback before the spike.
1: As shown in the chart, Bitcoin will most likely have to retrace slightly and reset its RSI level. While the bull sentiment is prevailing, the largest cryptocurrency by market cap should establish and confirm its support at the ~$12,500 level (which it breezed through) before going further up.
2: The other scenario is slightly less likely, and involves a simple breakout scenario of the current triangle formation to the upside and a push towards (ultimately) $13,900. This level will certainly be contested as it is the last frontier before the all-time high territory. On top of that, many investors will most likely take profit at this level.
The scenario in which Bitcoin suddenly down sharply and swiftly is incredibly unlikely. While a strong move in this direction is possible only if it’s backed by some bearish news/events, the bull phase Bitcoin is in at the moment is highly resistant to bad news.
One reply on “BTC/USD Chart Overview + Possible Outcomes”
Has to be only positive with PayPals involvement