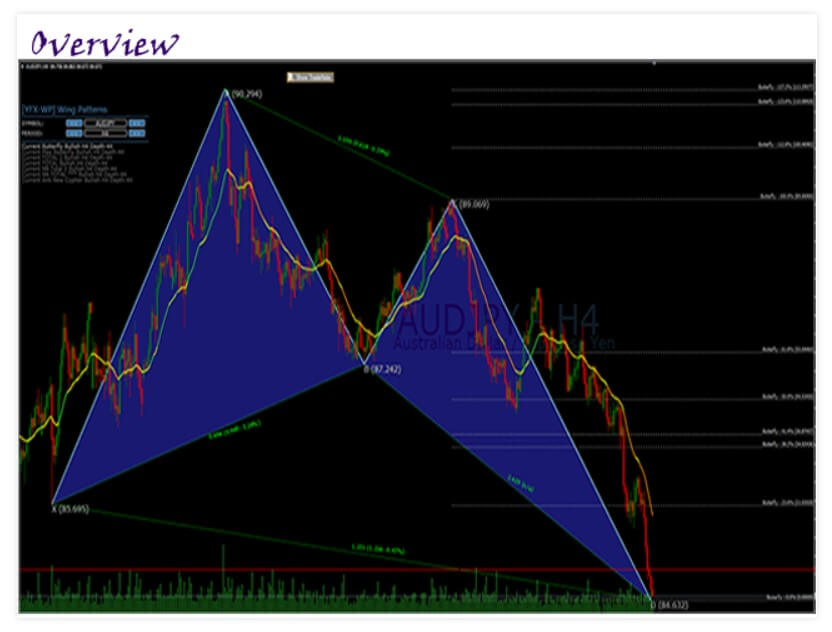
The Wing Patterns indicator will look for many different pattern types using a structure called XABCD. When we speak of “Wing Pattern” we use this term to refer to all kinds of patterns based on a general XABCD structure, which is drawn in an extreme high-low alternative form.

In other words, let’s assume that point X starts at a low point in the table. Point A is drawn at the next highest score within a certain number of bars. This specific number of bars is called the depth level. Point B would be drawn at the next lowest point for a particular depth. Following the flow, point C is the next high, and point D is the next low. If we connect these points in a graph, it usually looks like the wings of a butterfly, that’s why we call it “Wing Pattern”.
The harmonious wing pattern strategy will teach you how to negotiate such a pattern and start making money with an exciting new approach to technical analysis. The market strategy of the wing pattern is part of the harmonic pattern trading system. You need to read introductory articles on harmonic patterns as this will give you a better understanding of how to negotiate the wing pattern.
The wing pattern is similar to the Cypher harmonic pattern but follows different Fibonacci relationships. One of the most accurate ways to differentiate a wing structure from a cypher pattern is the B point, which, if it does not go beyond 50% Fibonacci leg XA recoil, then is a wing. Otherwise, it can become a Cypher structure, which is a different indicator.
The market strategy of the wing pattern is suitable for all time frames and for all markets, but we have to take into account that in the lower time frames if we use the wing pattern strategy, we will see how the market comes with its own challenges because the wing pattern has the tendency to appear less frequently in the lower time frames.
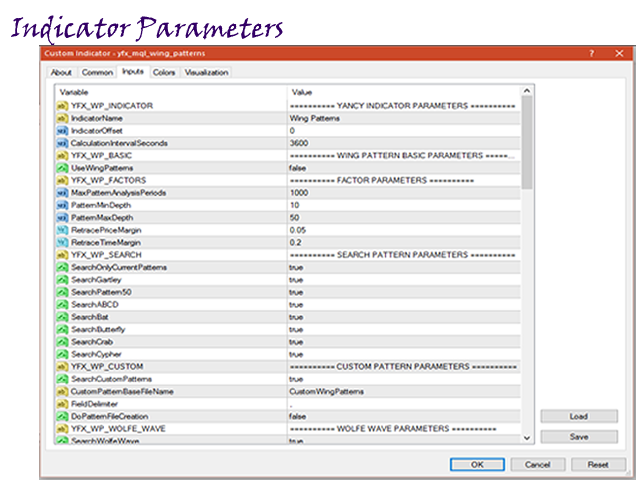
Before we dive deeper into the harmonic wing pattern strategy, let’s see what indicators we need to negotiate this strategy successfully. The setback and relations of Fibonacci are at the center of harmonious trade. Thanks to the rapid progress in the field of technical analysis we can find some very useful indicators to really help us plot the harmonic patterns and these Fibonacci ratios.
You can find the harmonic wing pattern indicator in the most popular Forex trading platforms, such as Tradingview and MT4 in the indicators section. Its price is 30 USD, although you can get a free trial version, or if you don’t want to buy it, you can rent it for 3 months at a price of only 10 USD. We recommend this indicator to advanced traders as strategies with harmonic patterns are not easy to understand for a beginner, who should read about this topic to understand it well.