In this weekly BTC/USD analysis, we will be taking a brief look at the most recent events, current chart technical formations, as well as the possible BTC short-term price outcomes.

Overview
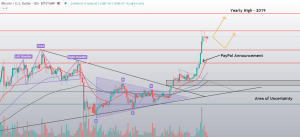
Bitcoin has spent the past week experiencing a long-awaited pullback, after which it started consolidating. The largest cryptocurrency by market cap has dropped significantly and reached as low as $16,200 before bears reached exhaustion after failing to break its all-time high. While some analysts are calling for an end of the pullback, most of the data shows otherwise. First off, the current controversy around China seizing 1% of all Bitcoin is contributing towards the overall bearish sentiment. Second, a poll done on crypto investors says that the majority of investors believe that BTC will end up correcting as much as 40%. All this, plus the fact that Bitcoin couldn’t push past $17,260 for a couple of days now, is a testament to the short-term bearish sentiment.
On the other hand, people shouldn’t mistake this for a long-term bearish trend. In fact, Bitcoin has never been more bullish long-term.
Technical factors
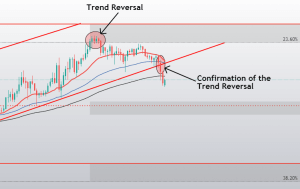
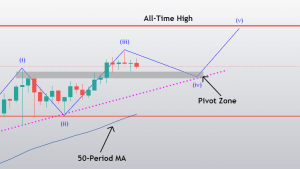
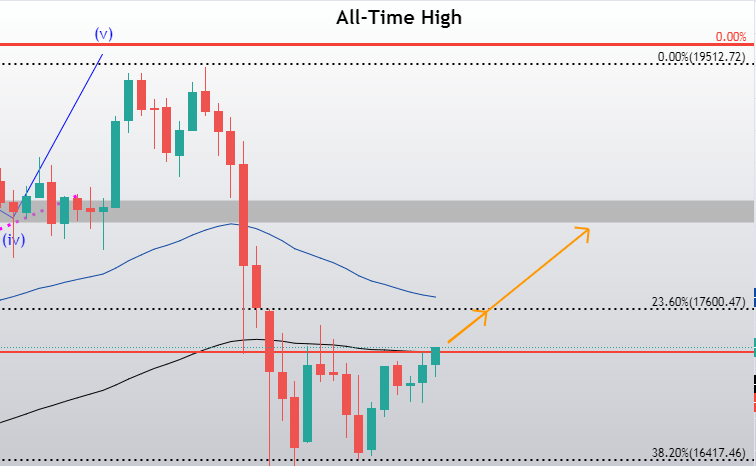
Bitcoin has continued moving up and performed exactly what we called last week (a push towards the all-time high). Once again, as expected, the push didn’t break the all-time high and has triggered a strong pullback. Bears have reached exhaustion at just over $16,000 and Bitcoin has started consolidating in a range, bound by $17,260 (both horizontal resistance and a 100-period moving average) to the upside and $16,420 to the downside.
The hash ribbons indicator still shows a buy/accumulate signal as it points out to miner capitulation.
Likely Outcomes
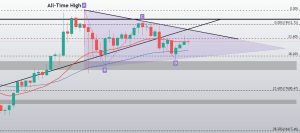
Bitcoin’s movement is a bit less obvious this week when compared to the past weeks. The cryptocurrency has a couple of scenarios it can play out as it leaves the current range-bound trading.
1: If Bitcoin breaks the range to the downside (slightly less likely), its most likely target will be $15,500. Due to the short-term bearish sentiment surrounding Bitcoin at the moment, a short trade doesn’t have to be considered as “trading against the large trend” and may actually be a good profit-making opportunity.
In this case, a clear stop-loss should be set a little above $16,420.
2: The second (just slightly more likely) scenario happens if Bitcoin manages to break the $17,260 mark. In this case, the cryptocurrency can reach many targets, but will most likely pass the $17,600 immediate resistance and push higher. The next zone of resistance after that is the $18,250-$18,450.
Trading Bitcoin’s sideways action in a current range is not advised as the price could break out of it at any time.