
The cryptocurrency sector has explosively pushed towards the upside as Bitcoin is contesting the $14,000 level yet again. The largest cryptocurrency by market cap is currently trading for $13,863, representing an increase of 3.81% on the day. Meanwhile, Ethereum gained 2.93% on the day, while XRP gained 3.67%.
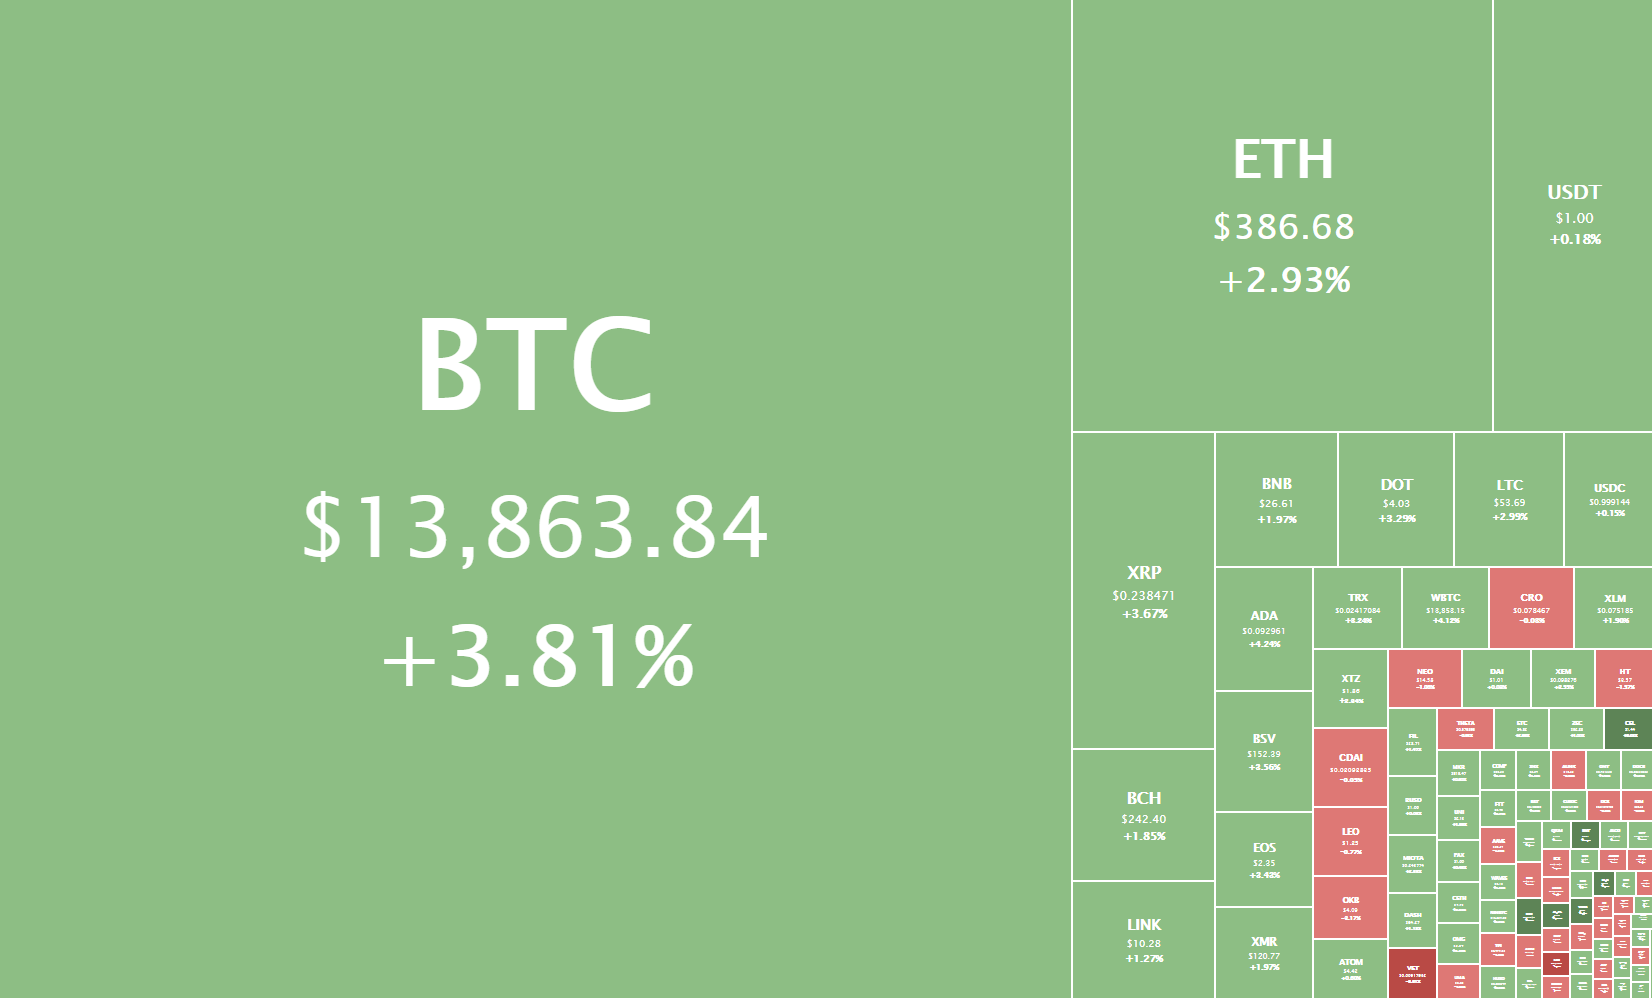
Daily Crypto Sector Heat Map
The Midas Touch Gold gained 13.90% in the past 24 hours, making it the most prominent daily gainer out of the top100 cryptos ranked by market capitalization. It is closely followed by ABBC Coin’s gain of 11.68% and Ampleforth’s 9.31% gain. On the other hand, CyberVain lost 9.64%, making it the most prominent daily loser. It is followed by NEAR Protocol’s loss of 9.57% and VeChain’s loss of 8.87%.

Top 10 24-hour Performers (Click to enlarge)
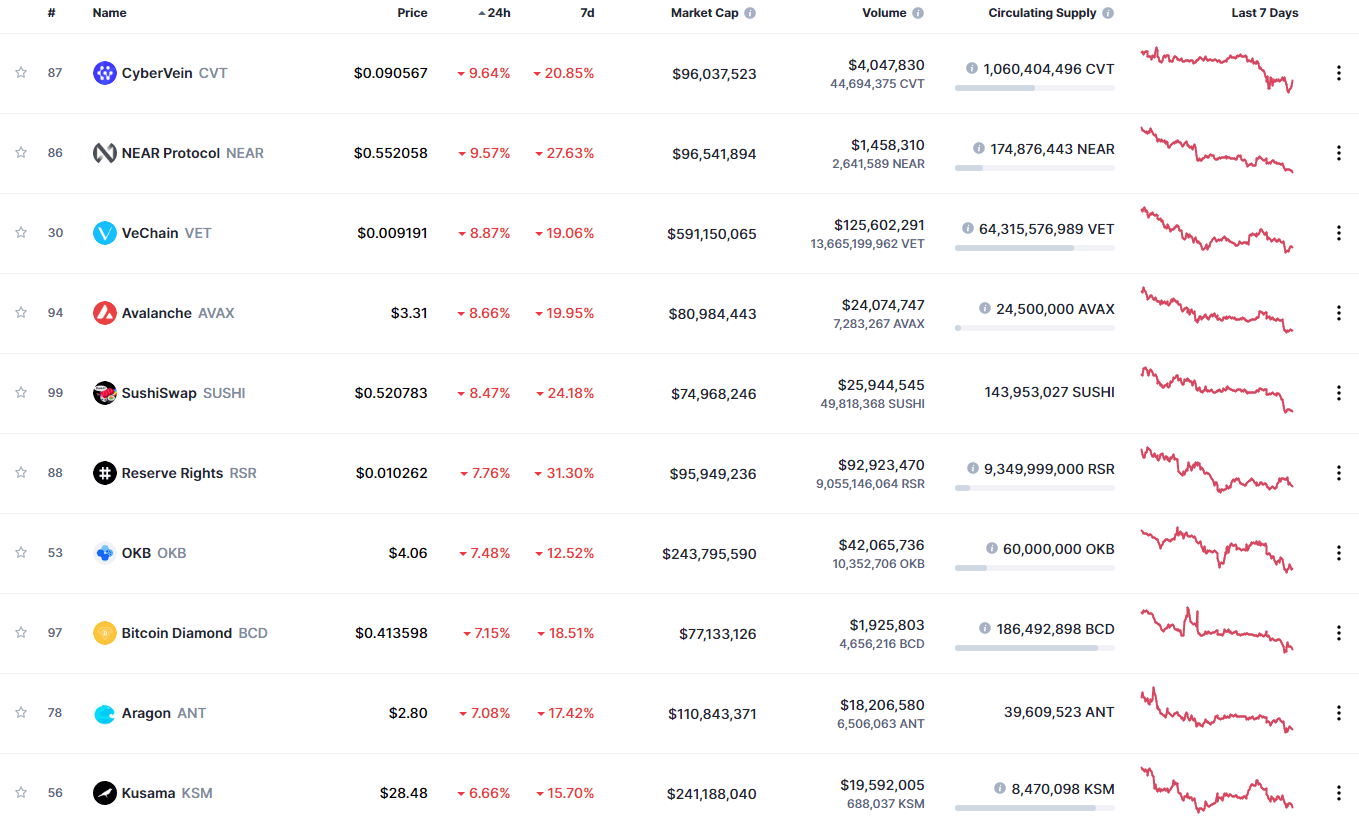
Bottom 10 24-hour Performers (Click to enlarge)
Bitcoin’s market dominance level has increased slightly since we last reported, with its value is currently staying at 64.3%. This value represents a 0.3% difference to the upside when compared to the value it had yesterday.
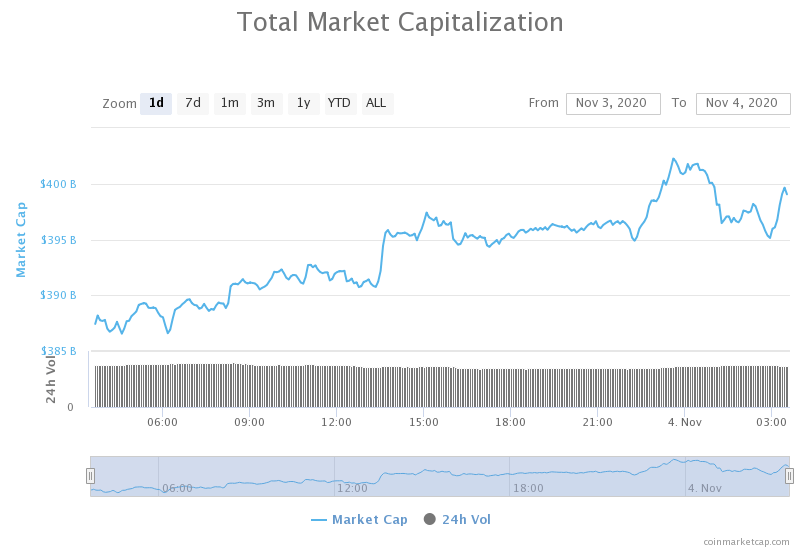
Daily Crypto Market Cap Chart
The crypto sector capitalization has increased over the course of the day. Its current value is $399.05 404.52 billion, representing a $10.79million increase when compared to our previous report.
_______________________________________________________________________
What happened in the past 24 hours?
_______________________________________________________________________
- Grayscale Trust sees largest-ever weekly inflow, nears 500K BTC in total (Cointelegraph)
- Did the Eth 2.0 deposit contract just launch? (Cointelegraph)
- Tezos’ Technicals Turn Bullish Suggesting Price Recovery in the Works (Cryptobriefing)
- Ripple Made MoneyGram Rich, But What About XRP Holders? (Cryptobriefing)
- Ethereum Fees Plummeted 65% in October Following DeFi Volumes Back to Earth (Coindesk)
- Binance could be behind over a dozen stake pools on the Cardano blockchain (Cryptoslate)
- Analyst: Here’s why Ethereum crashed 4% in a single second yesterday (Cryptoslate)
- Nearly $1 billion worth of Bitcoin from the fourth-largest wallet just moved (The Block)
- October was a great month for bitcoin options (The Block)
- U.S. 2020 election boosts use of decentralized prediction markets (The Block)
_______________________________________________________________________
Technical analysis
_______________________________________________________________________
Bitcoin
The largest cryptocurrency by market capitalization had a great day as its price moved above the $13,900 mark. While the move got stopped out near $14,000, its price is still above the level it just passed.
Due to no strong pullbacks happening at the moment and Bitcoin staying within a very narrow range ($13,000-$14,100), we can expect a strong move to either side very soon. Traders should pay attention to any attempt to break its support/resistance levels Bitcoin makes.
BTC/USD 4-hour Chart
Bitcoin’s technicals on all time-frames are bullish, with the weekly overview being the only one with a considerable amount of neutrality.
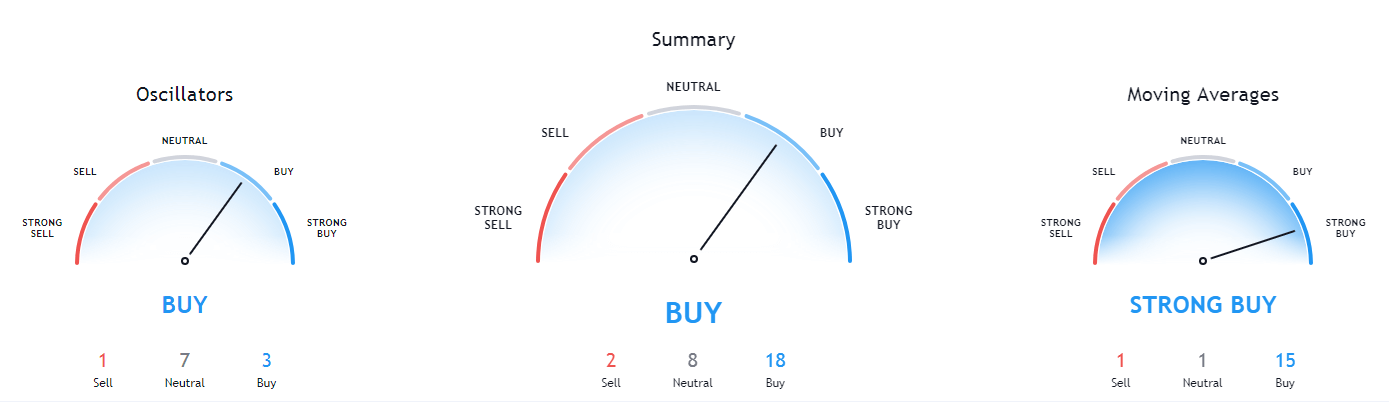
BTC/USD 1-day Technicals
Technical factors (4-hour Chart):
- Price is above both its 50-period EMA and its 21-period EMA
- Price above its middle Bollinger band
- RSI is neutral (58.89)
- Volume is average
Key levels to the upside Key levels to the downside
1: $13,900 1: $13,570
2: $14,000 2: $13,180
3: $14,100 3: $13,000
Ethereum
Ethereum has bounced off of its $371 support level and started moving back towards its ascending channel. However, the channel bottom line was too strong to pass, and Ethereum ended up consolidating slightly below it. As time passes, the possibility of Ethereum breaking the level will be diminished due to the constant increase in the line’s price position.
Ethereum is now trading in a range between $378 and the ascending channel bottom line, which can be taken advantage of. However, Bitcoin is preparing a move, and Ethereum will most likely respond to it by following its direction and intensity, which can be used by the traders.
ETH/USD 4-hour Chart
Ethereum’s short-term technicals are unclear (4-hour overview being slightly bearish while daily overview is slightly bullish), while its longer-term technicals are heavily tilted towards the buy-side.

ETH/USD 1-day Technicals
Technical Factors (4-hour Chart):
- The price is below its 50-period and at its 21-period EMA
- Price is at its middle Bollinger band
- RSI is neutral (49.02)
- Volume is average
Key levels to the upside Key levels to the downside
1: $400 1: $378
2: $415 2: $371
3: $420 3: $361
Ripple

The fourth-largest cryptocurrency by market cap took the day to push back above $0.235 and consolidate above it. This returned XRP back within a range bound by $0.235 to the downside and $0.2454 to the upside.
As we mentioned in our previous articles, if the next Bitcoin’s explosive move does not fuel XRP, traders can comfortably trade sideways action within this range. If, however, Bitcoin’s price moves to either side and XRP follows the direction, traders can use this event to trade alongside the direction XRP is moving in.
XRP/USD 4-hour Chart
XRP’s technicals on all time-frames are heavily tilted towards the sell-side. However, the longer the time-frame, the more neutral the technicals are, with the monthly indicator being very close to being completely neutral.
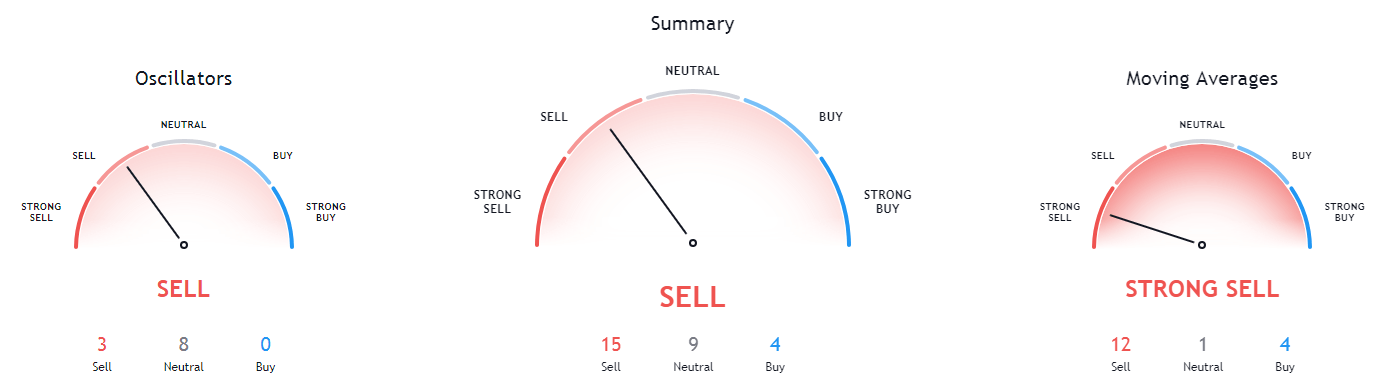
XRP/USD 1-day Technicals
Technical factors (4-hour Chart):
- The price below its 50-period EMA and above its 21-period EMA
- Price is slightly above its middle Bollinger band
- RSI is close to the oversold territory (50.52)
- Volume is slightly above average
Key levels to the upside Key levels to the downside
1: $0.2454 1: $0.235
2: $0.26 2: $0.227
3: $0.266 3: $0.221
Related posts
 Daily Crypto Review, Feb 21 – Morgan Stanley dipping its toes into crypto? Analysts still confused by the price drop
 Daily Crypto Review, July 21 – Mastercard Bullish On Bitcoin; Paxos To Become Paypal’s Bitcoin Custodian
 Daily Crypto Review, July 23 – Ethereum’s Price Skyrockets As Developers Announce Ethereum 2.0 Test Specifications
 Daily Crypto Review, July 24 – US Banks Can Provide Crypto Custody Services; Bitcoin Approaches $10,000