
The cryptocurrency market spent yet another day shooting for the upside as Bitcoin tries to push itself closer towards $10,000. Bitcoin is currently trading for $9,358, which represents an increase of 1.72% on the day. Meanwhile, Ethereum gained a whopping 8.63% on the day, while XRP gained 2.88%.

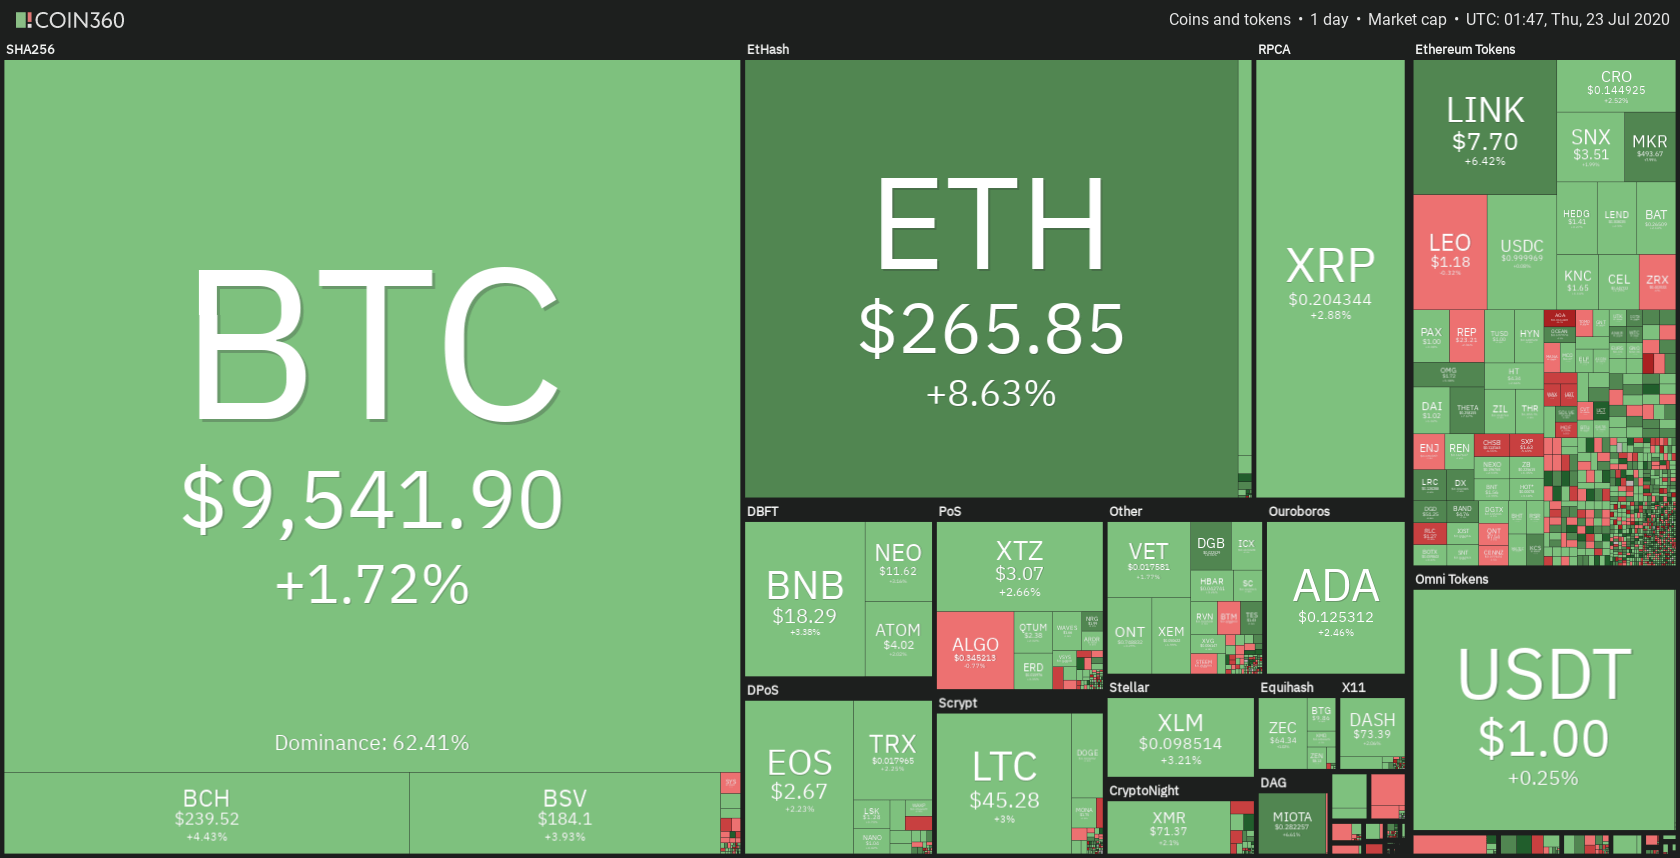
Daily Crypto Sector Heat Map
When talking about top100 cryptocurrencies, Terra gained 15.84% on the day, making it the most prominent daily gainer. DigiByte (8.29%) and Flexacoin (8.14%) also did great. On the other hand, Ampleforth has lost 30.52%, making it the most prominent daily loser. It is followed by iExec RLC’s loss of 12.26% and Velas’ loss of 7.15%.
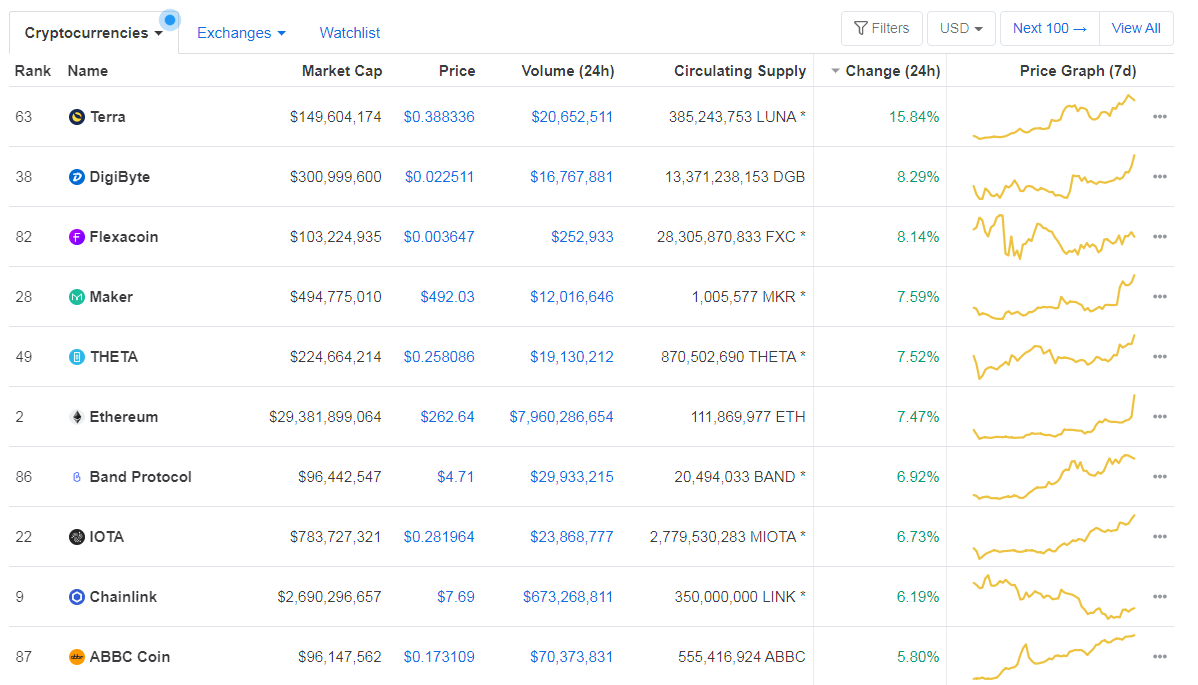
Top 10 24-hour Performers (Click to enlarge)
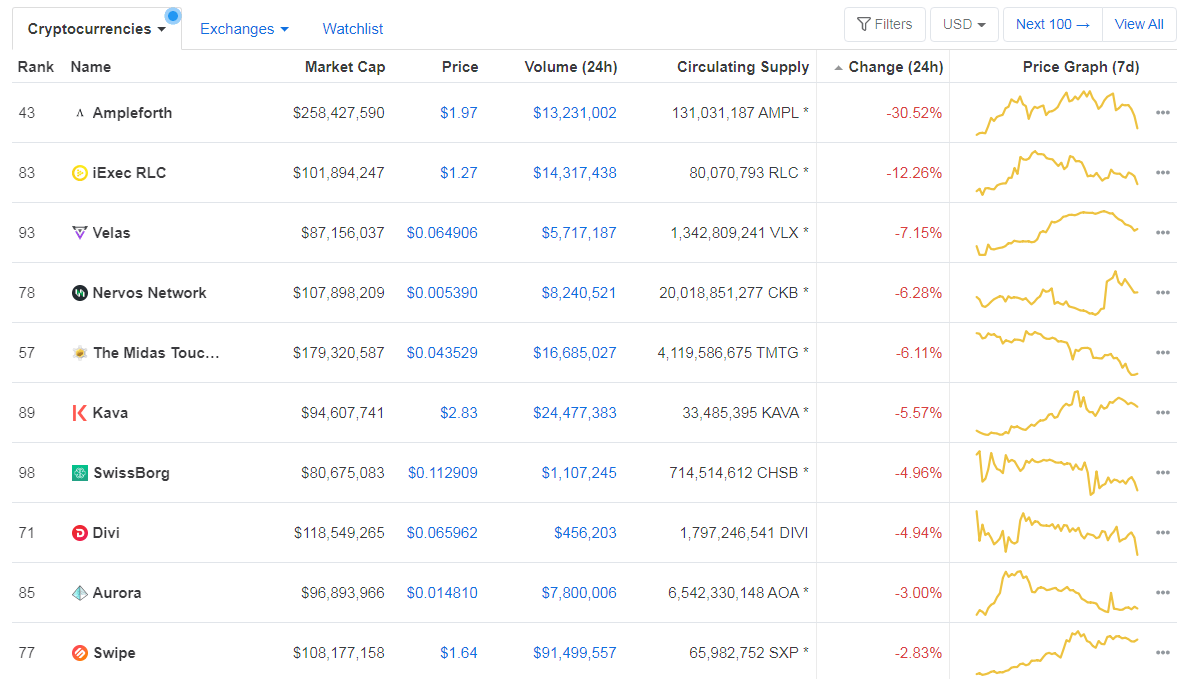
Bottom 10 24-hour Performers (Click to enlarge)
Bitcoin’s dominance level decreased slightly since we last reported, with its value currently at 62.41%. This value represents a 0.38% difference to the downside when compared to Friday’s value.
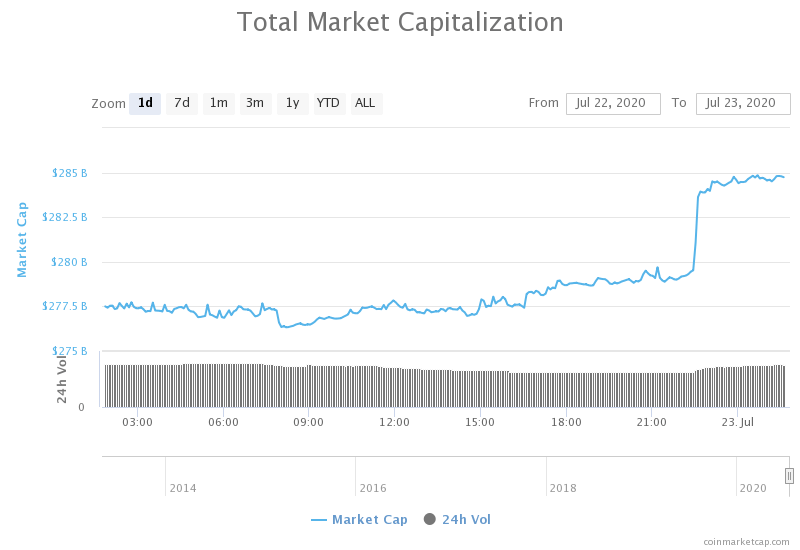
Daily Crypto Market Cap Chart
The cryptocurrency market capitalization increased when compared to when we last reported, with the market’s current value being $284.16 billion. This value represents an increase of $6.63 billion when compared to the value it had on yesterday.
_______________________________________________________________________
What happened in the past 24 hours?
_______________________________________________________________________
- Banks in US Can Now Offer Crypto Custody Services, Regulator Says (Coindesk)
- China BSN releases “first” integration plan; Chainlink, Ethereum, NEO feature (Cryptoslate)
- Ethereum Options Hit All-Time High as Investors Prepare for Volatility (Cryptobriefing)
- Is DeFi a Massive Bubble? Investors Pay a Premium for Innovative Tokens (Cryptobriefing)
- The U.K.’s first licensed crypto hedge fund is shutting down (The Block)
- Japan’s Covid-19 Stimulus Payments Didn’t Flow Into Crypto (Cointelegraph)
- The Logbook: Blockchain is still innovation theater for some of the biggest public companies in the U.S. (The Block)
- An emerging consensus on the U.S. dollar: Figure out how to fix it now in case it breaks later (The Block)
- Tyler Winklevoss: It’s Good For BTC When The Fed Prints Money (Cointelegraph)
- U.S. House adds two blockchain amendments to its annual defense spending bill (The Block)
_______________________________________________________________________
Technical analysis
_______________________________________________________________________
Bitcoin
The largest cryptocurrency by market capitalization had another green day where it continued strides towards $9,580, and ultimately $10,000. While the price did reach the $9,580 resistance level, it could not pass it for the time being. However, there is still a chance Bitcoin will pas (and confirm) the $9,580 level in this run, even though the overbought RSI says otherwise.
BTC traders should look for a trade opportunity after bitcoin loses bull presence or after it passes $9,580.
BTC/USD 4-hour Chart
Technical factors:
- Price is above its 50-period EMA and its 21-period EMA
- Price at its top B.B.
- RSI is in the overbought territory (74.80)
- Increased Volume
Key levels to the upside Key levels to the downside
1: $9,580 1: $9,251
2: $9,735 2: $9,120
3: $9,870 3: $8,980
Ethereum
Ethereum skyrocketed today, gaining over 8% in the past 24 hours. The reason for the sudden increase in Volume (and price) is contributed to the growing DeFi field. This price is the highest Ethereum has been since February. Ethereum’s price rise got stopped by the ascending resistance level, but only for a short amount of time.
Ethereum traders should look for an opportunity in searching for pullbacks.
ETH/USD 4-hour Chart
Technical Factors:
- Price is above the 50-period EMA and the 21-period EMA
- Price above the top B.B.
- RSI severely overbought (85.65)
- One candle volume spike (rest is average)
Key levels to the upside Key levels to the downside
1: $278 1: $260
2: $289 2: $251.4
3: $302 3: $240
Ripple
The third-largest cryptocurrency by market cap did well as well, with its price finally passing the $0.2 threshold after being stuck below it for almost a month. The move is currently stuck at the $0.205 resistance level, as XRP didn’t decide whether it will consolidate above or below it.
XRP traders can look for an opportunity to trade after XRP “decides” if it will end up above or below $0.205.
XRP/USD 4-hour Chart
Technical factors:
- XRP in a mid-term descending trend (though it broke the trend in the short-term)
- XRP lacks strong support levels below $0.178
- Price above 21-period and the 50-period EMA
- Price above the top B.B.
- RSI is elevated (65.78)
- Average/slightly higher than average Volume
Key levels to the upside Key levels to the downside
1: $0.205 1: $0.2
2: $0.214 2: $0.19
3: $$0.227 3: $0.178
Related posts
 Daily Crypto Review, August 7 – Goldman Sachs Launching its Own Stablecoin; DeFi Platforms Traffic Surging
 Daily Crypto Review, Nov 5 – Bitcoin Finally Above $14,000 as the Bull Run Continues; Ethereum 2.0 Contract Release Live
 Daily Crypto Review, Dec 4 – Bitcoin Above $19,000; Ether Fighting for $600
 Daily Crypto Review, Dec 14 – BTC and ETH Consolidating After A Bull Rally; XRP Left in the Dust