
The cryptocurrency sector has explosively pushed towards the upside as Bitcoin broke the $14,316 and entered the territory explored only during the 2017/2018 bull run and last seen in July 2018. The largest cryptocurrency by market cap is currently trading for $14,316, representing an increase of 5.54% on the day. Meanwhile, Ethereum gained 4.78% on the day, while XRP gained 0.67%.
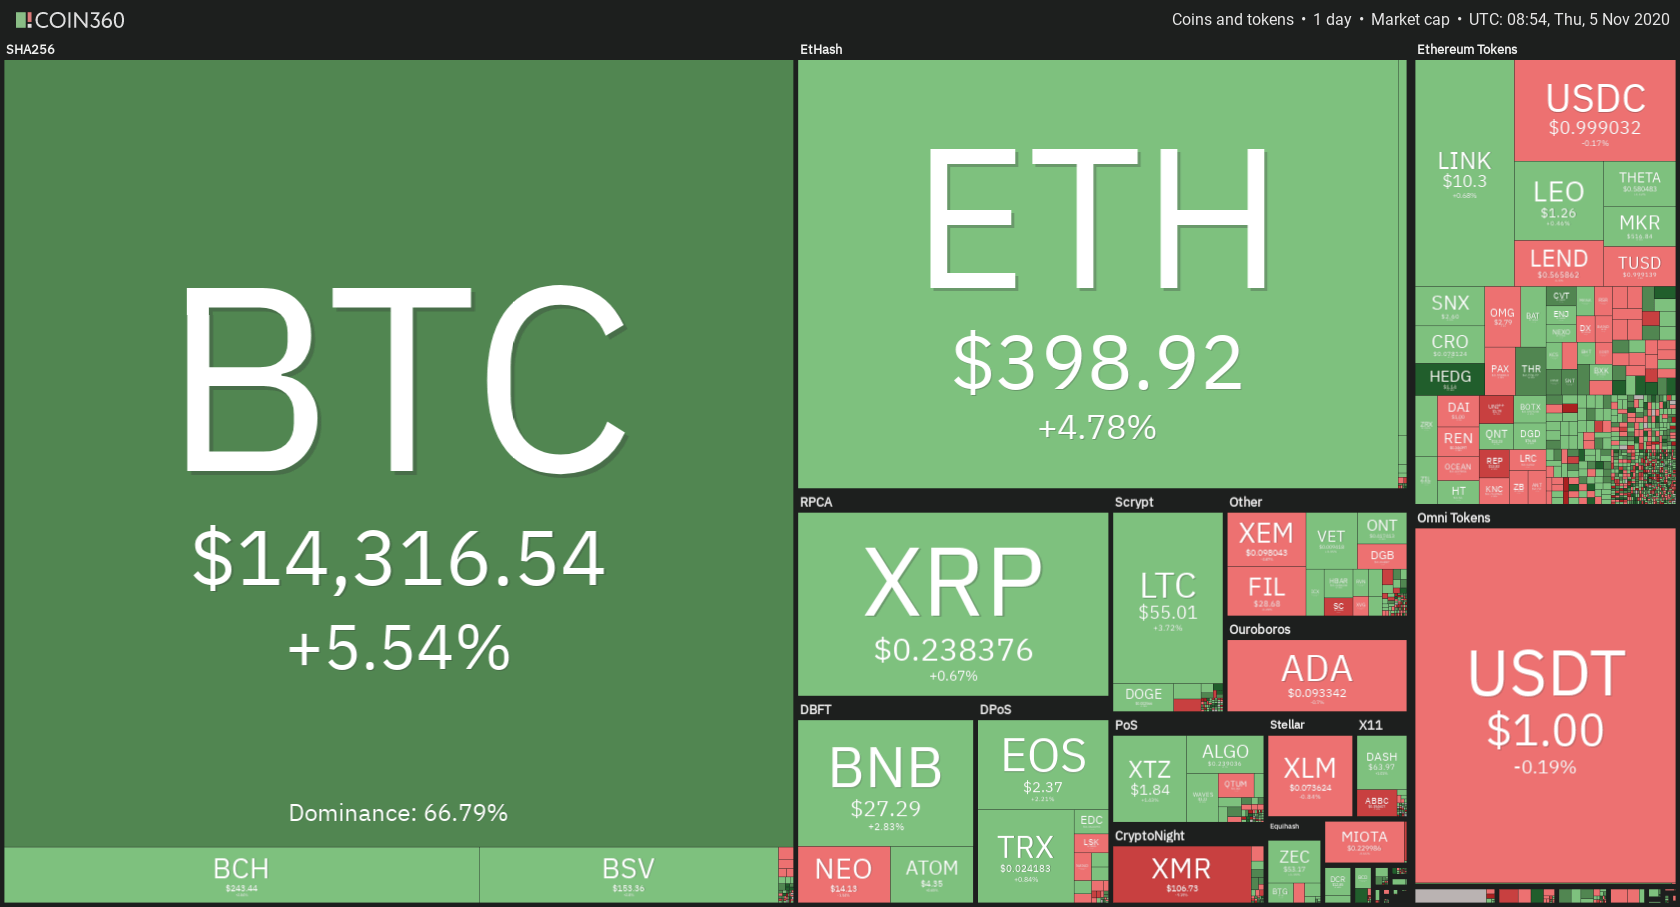
Daily Crypto Sector Heat Map
HedgeTrade gained 38.24% in the past 24 hours, making it the most prominent daily gainer out of the top100 cryptos ranked by market capitalization. It is closely followed by Celsius’ gain of 9.37% and CyberVain’s 7.78% gain. On the other hand, Uniswap lost 16.95%, making it the most prominent daily loser. It is followed by yearn.finance’s loss of 16.73% and ABBC Coin’s loss of 9.35%.
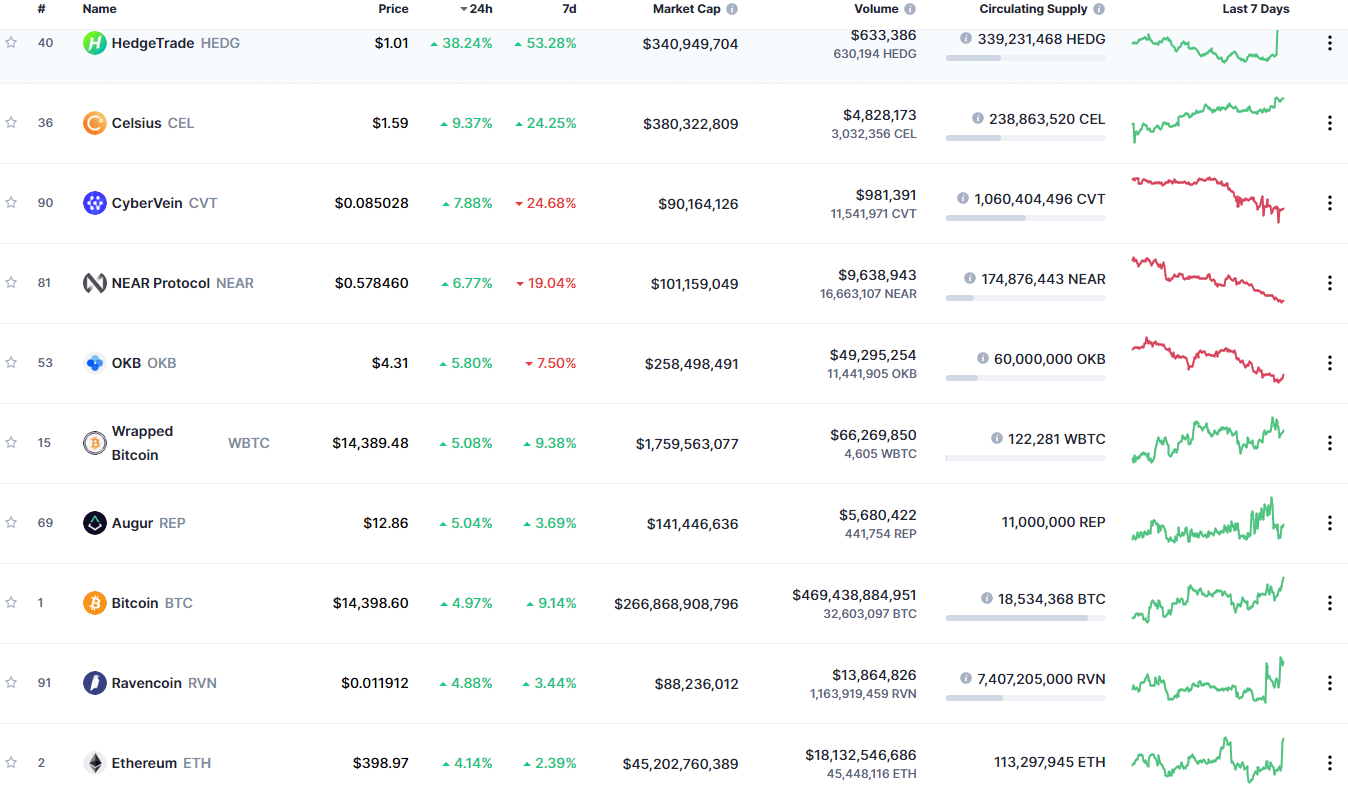
Top 10 24-hour Performers (Click to enlarge)

Bottom 10 24-hour Performers (Click to enlarge)
Bitcoin’s market dominance level has increased slightly since we last reported, with its value is currently staying at 64.9%. This value represents a 0.6% difference to the upside when compared to the value it had yesterday.
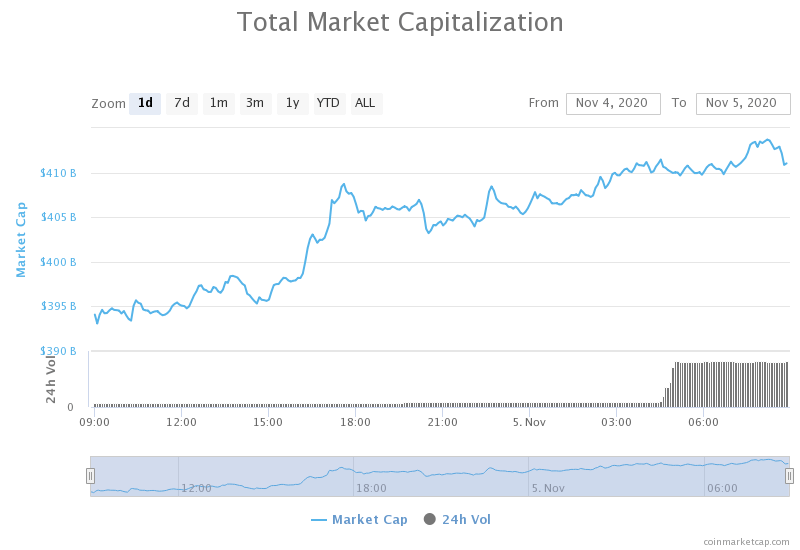
Daily Crypto Market Cap Chart
The crypto sector capitalization has increased over the course of the day. Its current value is $412.17 billion, representing a $7.35 billion increase when compared to our previous report.
_______________________________________________________________________
What happened in the past 24 hours?
_______________________________________________________________________
- Ahead of Election Night, the number of large reportable CME bitcoin futures traders hit an all-time high (The Block)
- Raoul Pal explains why he isn’t surprised by bitcoin’s correlation to stocks (The Block)
- No matter who wins the US election, Bitcoin will likely rally: historical data (Cryptoslate)
- Crypto fund manager warns Ethereum DeFi crash isn’t done, even after 75% drop (Cryptoslate)
- Ethereum price surges past $400 on news of ETH 2.0 contract release (Cryptoslate)
- PredictIt Users Threaten Lawsuit Following Disastrous Election Night Crash (Cryptobriefing)
- Telegram Ordered to Pay $620,000 in Copyright Lawsuit (Cryptobriefing)
- Leverage is fueling Bitcoin’s rally to highest price since January 2018 (Cointelegraph)
- Trezor’s failure to support upcoming BCH fork comes under fire (Cointelegraph)
- Bitcoin Is Good for PayPal, but Is PayPal Good for Bitcoin? (Coindesk)
_______________________________________________________________________
Technical analysis
_______________________________________________________________________
Bitcoin
The largest cryptocurrency by market capitalization had finally broken the $13,900 resistance with confidence and confirmed its position above it. Not only that, but it has entered the price level last seen in July 2018. This means that there will be a lot of uncertainty and unset support and resistance levels, and also a lot of random volatility due to various entities taking profit and new investors FOMOing in.
However, a couple of potential resistance levels have formed, one of them being at $14,640. Traders should pay close attention to this level as well as use Fib retracements to create possible targets when trading.
BTC/USD 1-hour Chart
Bitcoin’s technicals on showing a strong buy at all time-frames. No neutrality is being shown as Bitcoin is currently in an extremely favorable place price-wise.
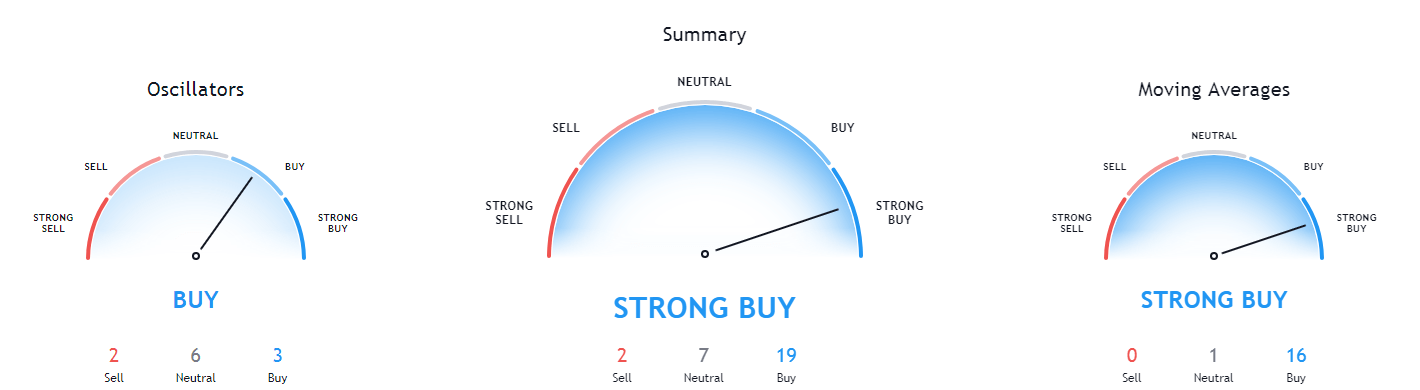
BTC/USD 1-day Technicals
Technical factors (4-hour Chart):
- Price is above both its 50-period EMA and its 21-period EMA
- Price is slightly below its top Bollinger band
- RSI is coming out of the overbought zone (69.10)
- Volume is average
Key levels to the upside Key levels to the downside
1: $14,640 1: $14,100
2: $16,665 2: $13,900
3: $17,260 3: $13,570
Ethereum

Bitcoin’s push towards the upside has fueled Ethereum, and the hype surrounding its version 2.0 launch, managed to surge above the ascending channel bottom line and re-enter the channel once again. The second-largest cryptocurrency by market cap reached as high as $409 before pulling back. It is now consolidating at slightly below $400.
If we don’t see any explosive moves from BTC and ETH in the short term, we can expect Ethereum to pull back slightly more and test the ascending channel’s bottom line as support. Traders can wait for the results of the “test” and trade off of that.
ETH/USD 4-hour Chart
Ethereum’s technicals on all time-frames are tilted towards the buy-side. However, its shorter time-frames (4-hour and daily) are showing hints of neutrality, while its longer time-frames are completely bullish.
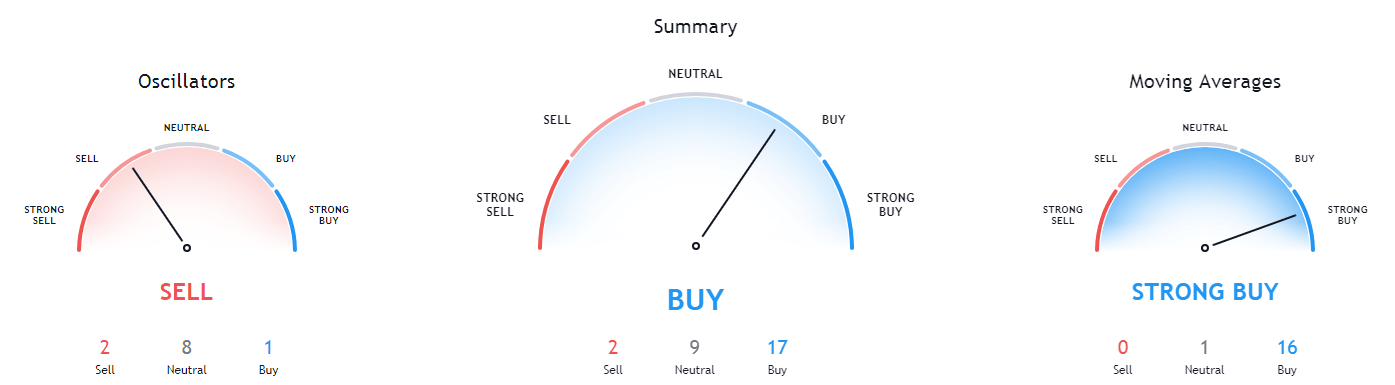
ETH/USD 1-day Technicals
Technical Factors (4-hour Chart):
- The price is above both its 50-period and its 21-period EMA
- Price is between its middle and top Bollinger band
- RSI is neutral (57.63)
- Volume is average
Key levels to the upside Key levels to the downside
1: $400 1: $378
2: $415 2: $371
3: $420 3: $361
Ripple

The fourth-largest cryptocurrency by market cap hardly even moved in the past 24 hours despite the rest of the crypto market booming. As we mentioned in our previous article, if Bitcoin’s next explosive move doesn’t fuel XRP, it will move within a range bound by $0.235 and $0.2454, exactly what happened.
XRP seems to be creating a triangle formation on its 4-hour chart. If that is the case, it is bound to move above or below it extremely soon. However, the move will most likely be stopped at its immediate support or resistance level.
XRP/USD 4-hour Chart
XRP’s technicals have improved slightly, as they were extremely bearish the last time we reported. While its daily overview is still heavily tilted towards the sell-side, its weekly and monthly overviews are almost neutral (though still slightly tilted towards the bear side), and its 4-hour time-frame is even showing some bullishness.

XRP/USD 1-day Technicals
Technical factors (4-hour Chart):
- The price is below its 50-period EMA and at its 21-period EMA
- Price at its middle Bollinger band
- RSI is neutral (48.73)
- Volume is average
Key levels to the upside Key levels to the downside
1: $0.2454 1: $0.235
2: $0.26 2: $0.227
3: $0.266 3: $0.221
Related posts
 Daily Crypto Review, Oct 14 – Analysts Calling for a Bull Market; Bitcoin Back Under $11,500
 Daily Crypto Review, Nov 10 – Bitcoin Miners Migrated: BTC Hash Rate Up 42%
 Daily Crypto Review, Nov 30 – Ethereum Soars on Great Fundamentals; Bitcoin Bulls Back in the Game
 Daily Crypto Review, Dec 3 – PayPal and BlackRock Heads Extremely Bullish on Bitcoin; Crypto Sector Consolidating