
The cryptocurrency sector has spent the day mostly consolidating and preparing for the next move and setting up technical formations. The largest cryptocurrency by market cap is currently trading for $15,288, representing a decrease of 1.14% on the day. Meanwhile, Ethereum lost 1.70% on the day, while XRP lost 0.8%.
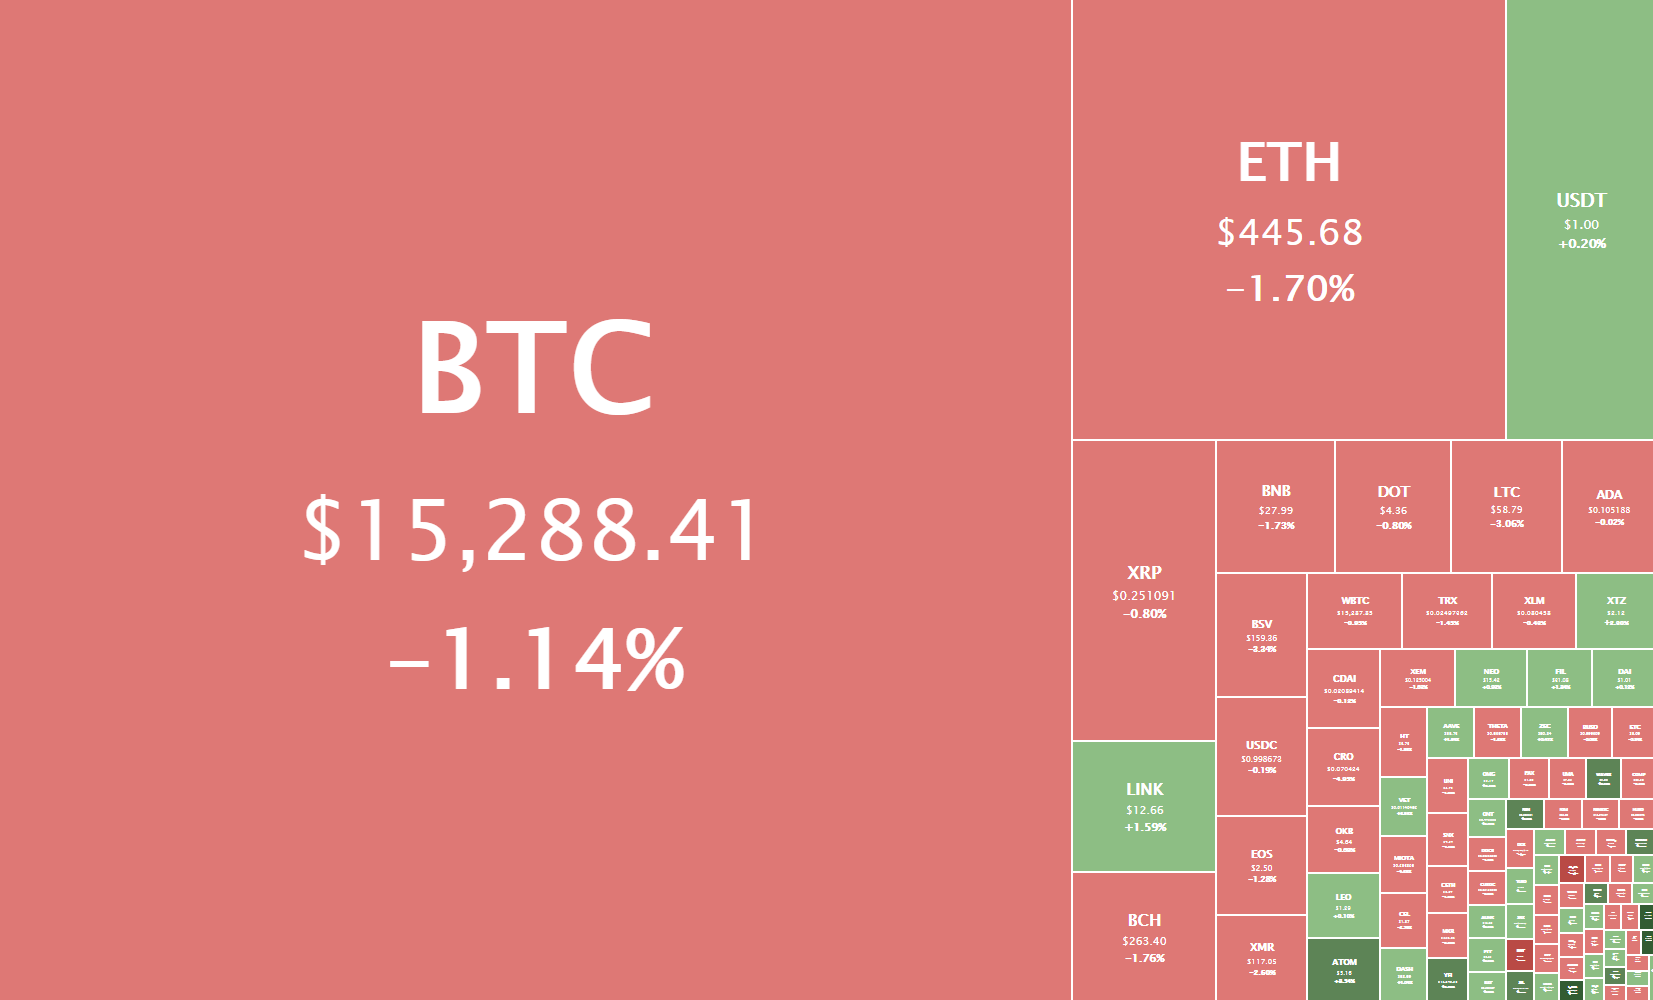
Daily Crypto Sector Heat Map
Civic gained an astonishing 101.35% in the past 24 hours, making it the most prominent daily gainer out of the top100 cryptos ranked by market capitalization. It is closely followed by Golem’s gain of 29.25% and Decentraland’s 22.26% gain. On the other hand, Loopring lost 9.76%, making it the most prominent daily loser. Synthetix lost 7.39% while Energy Web Token lost 7.35%, making them the 2nd and 3rd most prominent daily losers.
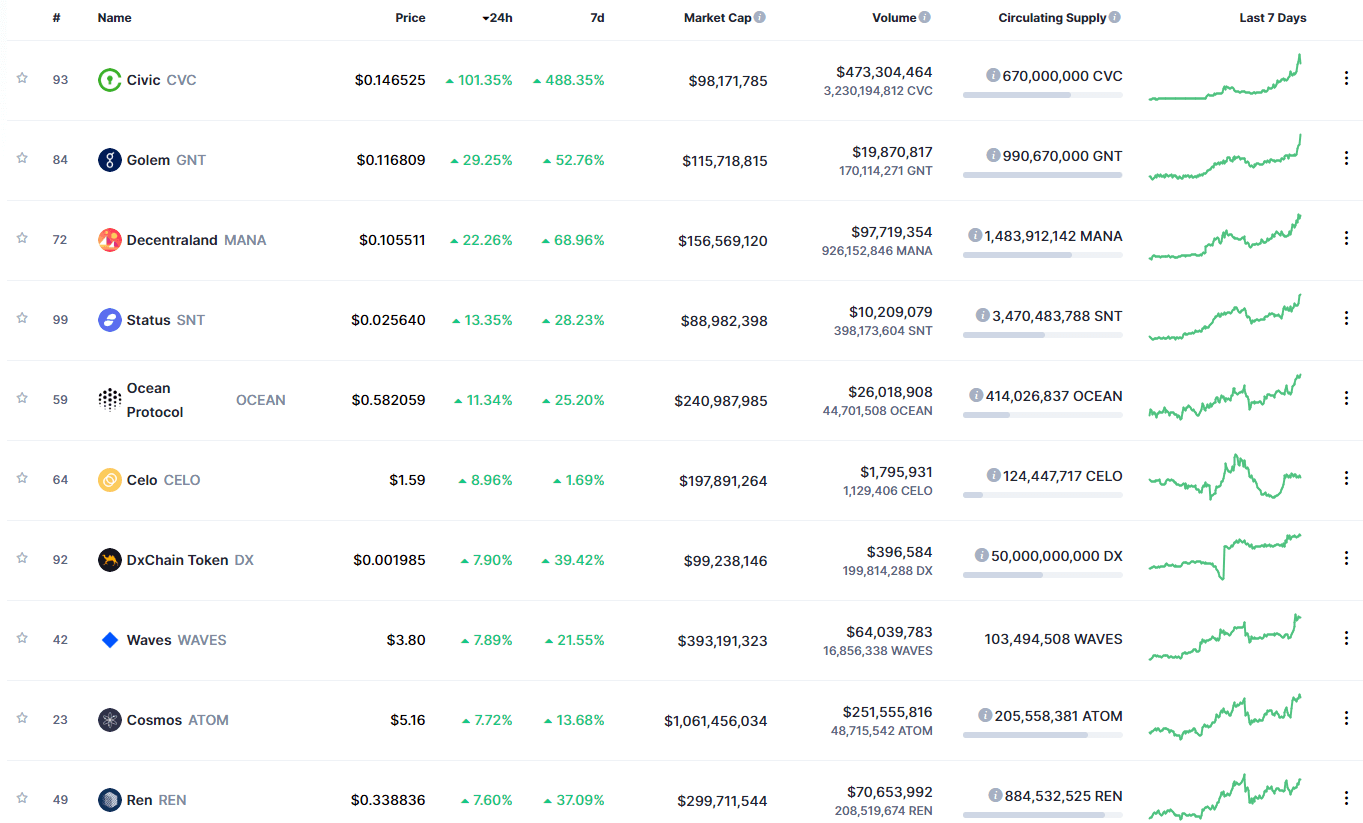
Top 10 24-hour Performers (Click to enlarge)
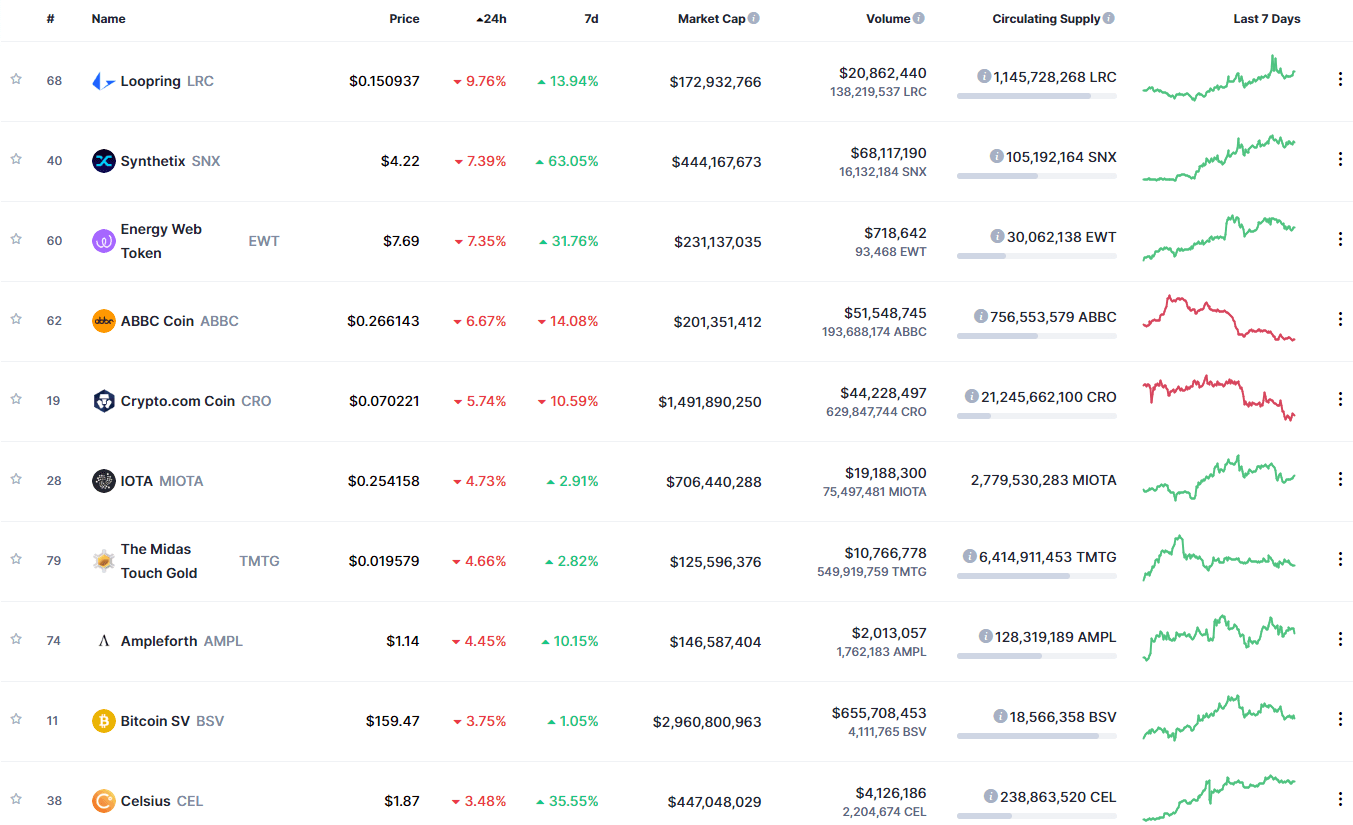
Bottom 10 24-hour Performers (Click to enlarge)
Bitcoin’s market dominance has decreased slightly since we last reported, with its value is currently staying at 64.2%. This value represents a 0.1% difference to the downside compared to the value it had yesterday.

Daily Crypto Market Cap Chart
The crypto sector capitalization has gone down slightly over the course of the day. Its current value is $441.50 billion, representing a $4.29 billion decrease compared to our previous report.
_______________________________________________________________________
What happened in the past 24 hours?
_______________________________________________________________________
- Big mining move: Bitcoin’s hash power increases by 42% in two days (Cointelegraph)
- SEC Commissioner Peirce Says Regulations Should Be Slow, Though Crypto Rules Could Be Faster (Coindesk)
- What’s the deal with DeFi “blue chips”? SNX, AAVE, YFI surge 100 percent off lows (Cryptoslate)
- Crypto “bank” Cred files for bankruptcy after alleged multimillion fraud case (Cryptoslate)
- 1.1m XRP stolen in phishing scam on crypto wallet Ledger lookalike (Cryptoslate)
- Billionaire Hedge Fund Manager Stan Druckenmiller Buys Bitcoin (Cryptobriefing)
- Addresses Holding 32 ETH Hits All-Time High Ahead of Ethereum 2.0 Launch (Cryptobriefing)
- Bitcoin SV Exploit Results in Widespread Theft (Cryptobriefing)
- Binance has begun to block U.S. users from accessing its exchange platform (The Block)
- Gold and bitcoin tumble while equities swing upward on COVID-19 vaccine news (The Block)
The past 24 hours were characterized by a slow price movement of the crypto sector. However, a lot of important news reached the public’s eye. Bitcoin Miners finished up on Sichuan’s migration, triggering a hash rate spike of 42% in the past 2 days. Ethereum has been performing great, and news of its 2.0 version is all over the place, with the most recent one being that the number of addresses surpassing 32 ETH (the amount required to be a validator) is at an all-time high. On the other hand, Bitcoin SV brought bad news to the sector, as its multi-sig feature got compromised, causing enormous losses for its users.
_______________________________________________________________________
Technical analysis
_______________________________________________________________________
Bitcoin

The largest cryptocurrency by market capitalization is trading in a very uncertain zone at the moment. Its price has most likely created a double top formation, indicating a possible pullback in the short-term. This prediction is even more convincing as we can see that Bitcoin can’t get past the $15,480 resistance after trying for over 12 hours. However, the overall sentiment around the cryptocurrency is extremely bullish, and its downside is protected by the ascending (yellow) line.
With that being said, traders should wait for Bitcoin to choose its direction and trade only if Bitcoin spikes above $15,480 or below $15,420 with significant volume.
BTC/USD 4-hour Chart
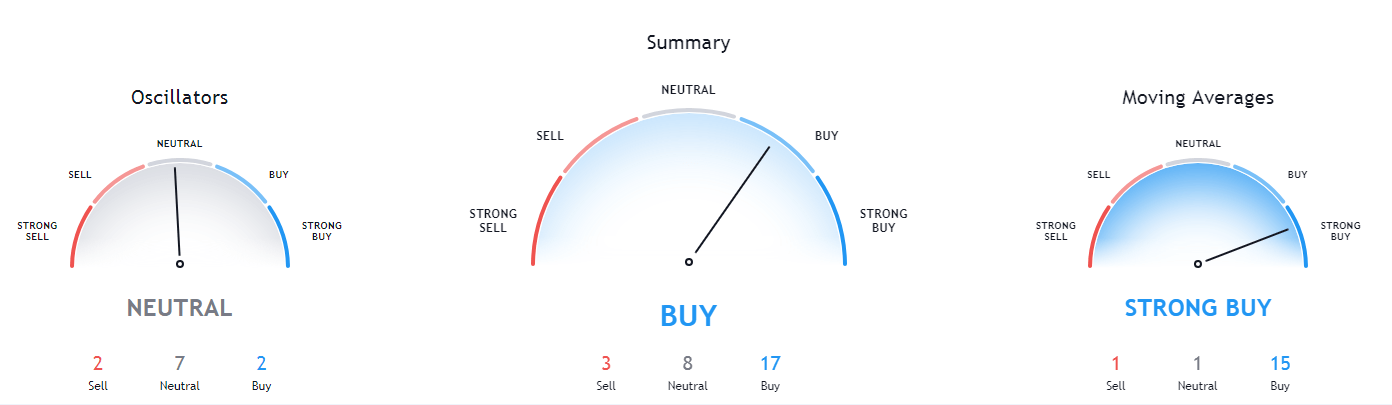
Bitcoin’s technicals are bullish on all time-frames. The only difference compared to yesterday was that every single time-frame is completely bullish and with almost no neutrality present (as opposed to yesterday, when neutral sentiment could be seen on some overviews).
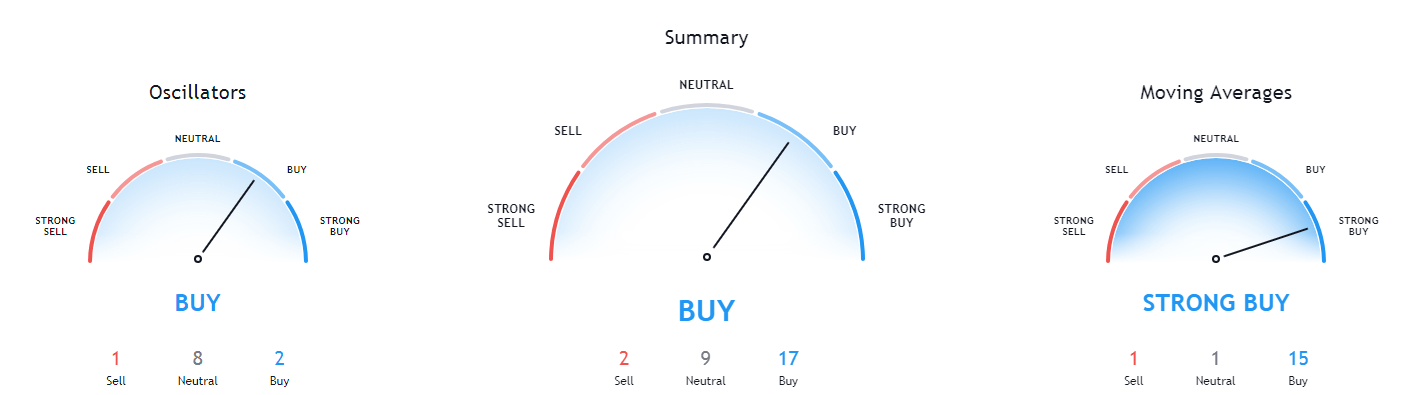
BTC/USD 1-day Technicals
Technical factors (4-hour Chart):
- Price is above its 50-period EMA and right at its 21-period EMA
- Price is at its middle Bollinger band
- RSI is neutral (53.60)
- Volume is average
Key levels to the upside Key levels to the downside
1: $16,400 1: $15,480
2: $16,665 2: $14,640
3: $17,260 3: $14,100
Ethereum
Ethereum has been playing around the upper line of the ascending channel (yellow dotted line) and constantly going above and under it. At the moment, its price is under the line, and any attempts of getting past it have been extinguished quickly. This most likely means that Ethereum failed to establish itself above the $451 level, which could trigger a correction towards the 50-period moving average, and ultimately the bottom channel line.
Traders should pay close attention to volume, as they will not have a lot of time to join in on the trade towards the downside. Placing a stop-loss right above the ascending channel top line should be a “safe bet.”
ETH/USD 4-hour Chart
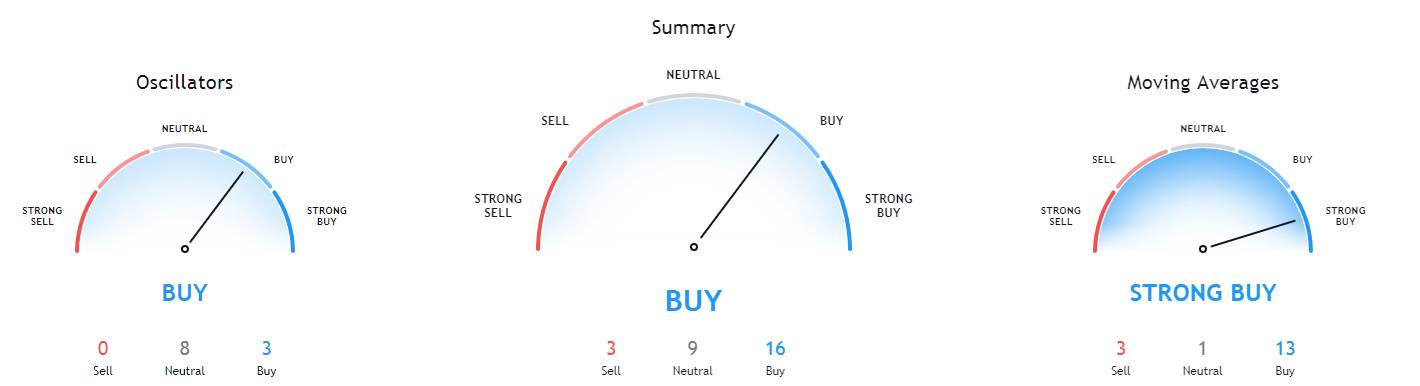
Ethereum’s technicals are tilted heavily towards the buy-side on its 4-hour and monthly overview, while the neutral sentiment is heavily present on its daily and weekly charts.
ETH/USD 1-day Technicals
Technical Factors (4-hour Chart):
- The price is above its 50-period and slightly above its 21-period EMA
- Price is at its middle Bollinger band
- RSI is neutral (55.58)
- Volume is slightly elevated
Key levels to the upside Key levels to the downside
1: $451 1: $445
2: $470 2: $420
3: $490 3: $415
Ripple

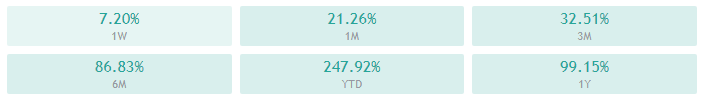
The fourth-largest cryptocurrency by market cap continued its consolidation phase right above the $0.2454 level, which is considered a major pivot point in XRP’s trading in the recent past. XRP created a double bottom at this level, possibly indicating a push towards the $0.26 in the short term.
Traders should still be safe to assume that XRP will trade within the range and that they can trade the sideways action. However, if the volume increases drastically, a move towards the upside is much more likely (if not fueled by Bitcoin’s move).
XRP/USD 4-hour Chart
XRP’s technicals on the 4-hour, daily, and weekly time-frame are all tilted towards the buy-side. However, neutral sentiment can be seen in all of them. On the other hand, its monthly overview also has the same neutrality amount but is tilted towards the sell-side.
XRP/USD 1-day Technicals
Technical factors (4-hour Chart):
- The price slightly above its 50-period EMA and at its 21-period EMA
- Price is slightly below its middle Bollinger band
- RSI is neutral (49.69)
- Volume is average
Key levels to the upside Key levels to the downside
1: $0.26 1: $0.2454
2: $0.266 2: $0.235
3: $0.27 3: $0.227
Related posts
 Daily Crypto Review, May 15 – Bitcoin Rejected from $10,000 – What’s Next?
 Daily Crypto Review, Jun 03 – Large BTC Miner Capitulation Causing The Price Drop? BTC Under $10,000 Again
 Daily Crypto Review, Nov 30 – Ethereum Soars on Great Fundamentals; Bitcoin Bulls Back in the Game
 Daily Crypto Review, Dec 3 – PayPal and BlackRock Heads Extremely Bullish on Bitcoin; Crypto Sector Consolidating