
The cryptocurrency market ended up mostly in the green, with Bitcoin continuing its path towards $12,000. Bitcoin is currently trading for $11,831, which represents an increase of 1.34% on the day. Meanwhile, Ethereum lost 0.18% on the day, while XRP gained 1.4%.

Daily Crypto Sector Heat Map
When talking about top100 cryptocurrencies, Balancer gained 23.90% on the day, making it the most prominent daily gainer. Aave (20.29%) and Decentraland (15.99%) also did great. On the other hand, Aurora lost 12.10%, making it the most prominent daily loser. It is followed by Ampleforth’s loss of 7.98% and The Midas Touch’s loss of 5.50%.
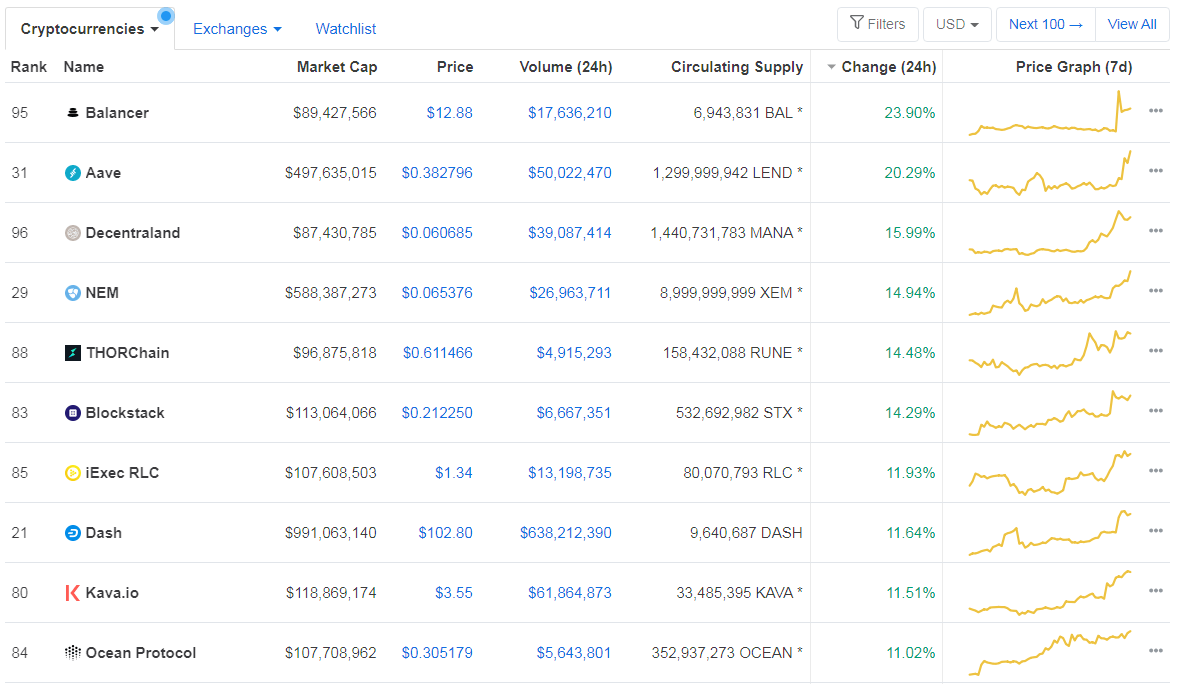
Top 10 24-hour Performers (Click to enlarge)

Bottom 10 24-hour Performers (Click to enlarge)
Bitcoin’s dominance level has increased slightly since we last reported, with its value currently at 61.50%. This value represents a 0.02% difference to the upside when compared to yesterday’s value.
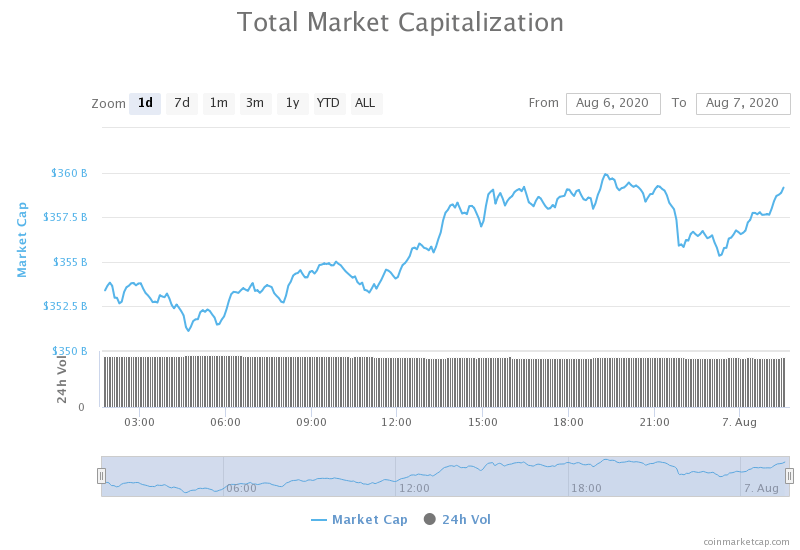
Daily Crypto Market Cap Chart
The cryptocurrency market capitalization has increased since we last reported. Its current value is $358.90 billion, which represents an increase of $5.42 billion when compared to the value it had yesterday.
_______________________________________________________________________
What happened in the past 24 hours?
_______________________________________________________________________
- Russia’s largest state-owned bank plans to launch a stablecoin this year (The Block)
- Popular DeFi platforms are seeing a surge in Web traffic (The Block)
- U.S. Senate confirms crypto-friendly SEC commissioner Hester Peirce for second term in office (The Block)
- Another Multi-Billion Dollar Company Turns to Bitcoin as a Dollar Hedge (Cryptobriefing)
- Goldman Sachs Wants to Launch Its Own Cryptocurrency Stablecoin (Cryptobriefing)
- Americans are “pouring” cash, stimulus checks into Bitcoin and gold (Cryptoslate)
- Bitcoin’s Patronage System Is an Unheralded Strength (Coindesk)
- Record $830M CME Bitcoin Futures Open Interest Highlights Bullish Trend (Cointelegraph)
- Raoul Pal: ‘It May Not Be Worth Owning Any Asset Other Than Bitcoin’ (Cointelegraph)
- Pantera’s Founder Foresees $100K+ Bitcoin On the Horizon (Cointelegraph)
_______________________________________________________________________
Technical analysis
_______________________________________________________________________
Bitcoin
The largest cryptocurrency by market capitalization kept increasing in price slowly throughout the day as sentiment turned even more bullish. However, the path towards $12,000 will not be easy, as the sell wall at the resistance is not small. On the other hand, if Bitcoin fails to break $12,000, it will create a double top and most likely fall down towards $11,630 and then $11,460 as well.
BTC traders should look for an opportunity to make a trade when BTC breaks $12,000 or fails to break it.
BTC/USD 4-hour Chart
Technical factors:
- Price is currently above its 50-period EMA, as well as its 21-period EMA
- Price is near its top B.B.
- RSI is elevated (65.50)
- Volume elevated (stable)
Key levels to the upside Key levels to the downside
1: $11,630 1: $11,460
2: $12,000 2: $11,090
3: $10,855
Ethereum
Ethereum spent the day flattening out its movement and mostly trading sideways. The second-largest cryptocurrency by market capitalization stayed below the $400 mark and couldn’t get past it. However, with volume dying down and such low volatility, we may expect an attempt to break the $400 (and then $415) level soon.
Traders should look for a trade opportunity when Ethereum increases its volume.
ETH/USD 4-hour Chart
Technical Factors:
- Price is above its 21-period EMA and its 50-period EMA
- Price is slightly above its middle B.B. (20-period SMA)
- RSI is elevated (58.42)
- Descending volume
Key levels to the upside Key levels to the downside
1: $400 1: $362
2: $415 2: $340
3: $496 3: $302
Ripple
XRP broke out from its triangle formation to the upside, but couldn’t reach past $0.31 mark. However, the pullback from a failed move didn’t discredit XRP’s break from the triangle formation, as the cryptocurrency managed to stay above the triangle. With the confirmed break, traders can expect XRP to either stay near $0.31 or push above it in the short-term unless some other catalyst sparks a movement to the downside.
Traders can look for an opportunity to trade when XRP breaks $0.31.
XRP/USD 4-hour Chart
Technical factors:
- Price is above its 21-period and 50-period EMA
- Price is below its middle B.B. (20-period SMA)
- RSI is neutral (55.99)
- Low volume
Key levels to the upside Key levels to the downside
1: $0.31 1: $0.285
2: $0.32 2: $0.266
3: $0.3328 3: $0.245
Related posts
 Daily Crypto Review, Sept 15 – BTC Heading Towards $11,000; ETH Facing a 35% Drop?
 Daily Crypto Review, Oct 2 – Trump Tests Positive for COVID-19; Crypto and Stocks Negatively Affected
 Daily Crypto Review, Oct 6 – XRP Gains Over 10% As It Announces The Launch Of A New Crypto Exchange
 Daily Crypto Review, Oct 28 – Bitcoin Rushing Towards $14,000; Over 50% of US Investors Interested in Crypto
One reply on “Daily Crypto Review, August 7 – Goldman Sachs Launching its Own Stablecoin; DeFi Platforms Traffic Surging”
Goldman Sachs getting in on the act. Very interesting!