
The cryptocurrency sector has spent the day trying to regain its recent highs, with Ethereum breaking $600 and Bitcoin breaking $19,000. Bitcoin is currently trading for $19,314, representing an increase of 1.14% compared to our last report. Meanwhile, Ethereum’s price has increased by 2.15% on the day, while XRP managed to lose 0.52%.

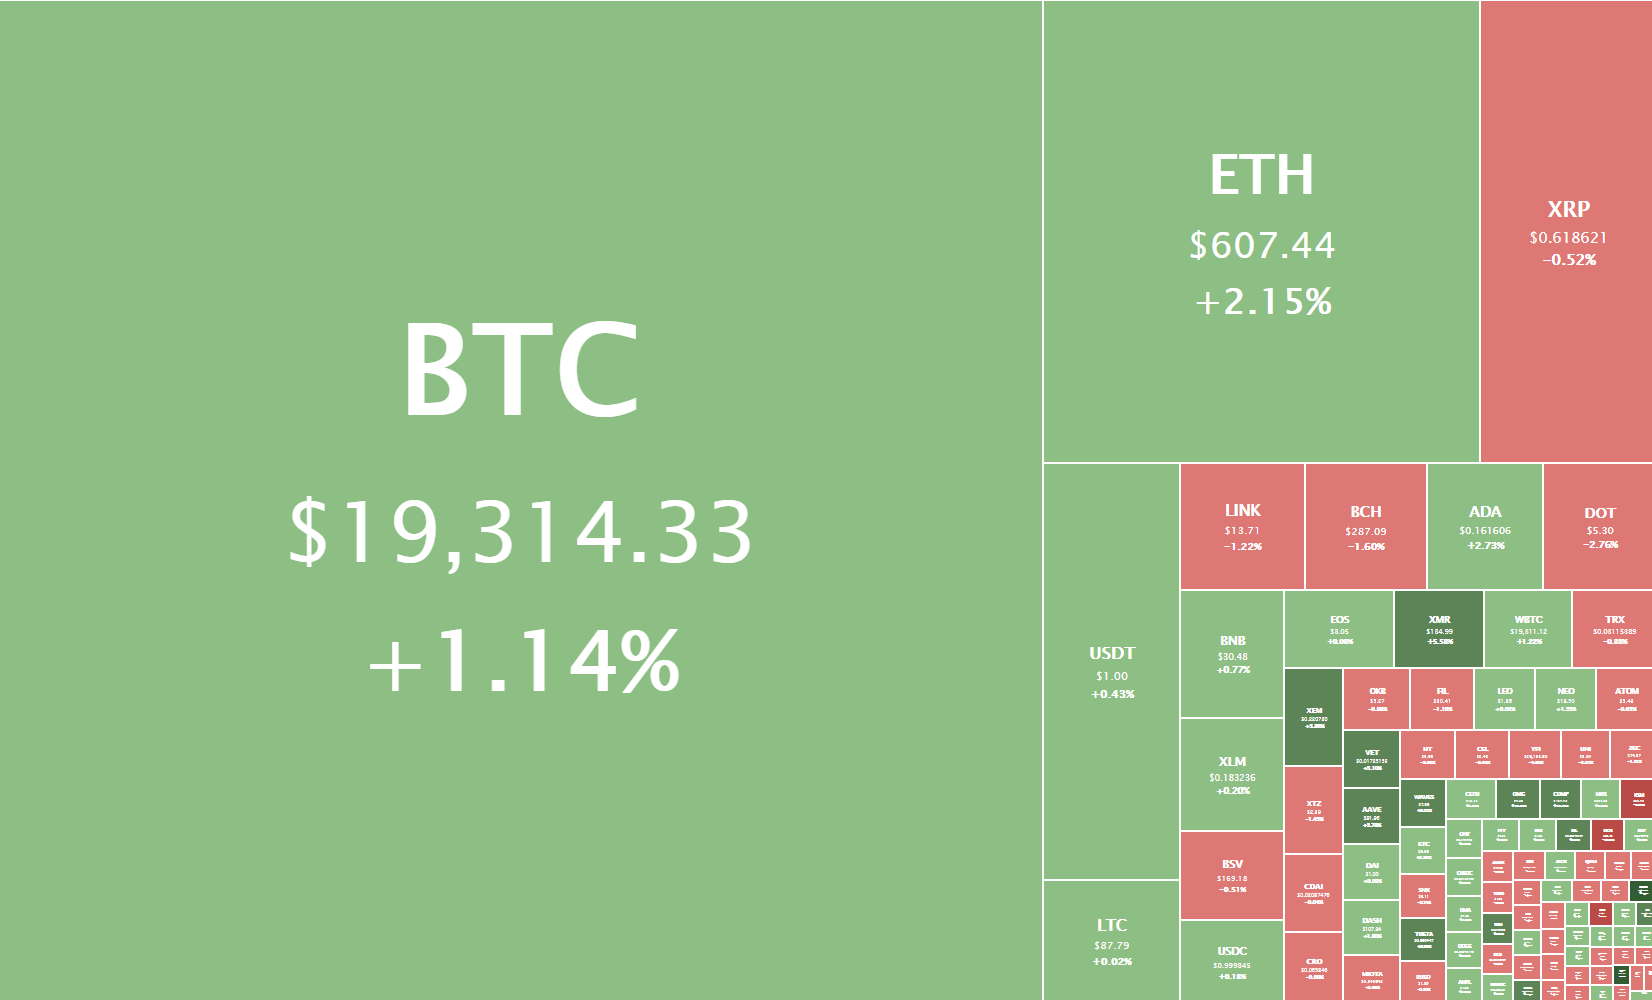
Daily Crypto Sector Heat Map
The past 24 hours have passed without any major winners or losers in the top100 cryptos. Ren gained 5.23% in the past 24 hours, making it the most prominent daily gainer in the top100. It is closely followed by Band Protocol’s 4.44% and VeChain’s 4.08% gain. On the other hand, Decentraland lost 4.98%, making it the most prominent daily loser. It is followed by Uniswap’s loss of 4.79% and Kyber Network’s loss of 4.49%.
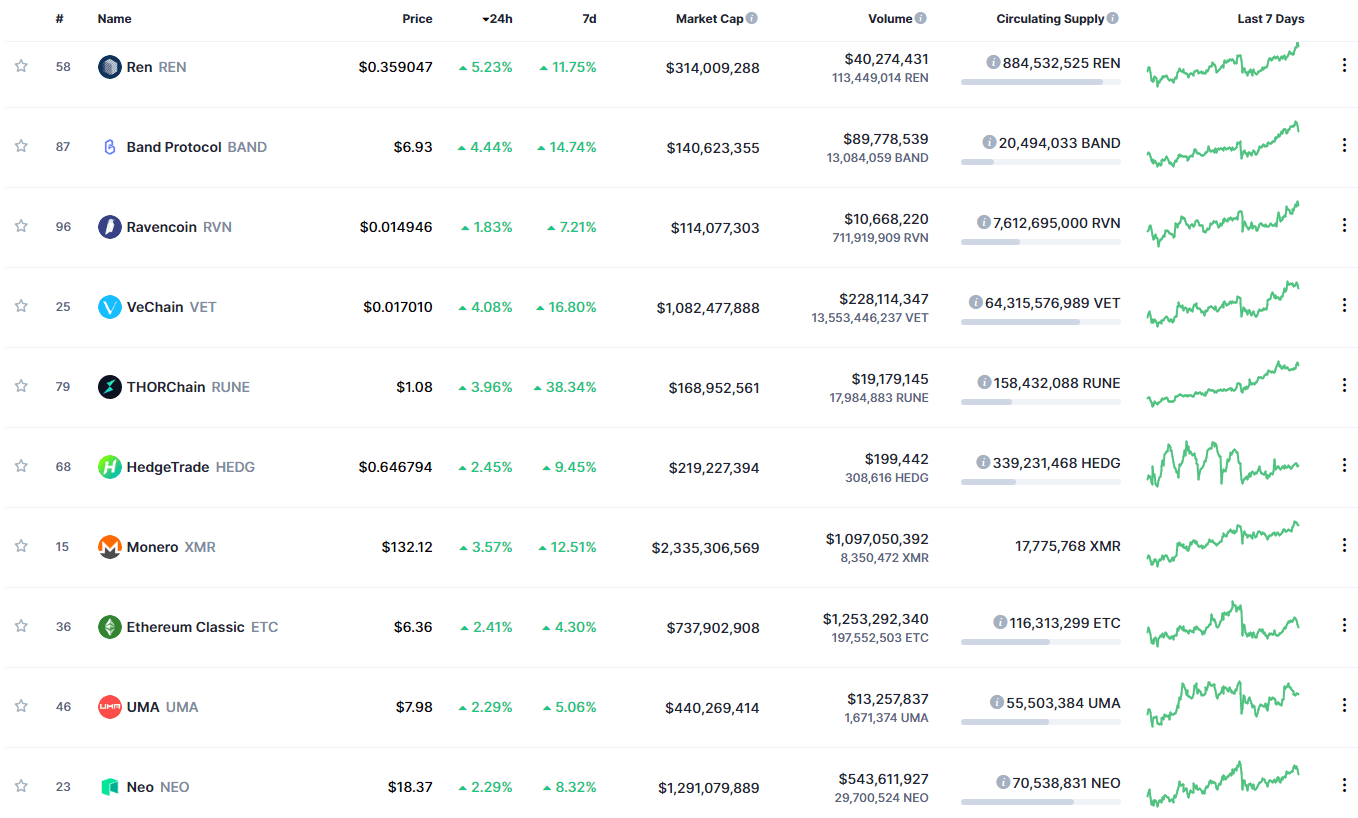
Top 10 24-hour Performers (Click to enlarge)
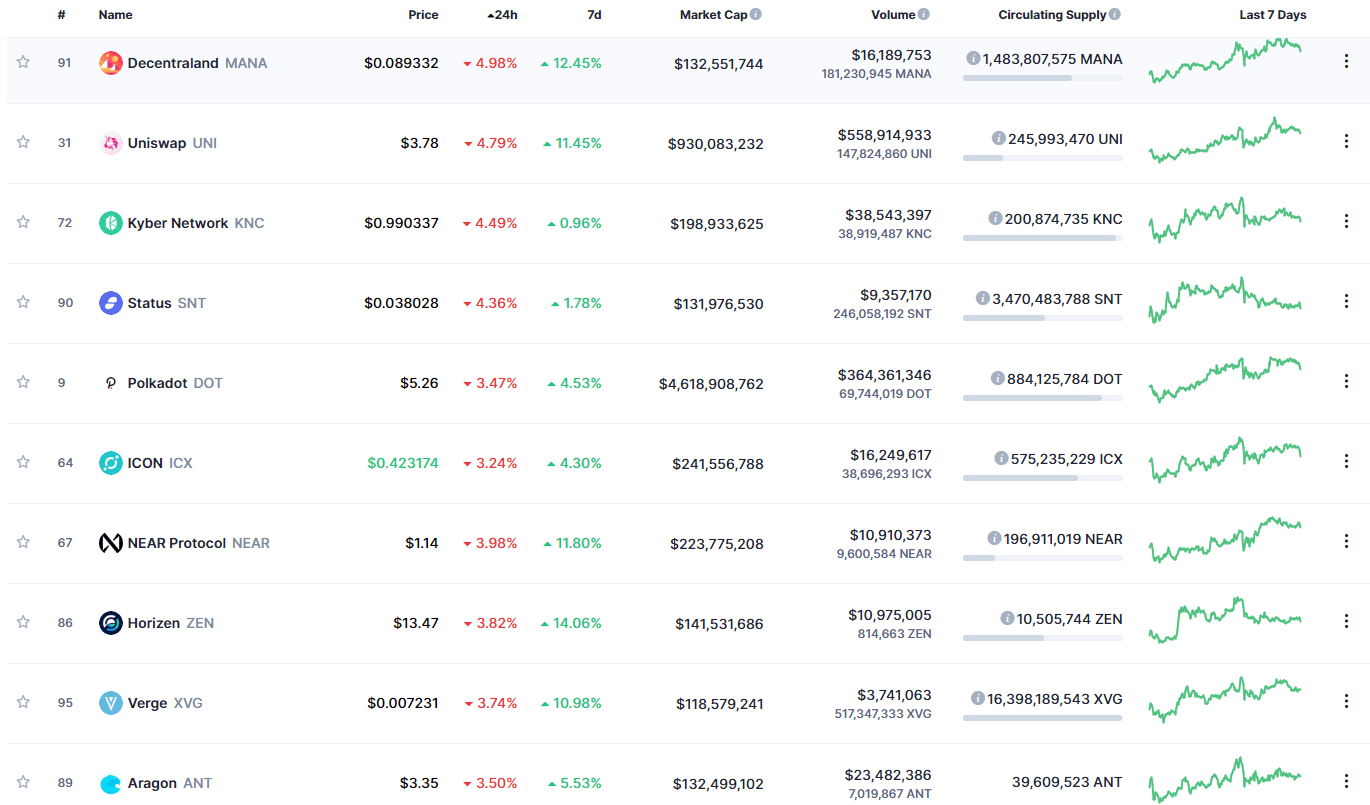
Bottom 10 24-hour Performers (Click to enlarge)
Bitcoin’s market dominance has barely changed since we last reported, with its value currently being 62.4%. This value represents a difference of 0.1% to the upside when compared to yesterday’s value.

Daily Crypto Market Cap Chart
The crypto sector capitalization has decreased just slightly in the past 24 hours. Its current value is $570.51 billion, representing a $0.54 billion decrease compared to our previous report.
_______________________________________________________________________
What happened in the past 24 hours?
_______________________________________________________________________
- What does China’s hydropower consumption parks mean for bitcoin mining (The Block)
- Spotify looking to hire an associate director to lead payments team involved with internal crypto efforts (The Block)
- Coinbase joins Square’s crypto patent effort COPA (The Block)
- Whales Buying Litecoin as Bitcoin’s Silver Takes Aims at $100 (Cryptobriefing)
- Coinbase Custody Adds Six New Coins to Its Vault (Cryptobriefing)
- Analyst: Once $20k breaks, throw Bitcoin fundamentals and valuations out the window (Cryptoslate)
- Bitcoin Undervalued Relative to Gold and Equities, Tudor Jones Says (Coindesk)
- Wrapped Bitcoin ‘Burns’ Increase as Traders Rotate Capital Out of Cooling DeFi (Coindesk)
- S&P Dow Jones Indices to Launch Crypto Indexes in 2021 (Coindesk)
- Though centralized, a digital yuan is too big for China to surveil, says Cypherium CEO (Cointelegraph)
_______________________________________________________________________
Technical analysis
_______________________________________________________________________
Bitcoin
Bitcoin has spent the day trying to break its immediate resistance (which is sitting at $19,490). However, all attempts throughout the day have been unsuccessful, which prompted Bitcoin to pull back slightly. However, the largest cryptocurrency by market cap has established its presence above $19,000 with confidence once again.
Bitcoin is quite unpredictable at the moment, making safe trades hard to find. Traders should pay attention to BTC volume and enter trades with a high profit/loss ratio to quickly mitigate the risk of things turning from good to bad.
BTC/USD 1-hour chart
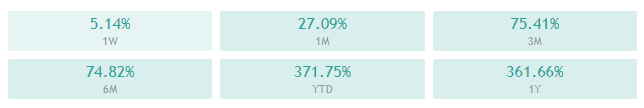
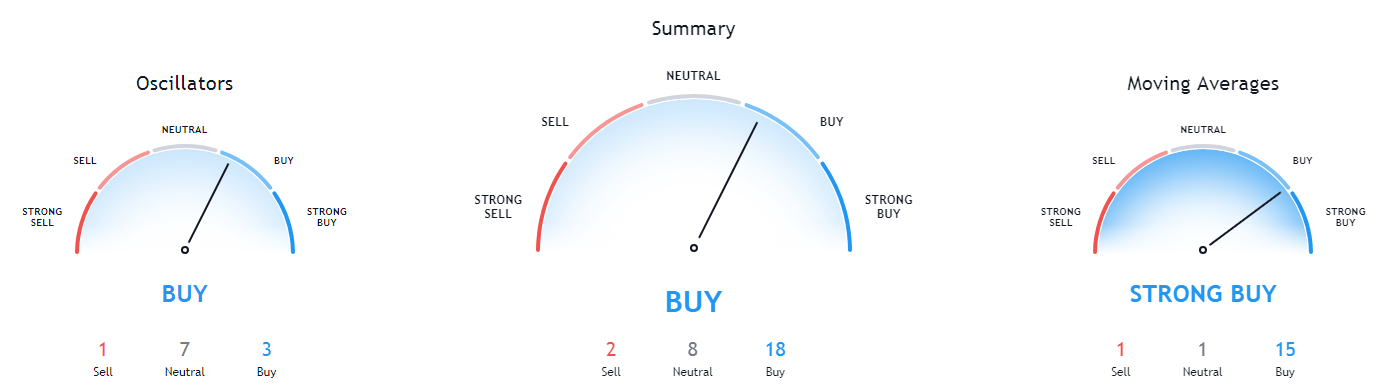
Bitcoin’s technicals on all time-frames are bullish, but they all show some signs of neutrality (or even bearishness) alongside the overall bullishness.

BTC/USD 1-day Technicals
Technical factors (4-hour Chart):
- Price is currently above its 50-period EMA and slightly above its 21-period EMA
- Price is at its middle Bollinger band
- RSI is neutral (56.72)
- Volume is average
Key levels to the upside Key levels to the downside
1: $19,500 1: $19,000
2: $19,666 2: $18,790
3: $20,000 3: $18,500
Ethereum
Ethereum has spent the day following Bitcoin’s movement, with its price first pushing towards the upside and then pulling back as it was unable to break a certain level (in this case, $620. On the other hand, the second-largest cryptocurrency by market cap has seemingly established its presence above $600, though not with nearly as much conviction as Bitcoin did.
If Ethereum traders followed our advice from yesterday’s analysis, they would have made quite a good profit by longing Ether after it broke $600, with a stop-loss set slightly below this level. While trading Ethereum is still quite possible, the current high correlation with Bitcoin’s movement makes Bitcoin a (possibly) better option to trade, simply due to fewer variables a trader would have to consider.
ETH/USD 1-hour Chart
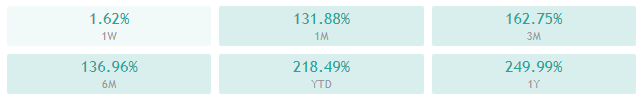
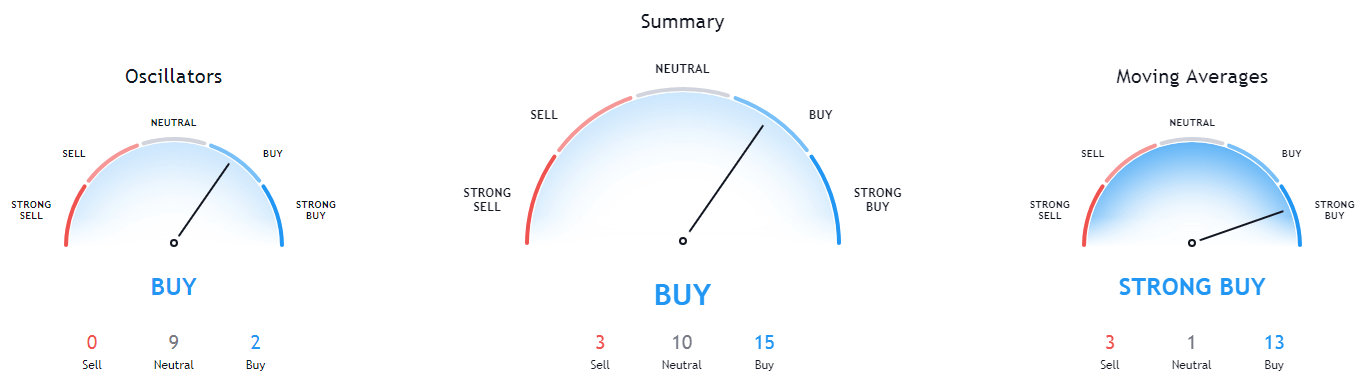
Ethereum’s daily and monthly overviews are completely bullish, while its 4-hour and weekly time-frames show some form of neutrality next to the overall bullishness.
ETH/USD 1-day Technicals
Technical Factors (4-hour Chart):
- The price is currently above its 50-period and slightly above its 21-period EMA
- Price is at its middle Bollinger band
- RSI is neutral (57.22)
- Volume is average
Key levels to the upside Key levels to the downside
1: $620 1: $600
2: $630 2: $510
3: $735 3: $500
Ripple
The fourth-largest cryptocurrency by market cap has had another extremely slow day, with its price barely fluctuating at all. The low volume and low volatility are continuing throughout the week, with XRP just barely moving to the downside as a response to the minor pullback caused by Bitcoin’s movement.
Trading XRP is a near-impossible feat at the moment, as the cryptocurrency currently shows no volatility and (therefore) no trade opportunities.
XRP/USD 2-hour Chart
XRP’s daily and monthly overviews are completely bullish, while its weekly time-frames show bullish sentiment with a hint of neutrality. Its 4-hour overview, however, is completely bearish.
XRP/USD 1-day Technicals
Technical factors (4-hour Chart):
- The price is (at the moment of writing) slightly above its 50-period EMA and slightly below its 21-period EMA
- Price is slightly below its middle Bollinger band
- RSI is neutral (48.53)
- Volume is slightly below average
Key levels to the upside Key levels to the downside
1: $0.666 1: $0.6
2: $0.78 2: $0.596
3: $0.79 3: $0.535
Related posts
 Daily Crypto Review, Mar 17 – Bitcoin back up above $5,000 as bulls gather up
 Daily Crypto Review, Apr 3 – Bitcoin over $7,000? Is the downtrend finally over?
 Daily Crypto Review, Oct 5 – XRP Skyrockets and Gains Over 9%; Uniswap’s Volume Trumps Coinbase
 Daily Crypto Review, Oct 9 – Bitcoin Close to $11,000: What’s Next?