
The cryptocurrency sector as a whole has experienced a quick push to the upside. Bitcoin is currently trading for $10,839, representing an increase of 2.44% on the day. Meanwhile, Ethereum gained 2.91% on the day, while XRP gained 1.59%.

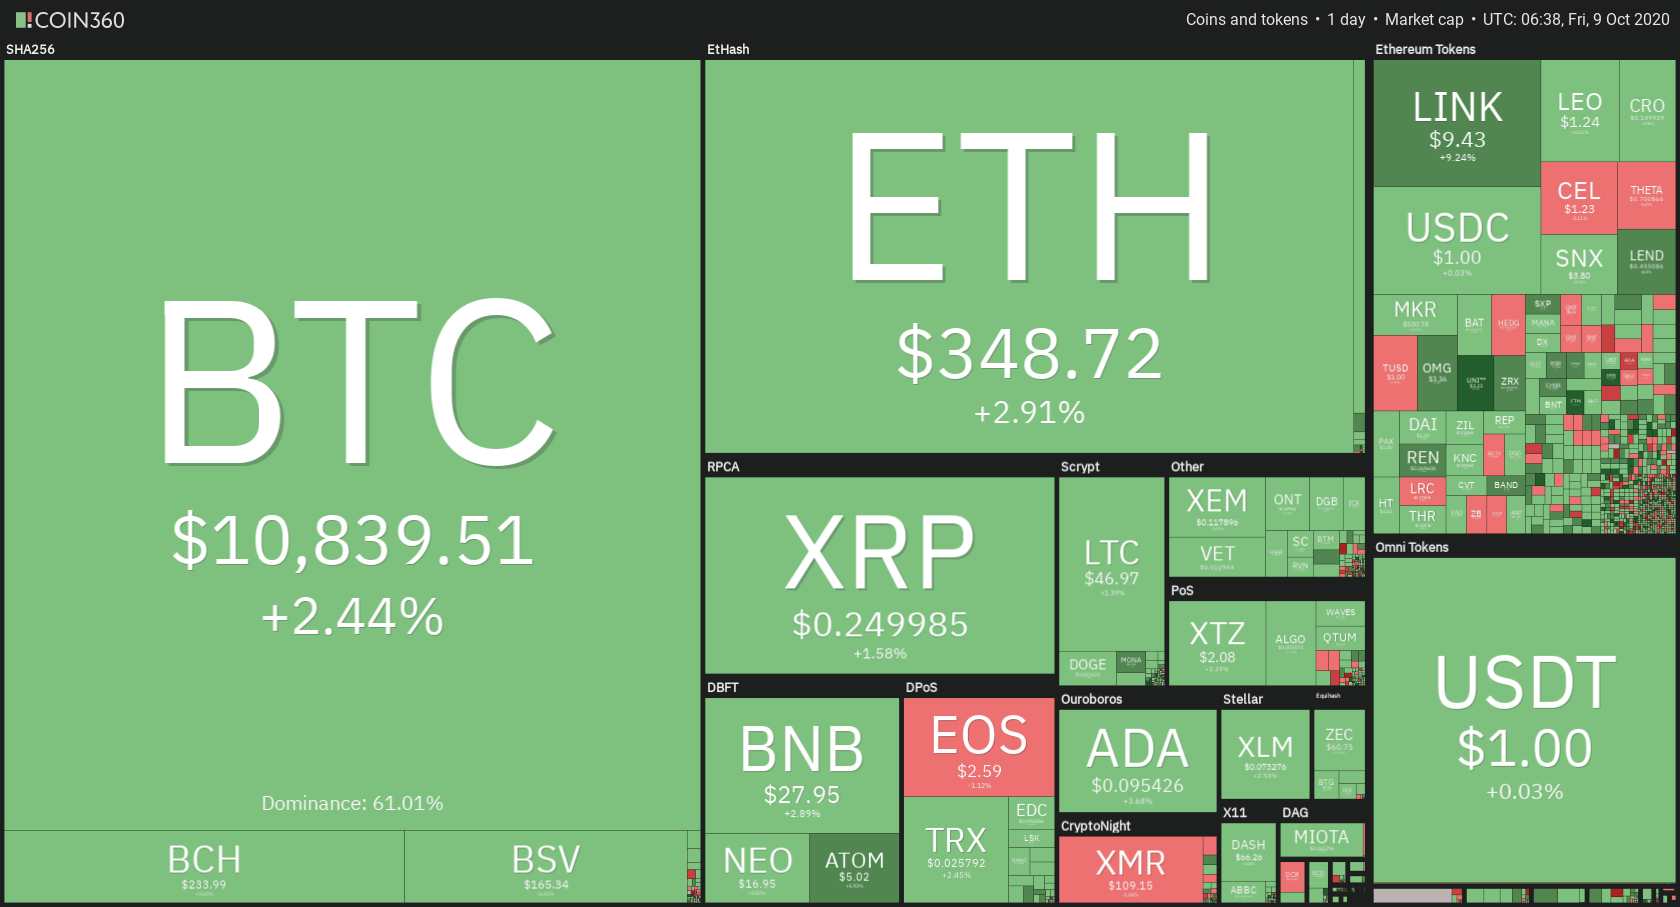
Daily Crypto Sector Heat Map
If we look at the top 100 cryptocurrencies, we can see that UMA gained 31.88% in the past 24 hours, making it the most prominent daily gainer. The Midas Touch Gold (25.91%) and SushiSwap (18.59%) also did great. On the other hand, PumaPay lost 12.87%, making it the most prominent daily loser. It is followed by Zuba Token’s loss of 2.87% and Augur’s loss of 2.32%.
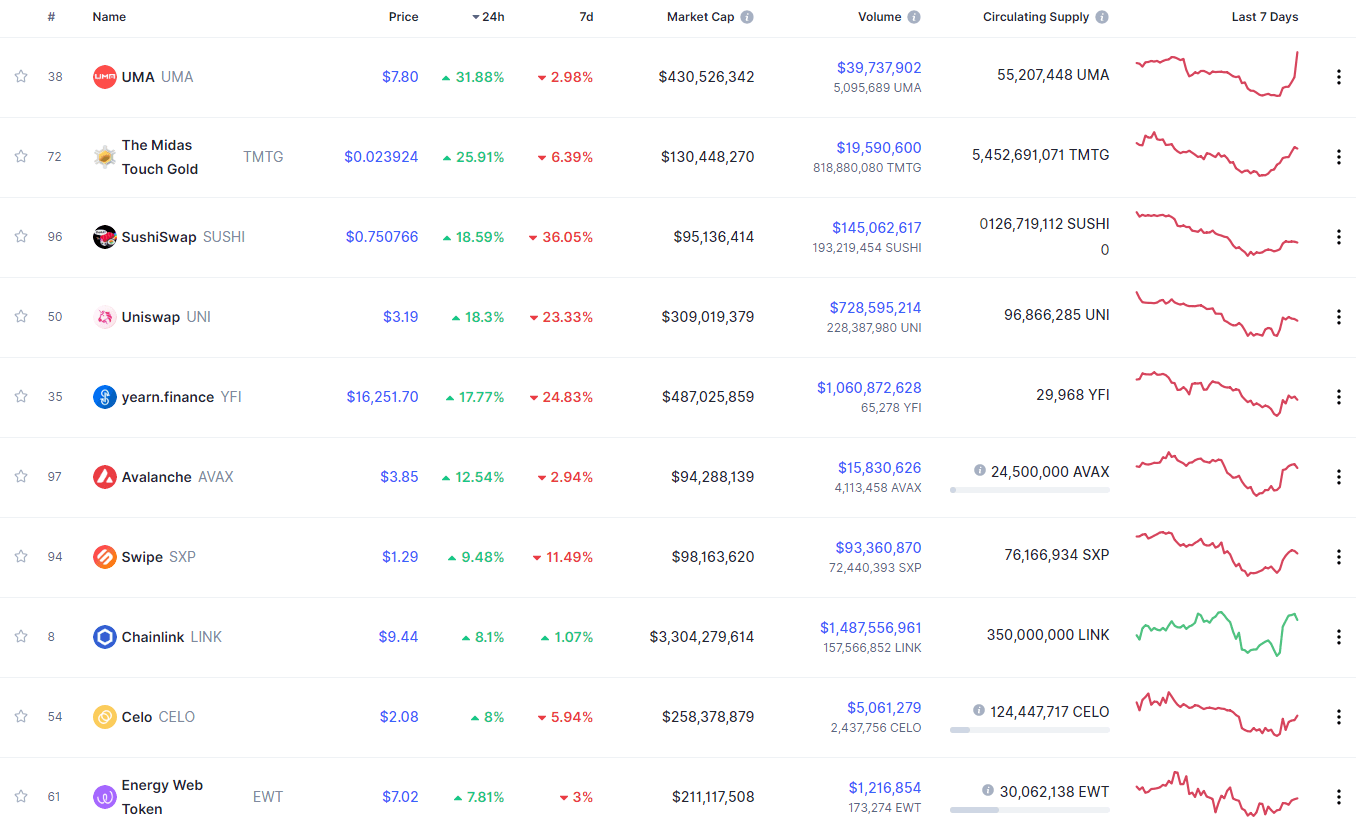
Top 10 24-hour Performers (Click to enlarge)
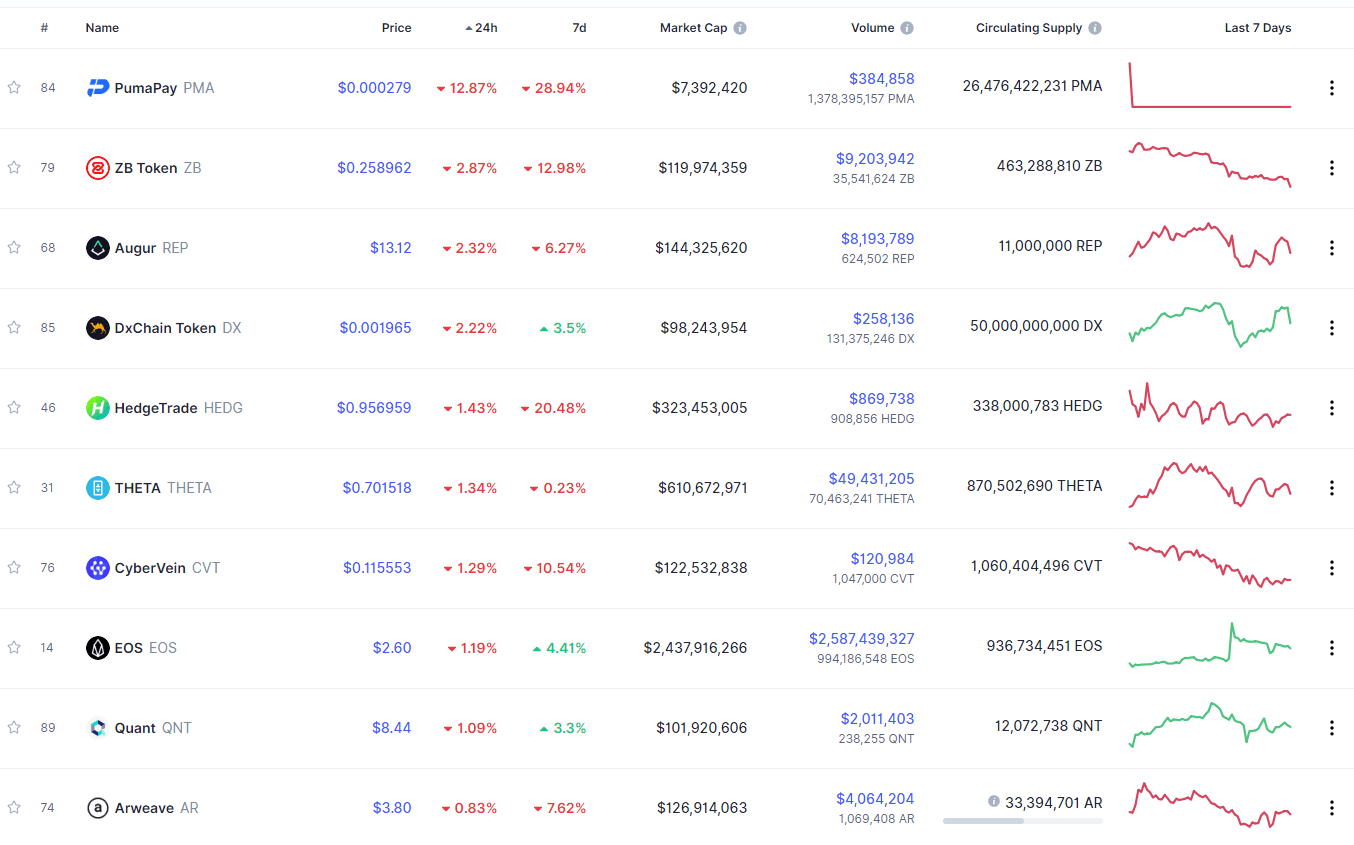
Bottom 10 24-hour Performers (Click to enlarge)
Bitcoin’s market dominance level has stayed at the same place since our last report, with its value currently being at 61.01%. This value represents a 0.05% difference to the upside when compared to when we last reported.
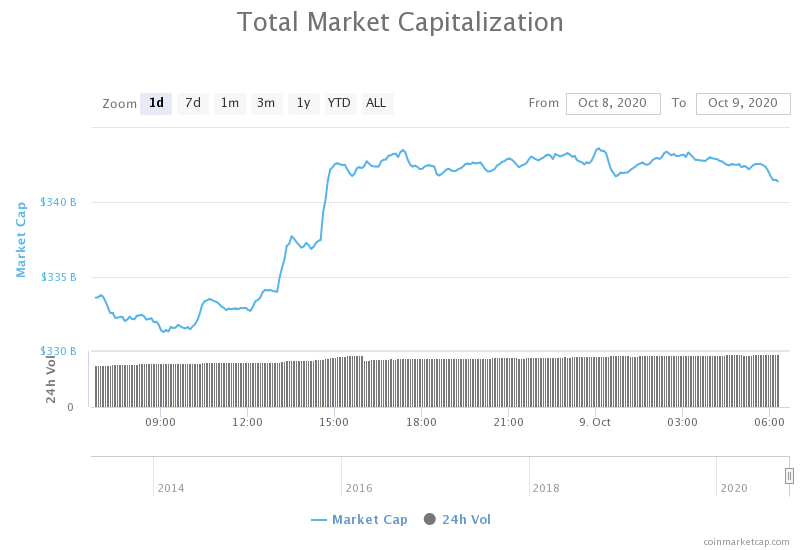
Daily Crypto Market Cap Chart
The crypto sector capitalization has gained quite a bit of value over the course of the past 24 hours. Its current value is $343.72 billion, representing an increase of $10.6 billion compared to our previous report.
_______________________________________________________________________
What happened in the past 24 hours?
_______________________________________________________________________
- A researcher debunks the Stock-to-Flow model, likens Bitcoin to a ‘tech stock’ (Cointelegraph)
- Bitcoin price fundamentals in ‘moon mode’ as BTC held on exchanges drops (Cointelegraph)
- The DOJ’s ‘Crypto Enforcement Framework’ Argues Against Privacy Tools and for International Regulation (Coindesk)
- JPMorgan’s Blockchain Lead Is in Charge of Ethereum-Based Interbank Information Network (Coindesk)
- Monero Faces Multi-Year Resistance as Technicals Scream Sell (Cryptobriefing)
- Cratering Yields Sends DeFi Niche into Death Spiral (Cryptobriefing)
- BitMEX parent company changes its leadership following CFTC charges (Cryptoslate)
- Square allocates 1% of its total assets to Bitcoin (Cryptoslate)
- Billionaire investor Chamath Palihapitiya just doubled down on Bitcoin in CNBC interview (Cryptoslate)
- Tether has blacklisted 100 addresses on Ethereum, network data shows (The Block)
_______________________________________________________________________
Technical analysis
_______________________________________________________________________
Bitcoin
The largest cryptocurrency by market cap has broken its triangle formation towards the upside after a bounce from the $10,500 support level. The massive bull presence had brought the price just under $11,000 before BTC started to pull back and seek an appropriate level to consolidate at. At the time being, Bitcoin is fighting for $10,850, and staying above, it would be a major precursor to its future possible push towards $11,000-$11,300.
Traders should pay close attention to Bitcoin’s price movement around the $10,850 level, as well as the ascending line (pink), and trade based on how the price reacts to these levels.
BTC/USD 4-hour Chart
Bitcoin’s technical overview has turned bullish overall, with every single time-frame being bullish. While its weekly and monthly overviews were bullish for months now, its daily and 4-hour technicals have turned bullish only after the most recent spike.
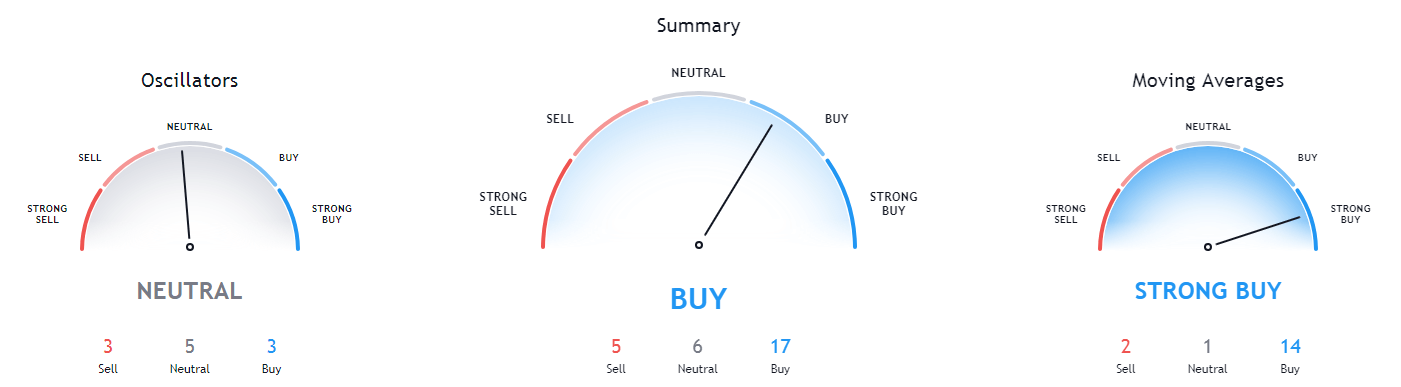
BTC/USD 4-hour Technicals
Technical factors (4-hour Chart):
- Price is above both its 50-period EMA and 21-period EMA
- Price is near the top Bollinger band
- RSI is descending from almost-overbought levels (61.39)
- Volume is descending from above-average
Key levels to the upside Key levels to the downside
1: $11,000 1: $10,850
2: $11,180 2: $10,630
3: $11,300 3: $10,500
Ethereum
Ethereum has moved towards the upside alongside Bitcoin, but its price movement didn’t do anything as impactful as Bitcoin’s price. While the bounce from the $344 level was significant, it could not reach, let alone pass, the $360 level. Ethereum’s short-term future is certainly within this range, which traders can make use of.
Once again, we will point out an extremely high chance of Ethereum staying between $334 and $360.
ETH/USD 4-hour Chart
Ethereum’s short-term technicals are somewhat unclear, with its 4-hour overview turning to bullish and 1-day overview still being tilted towards the sell-side quite heavily. On the other hand, its long-term technicals are quite bullish.
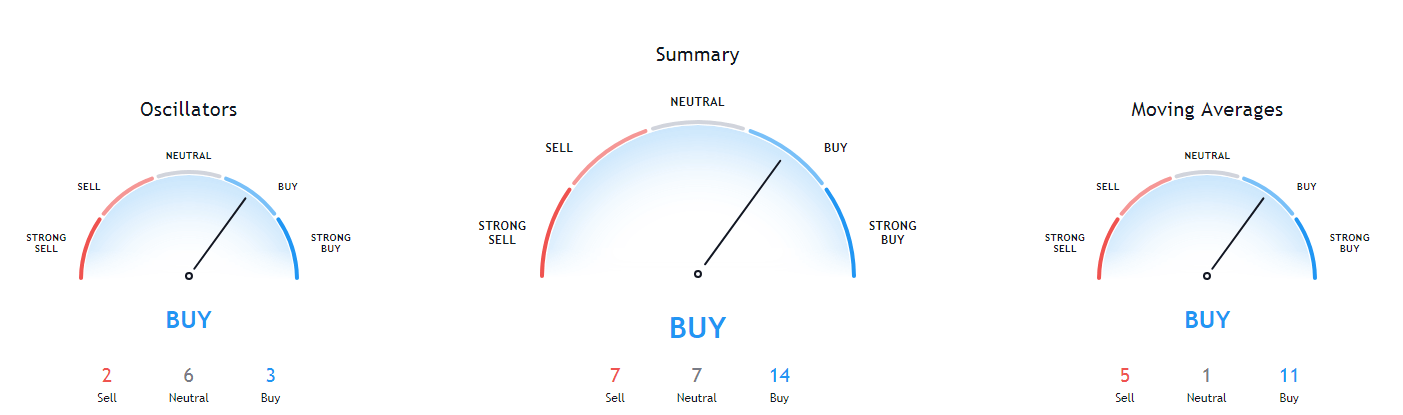
ETH/USD 4-hour Technicals
Technical Factors (4-hour Chart):
- The price is above both its 50-period and 21-period EMA
- The price is near its middle Bollinger band
- RSI is neutral (54.08)
- Volume is below average (one-candle spike)
Key levels to the upside Key levels to the downside
1: $360 1: $334
2: $371 2: $300
3: $400 3: $289
Ripple
XRP has used Bitcoin’s move towards the upside to fuel its own move and established itself above the $0.2454 level. The third-largest cryptocurrency by market cap has bounced off the ascending line (and not the $0.2454 level this time) dating back from Sep 24 and pushed up, reaching as high as $0.253 before ending the move.
Traders should pay attention to any sharp increases in volume, as well as how XRP handles the immediate support and resistance levels. Most analysts are currently quite bullish on XRP, mostly when it comes to 1-hour and 4-hour charts.
XRP/USD 4-hour Chart
XRP 4-hour, daily, and weekly technicals are quite bullish, while its monthly overview is tilted towards the sell-side.

XRP/USD 4-hour Technicals
Technical factors (4-hour Chart):
- The price is above its 50-period EMA and its 21-period EMA
- Price is close to its middle Bollinger band
- RSI is neutral (55.13)
- Volume is above average
Key levels to the upside Key levels to the downside
1: $0.266 1: $0.2454
2: $0.27 2: $0.235
3: $0.273 3: $0.227
Related posts
 Daily Crypto Review, Feb 10 – Bitcoin fighting to regain $10,000 after a sudden crash occurs
 Daily Crypto Review, Feb 17 – Altcoins take a dive as Bitcoin drops under $10,000; Craig Wright suing BTC and BCH?
 Daily Crypto Review, May 28 – “We Are All Satoshi” – Craig Wright Exposed?
 Daily Crypto Review, Jun 19 – Bitcoin Mid-Term Bullish vs. Bearish Outlook – Explained