
The majority of the cryptocurrency sector ended up in the green as Bitcoin spent the weekend regaining the value it lost after failing to break its all-time high with confidence. Bitcoin is currently trading for $19,144, representing an increase of 1.69% compared to yesterday’s value. Meanwhile, Ethereum’s price has increased by 3.61% on the day, while XRP managed to gain 3.77%.
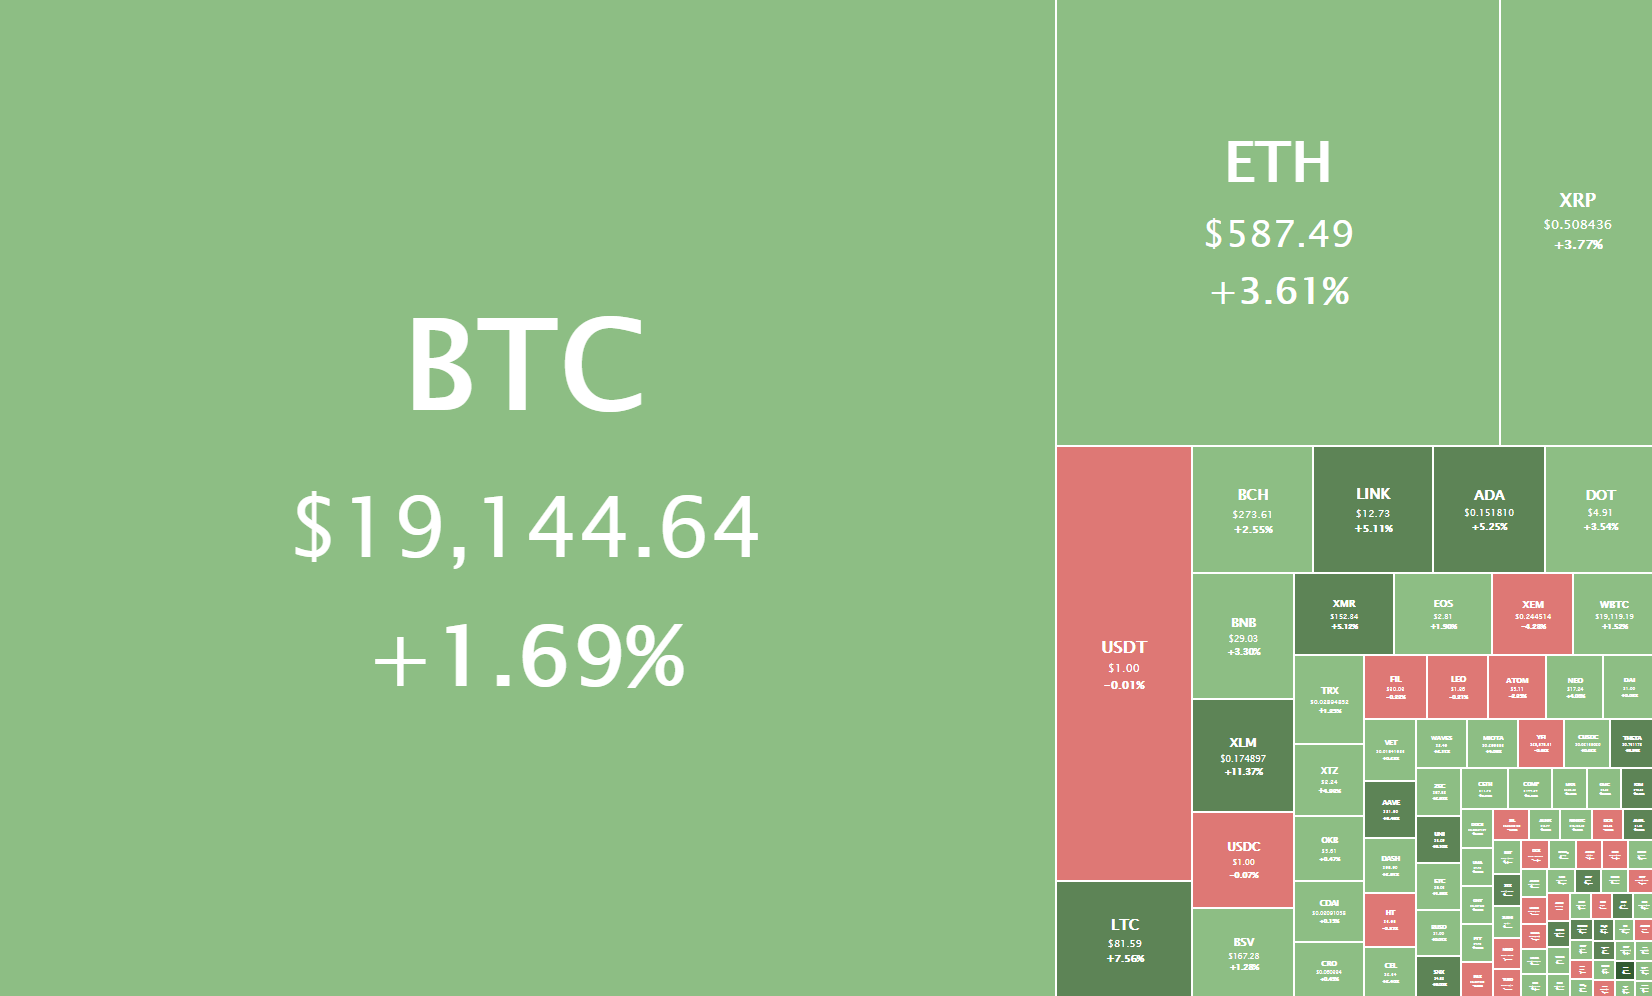
Daily Crypto Sector Heat Map
BDCC Bitica COIN gained 229.29% in the past 24 hours, making it the most prominent daily crypto gainer by far. It is followed by Ethereum Lightning’s 223.18% and Nuggets’ 190.36% gain. On the other hand, rbase.finance lost 72.18%, making it the most prominent daily loser. It is followed by COIL’s loss of 48.85% and SBank’s loss of 40.65%.
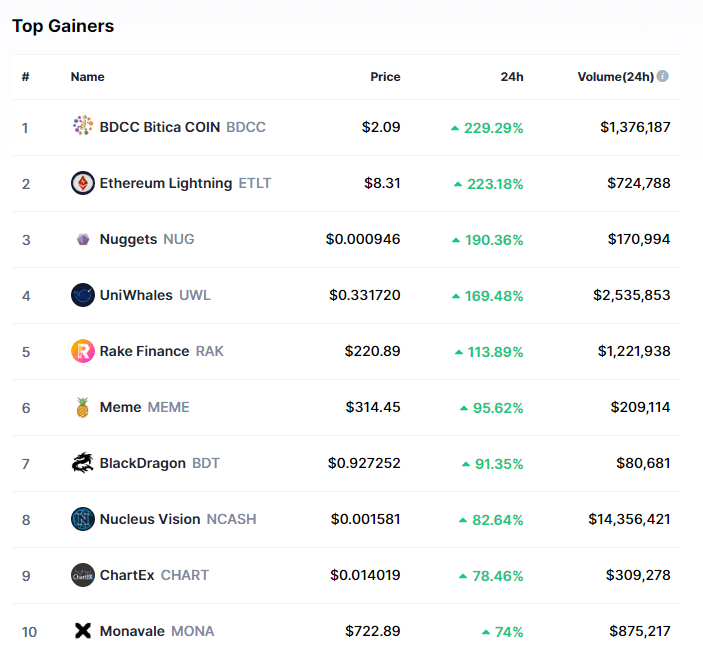
Top 10 24-hour Performers (Click to enlarge)
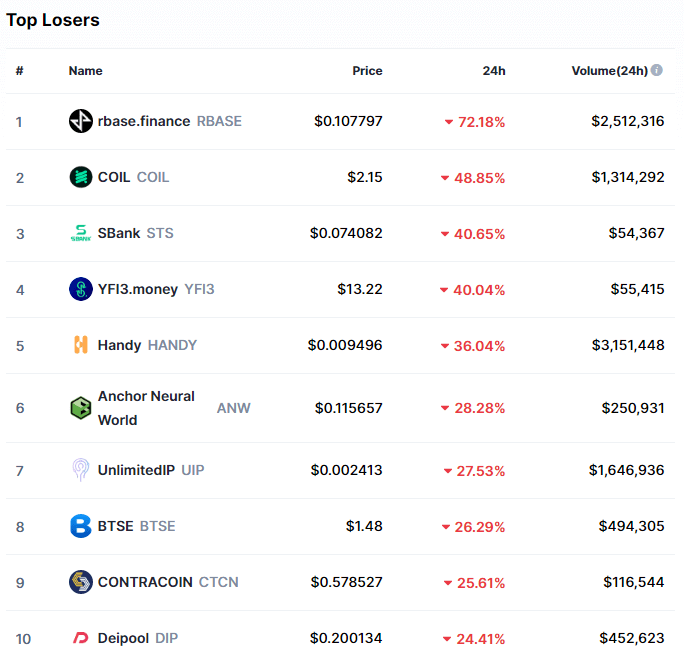
Bottom 10 24-hour Performers (Click to enlarge)
Bitcoin’s market dominance has moved up half a percent since we last reported, with its value currently being 63.3%. This value represents a 0.5% difference to the upside compared to the value it had when we last reported.
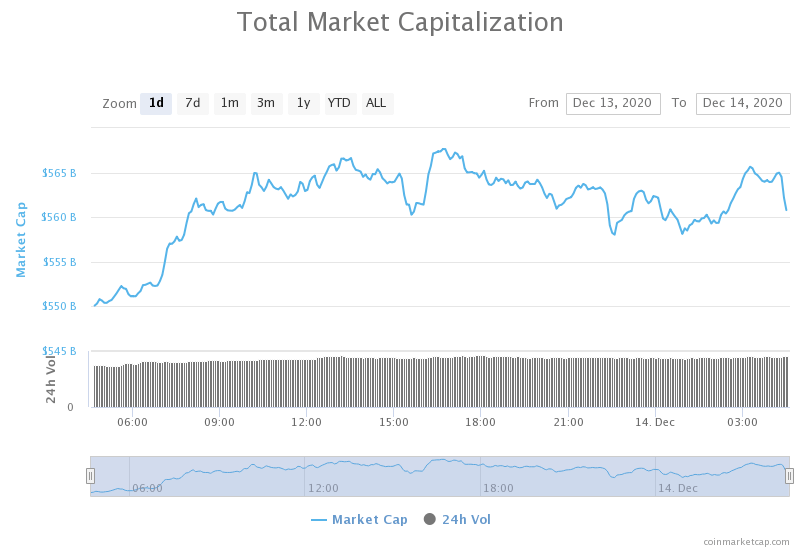
Daily Crypto Market Cap Chart
The cryptocurrency sector capitalization has increased significantly over the weekend, with its current value being $560.79 billion. This represents a $31.22 billion increase when compared to our previous report.
_______________________________________________________________________
What happened in the past 24 hours?
_______________________________________________________________________
- Why this leading trader is hesitant to build a Bitcoin short position here (Cryptoslate)
- Research shows 12 major “non-financial” risks exist on Ethereum dApps (Cryptoslate)
- Correlation between Bitcoin and S&P 500 hits a 10-month low (Cryptoslate)
- Fidelity CEO Abigail Johnson takes rare interview, expresses excitement about Bitcoin (Cryptoslate)
- Ex-Goldman Sachs exec: Ethereum could surpass Bitcoin’s market cap in 10 years (Cryptoslate)
- Flare Airdrop Snapshot Ushers in Ripple’s DeFi Era (Cryptobriefing)
- Revolut adds four new cryptos for European users on its digital bank platform (The Block)
- Ethereum options trade volume surged in November to hit $1.76 billion for the month (The Block)
- ECB Governing Council highlights the potential for ‘new business models’ if a digital euro is introduced (The Block)
- ‘Bitcoin never gets hacked’ — crypto players respond to US Treasury breach (Cointelegraph)
_______________________________________________________________________
Technical analysis
_______________________________________________________________________
Bitcoin
Bitcoin has been on fire this weekend, with its price skyrocketing from its recent lows. The uptrend that started on Dec 11 brought its price from $17,600 all the way up to $19,400 before starting to consolidate. The steep ascending trend it created was unsustainable in the long run, so Bitcoin left it and continued trading sideways just above $19,100. The largest cryptocurrency by market cap is currently fighting for this level, with the previous five 4-hour candles holding above the support.
BTC/USD 4-hour chart
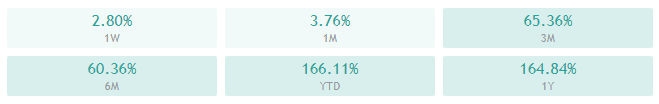
Bitcoin’s daily and monthly technicals show slight signs of neutrality on top of its overall bullishness. On the other hand, its 4-hour and weekly technicals are completely bullish.
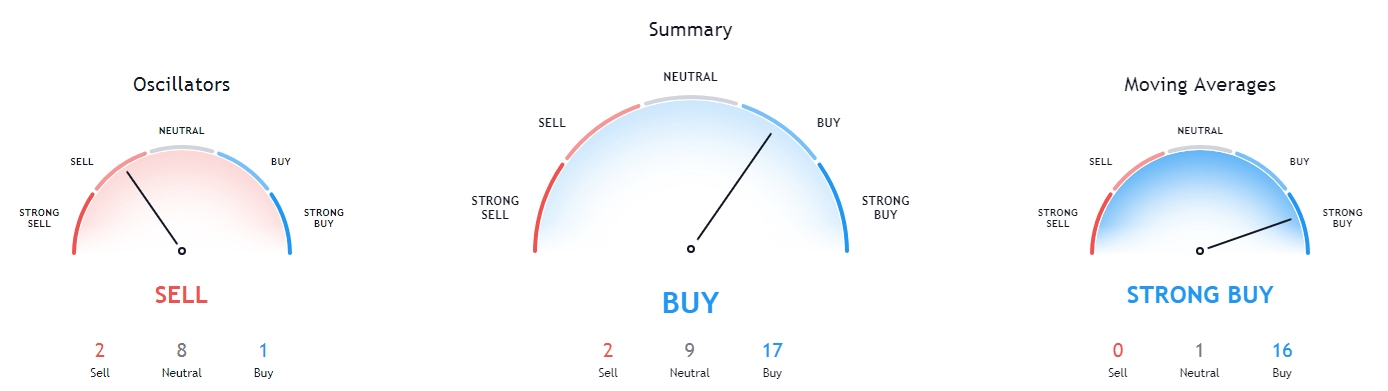
BTC/USD 1-day Technicals
Technical factors (4-hour Chart):
- Price is above both its 50-period and 21-period EMAs
- Price is between its middle and top Bollinger band
- RSI is neutral (59.17)
- Volume is slightly below the average level
Key levels to the upside Key levels to the downside
1: $19,100 1: $18,600
2: $19,666 2: $18,190
3: $20,000 3: $17,800
Ethereum
Ethereum has followed Bitcoin’s footsteps and created its own ascending channel, in which it moved from Dec 11 until Dec 13. The second-largest cryptocurrency by market cap has left this channel and started its own consolidation phase right above the $581 support level.
Ethereum’s moves seem like a mirror to Bitcoin’s moves, with slightly more or less intensity. Traders should be extremely careful of sudden moves Bitcoin can make that could disrupt their Ethereum trades.
ETH/USD 4-hour Chart
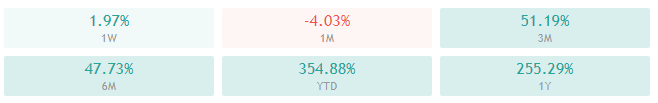
Ethereum’s 4-hour, daily, and weekly technicals overall bullish but show signs of neutrality or even some bearish indicators. On the other hand, its monthly technicals are completely tilted towards the buy-side.
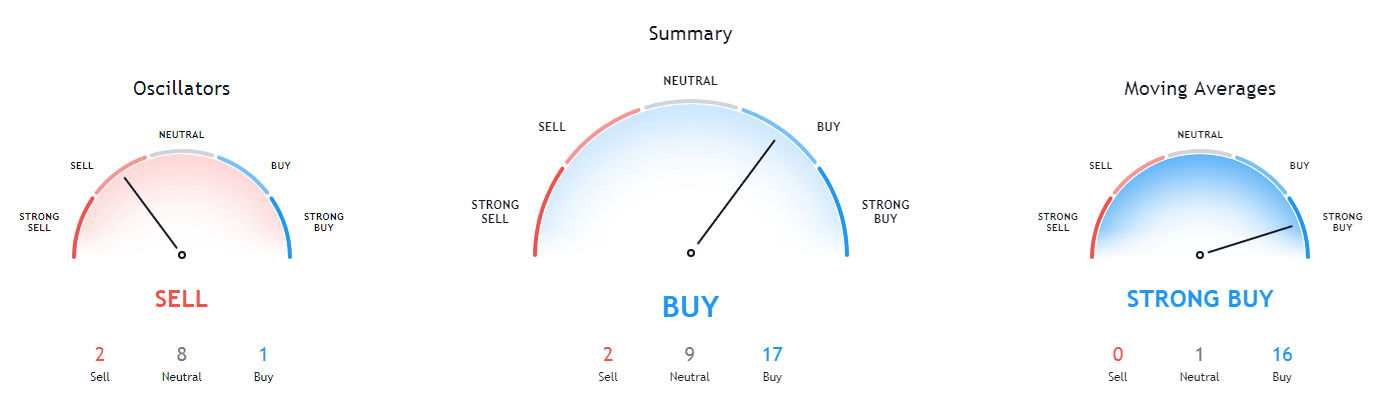
ETH/USD 1-day Technicals
Technical Factors (4-hour Chart):
- Price is above both its 50-period and 21-period EMAs
- Price is between its middle and top Bollinger band
- RSI is starting to descend after being close to overbought (58.72)
- Volume is average when compared to the previous week
Key levels to the upside Key levels to the downside
1: $600 1: $581
2: $632 2: $565
3: $636.5 3: $545
Ripple
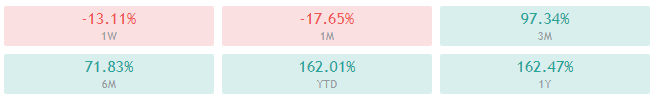
XRP performed much worse than Bitcoin and Ethereum over the weekend, with its short-term outlook being quite bearish. The fourth-largest cryptocurrency by market cap ended up losing $13.11% of its value week-over-week, with its price currently sitting at the $0.5 level.
XRP is currently fighting to stay above the $0.5 level, with its past four 4-hour candles managing to do this. Traders may be able to catch a trade in either direction when XRP confirms its position above/below $0.5 on increased volume.
XRP/USD 4-hour Chart
XRP’s 4-hour and daily overviews are heavily tilted towards the sell-side but still show some neutral indicators. Its longer-term technicals, though, are completely bullish.
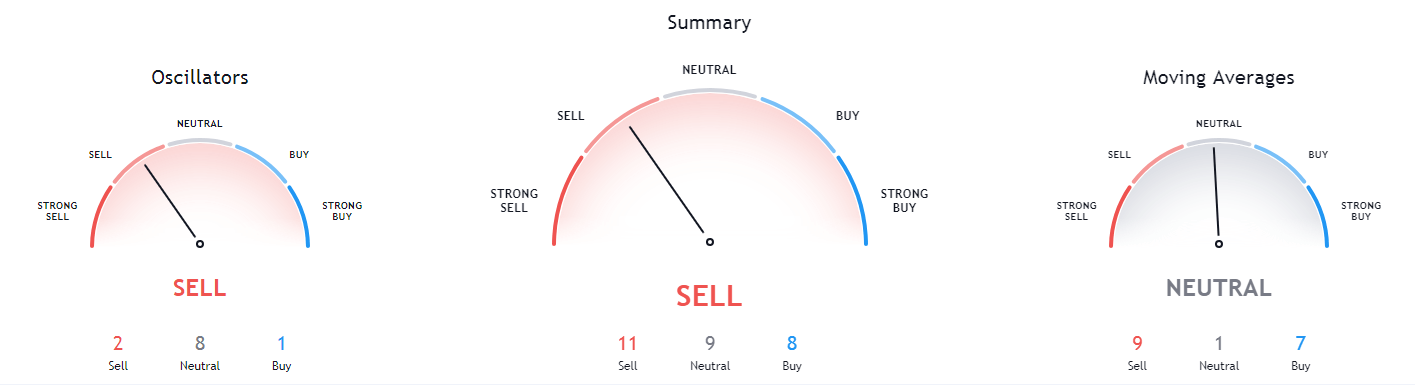
XRP/USD 1-day Technicals
Technical factors (4-hour Chart):
- Its price is currently below both its 50-period EMA and its 21-period EMA
- Price is between its middle and bottom Bollinger band
- RSI is neutral (37.98)
- Volume is slightly below the average level
Key levels to the upside Key levels to the downside
1: $0.5435 1: $0.5
2: $0.57 2: $0.475
3: $0.6 3: $0.45
Related posts
 Daily Crypto Review, July 15 – Fidelity Goes All-In On Bitcoin; BTC Difficulty At Historic Heights
 Daily Crypto Review, July 22 – Ethereum Passes Bitcoin and Becomes the Most Used Blockchain
 Daily Crypto Review, July 24 – Bitcoin Above $10,000; Ethereum Passing $300
 Daily Crypto Review, Nov 12 – Bitcoin Formed a Triple Top? Ethereum Accidentally Hard Forks