
The cryptocurrency market spent yet another day shooting for the upside as Bitcoin tries to push itself closer towards $10,000. Bitcoin is currently trading for $9,358, which represents an increase of 1.75% on the day. Meanwhile, Ethereum gained 3.06% on the day, while XRP gained 1.35%.
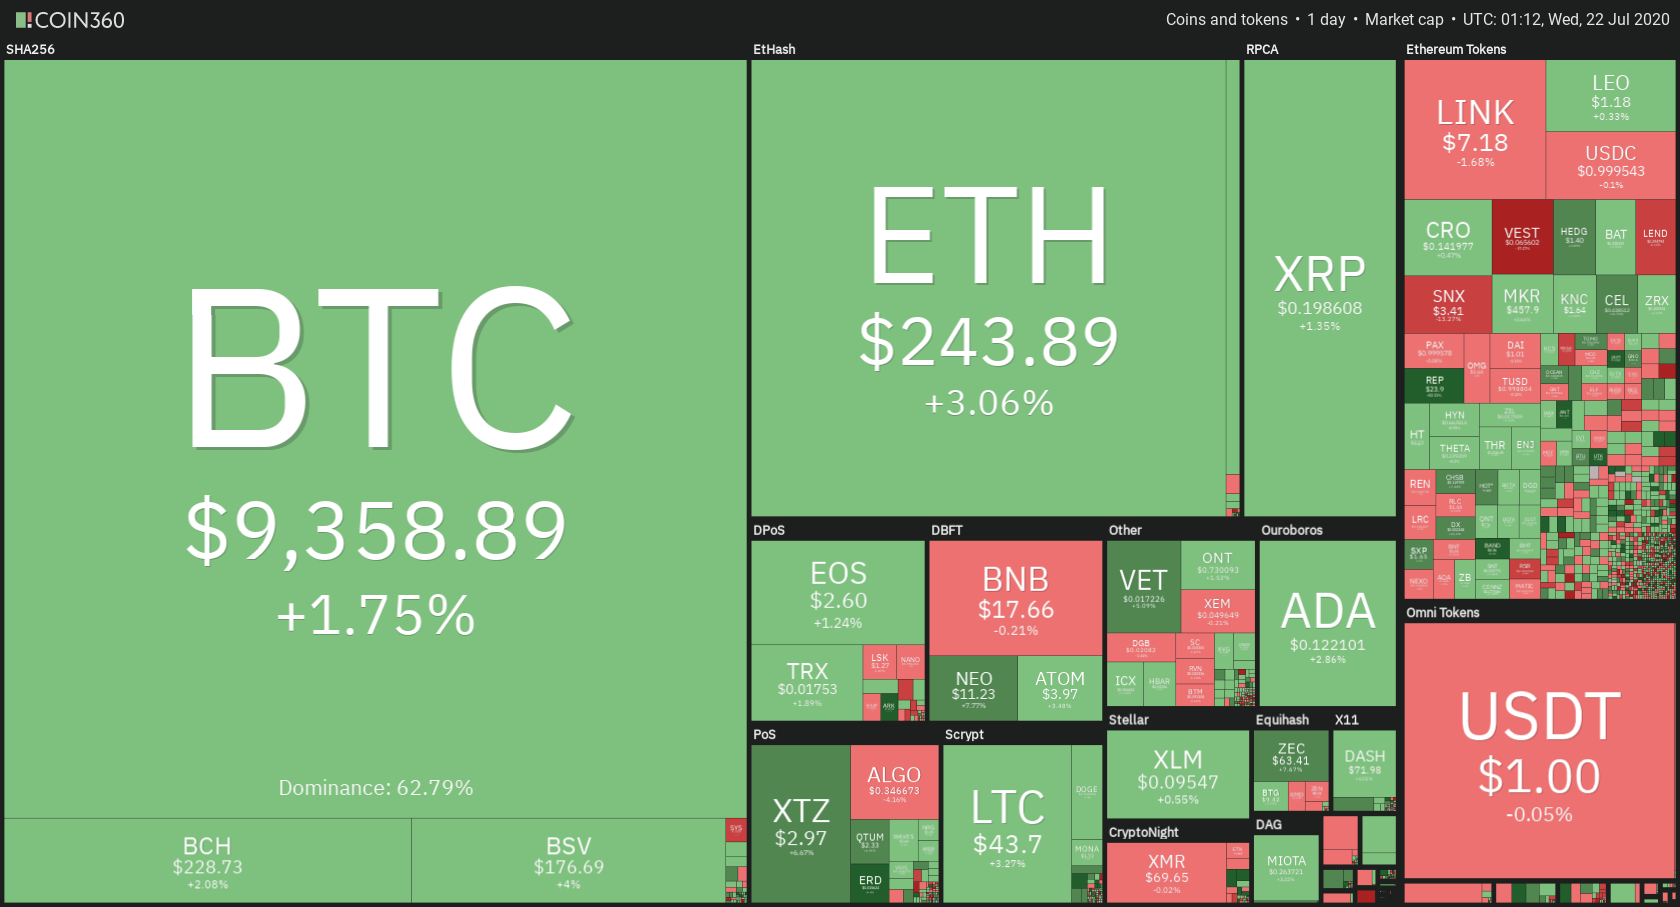
Daily Crypto Sector Heat Map
When talking about top100 cryptocurrencies, Augur gained 22.19% on the day, making it the most prominent daily gainer. Elrond (20.66%) and Blockstack (16%) also did great. On the other hand, Synthetix Network has lost 10.2%, making it the most prominent daily loser. It is followed by Reserve Rights’ loss of 6.28% and Algorand’s loss of 4.53%.
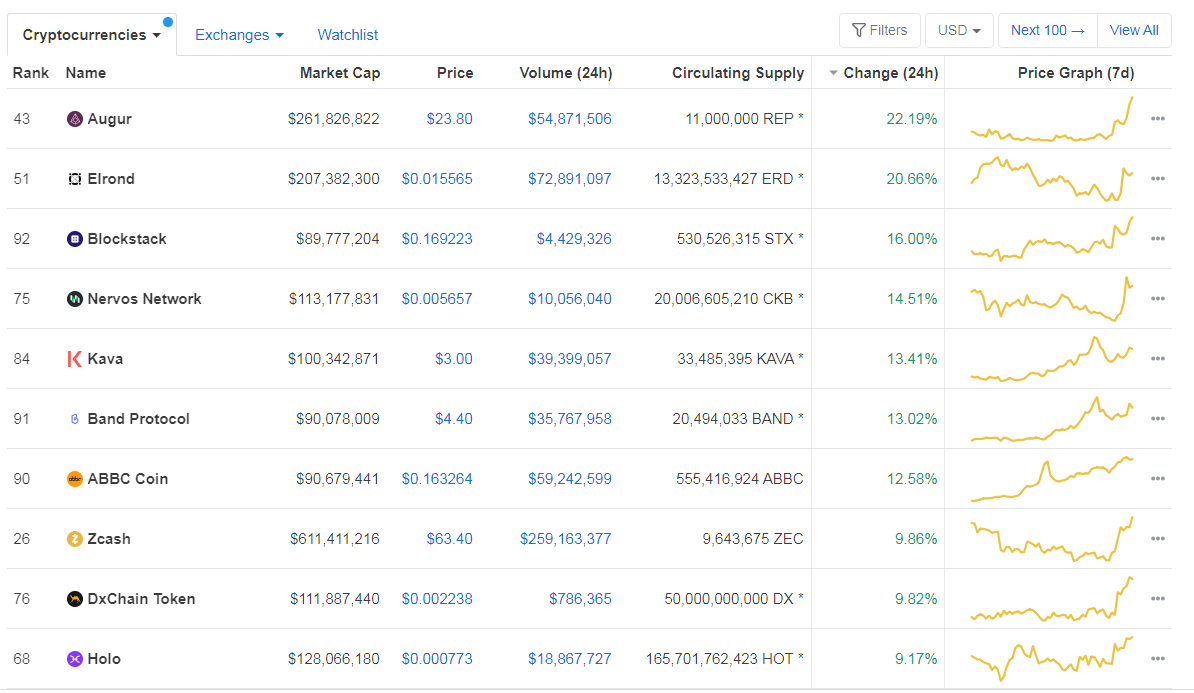
Top 10 24-hour Performers (Click to enlarge)
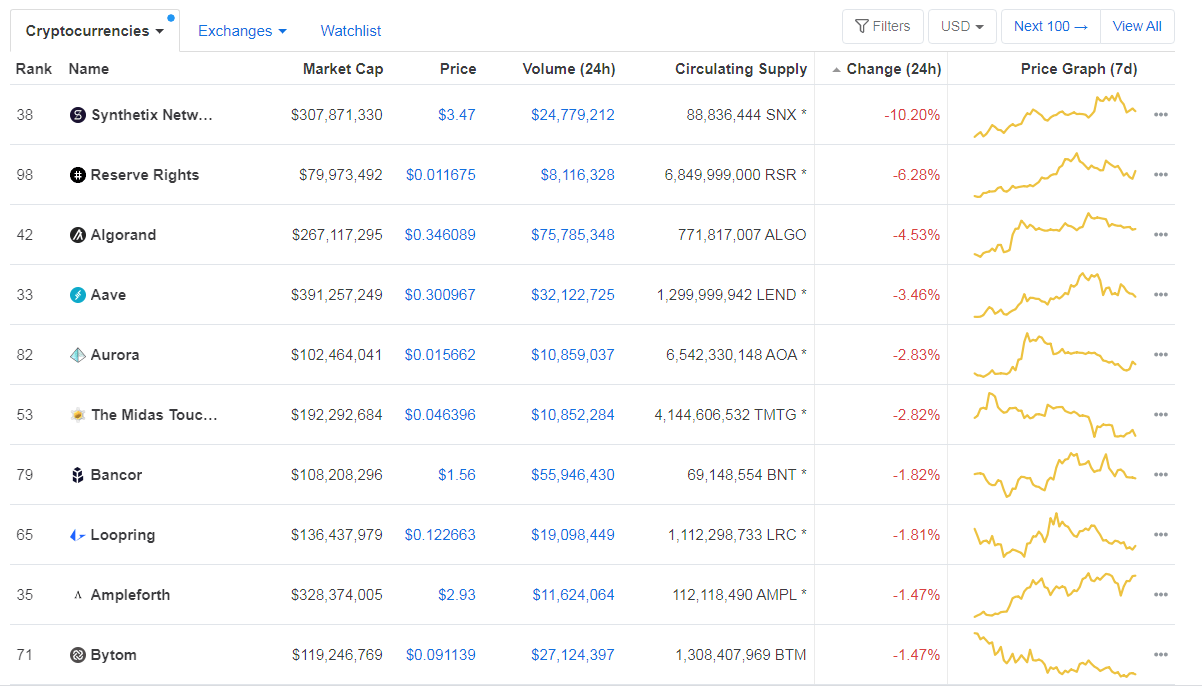
Bottom 10 24-hour Performers (Click to enlarge)
Bitcoin’s dominance level stayed at the same level since we last reported, with its value currently at 62.79%. This value represents a 0.04% difference to the downside when compared to Friday’s value.
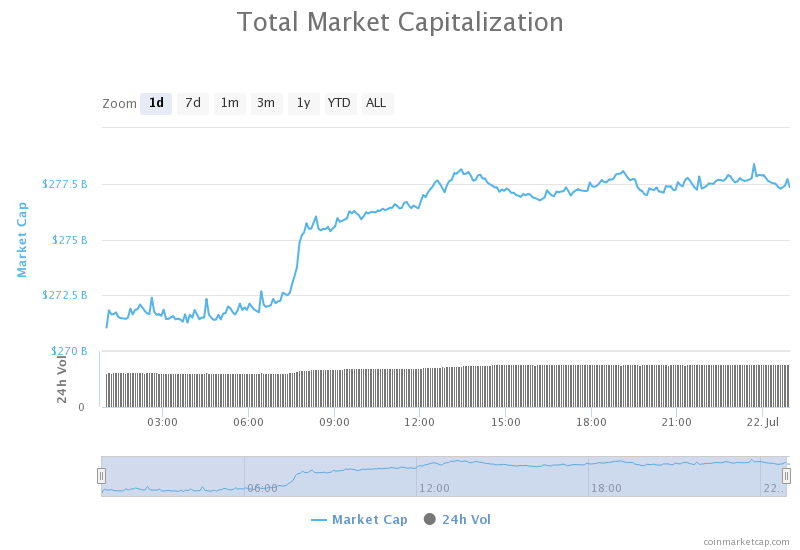
Daily Crypto Market Cap Chart
The cryptocurrency market capitalization increased slightly when compared to when we last reported, with the market’s current value being $277.53 billion. This value represents an increase of $1.98 billion when compared to the value it had on yesterday.
_______________________________________________________________________
What happened in the past 24 hours?
_______________________________________________________________________
- Bitcoin Futures Pass $1B in Open Interest on BitMEX for First Time Since March Crash (Coindesk)
- Ethereum Now Settles More Value Than Bitcoin Thanks to Stablecoins (Cryptobriefing)
- eToro: Crypto “finally” has a use case, and it’s not DeFi or Bitcoin (Cryptoslate)
- Zcash Privacy Back in Question after User Traces Shielded Transaction (Cryptobriefing)
- China’s Blockchain Infrastructure to Extend Global Reach With Six Public Chains (Coindesk)
- Larry Cermak breaks down why the Twitter hackers are amateurish (The Block)
- US State of Texas Saddles Up to Become the Next Blockchain Capital (Cointelegraph)
- Robinhood’s crypto head is no longer with the brokerage firm (The Block)
- BlockFi eyeing $50 million Series C following period of strong growth in institutional lending (The Block)
- Federal Reserve Bank of Boston’s Bench says the U.S.’ better be ready’ for a future digital currency issuance (The Block)
_______________________________________________________________________
Technical analysis
_______________________________________________________________________
Bitcoin
The largest cryptocurrency by market capitalization spent the day furthering yesterday’s strides towards $9,580, and ultimately $10,000. However, with volume fading as well as RSI stepping into the overbought territory, it is unlikely that Bitcoin will pass $9,580 without consolidation.
BTC traders should look for a trade opportunity after bitcoin loses bull presence or after it passes $9,580.
BTC/USD 4-hour Chart
Technical factors:
- Price is above its 50-period EMA and its 21-period EMA
- Price at its top B.B.
- RSI is overextended (69.87)
- Increased volume (descending)
Key levels to the upside Key levels to the downside
1: $9,580 1: $9,251
2: $9,735 2: $9,120
3: $9,870 3: $8,980
Ethereum
Ethereum continued on its path towards the upside in the past 24 hours. The second-largest cryptocurrency by market cap established its presence above $240 and pushed towards $251. However, the bullish presence is fading, and Ethereum is losing its momentum towards the upside.
Ethereum traders should look for an opportunity in searching for pullbacks.
ETH/USD 4-hour Chart
Technical Factors:
- Price is above the 50-period EMA and the 21-period EMA
- Price at the top B.B.
- RSI elevated (68.02)
- One candle volume spike (rest is average)
Key levels to the upside Key levels to the downside
1: $251.4 1: $240
2: $260 2: $228
3: $278 3: $225.4
Ripple
The third-largest cryptocurrency by market cap spent another day trading in a sideways manner. Its moves are bound by the $0.19 support level and (more often) $0.2 resistance level. XRP’s next move will most likely be determined by Bitcoin’s move (in any direction).
XRP traders can look for an opportunity to trade when the currency breaks $0.2 with increased Volume, or falls down below $0.19 with increased volume.
XRP/USD 4-hour Chart
Technical factors:
- XRP in a mid-term descending trend (though it broke the trend in the short-term)
- XRP lacks strong support levels below $0.178
- Price above 21-period and the 50-period EMA
- Price slightly above middle B.B. (20-period SMA)
- RSI is neutral (53.58)
- Average/slightly low Volume
Key levels to the upside Key levels to the downside
1: $0.2 1: $0.19
2: $0.205 2: $0.178
3: $0.214
Related posts
 Daily Crypto Review, Feb 10 – Bitcoin fighting to regain $10,000 after a sudden crash occurs
 Daily Crypto Review, Feb 17 – Altcoins take a dive as Bitcoin drops under $10,000; Craig Wright suing BTC and BCH?
 Daily Crypto Review, Feb 24 – New Jersey regulating crypto?
 Daily Crypto Review, Feb 28 – CFTC approaching stablecoin projects; Crypto market preparing for a move