
The cryptocurrency market spent the day trying to reach past its immediate resistance levels. Bitcoin is currently trading for $9,330, which represents an increase of 1.31% on the day. Meanwhile, Ethereum gained 1.26% on the day, while XRP gained 0.28%.

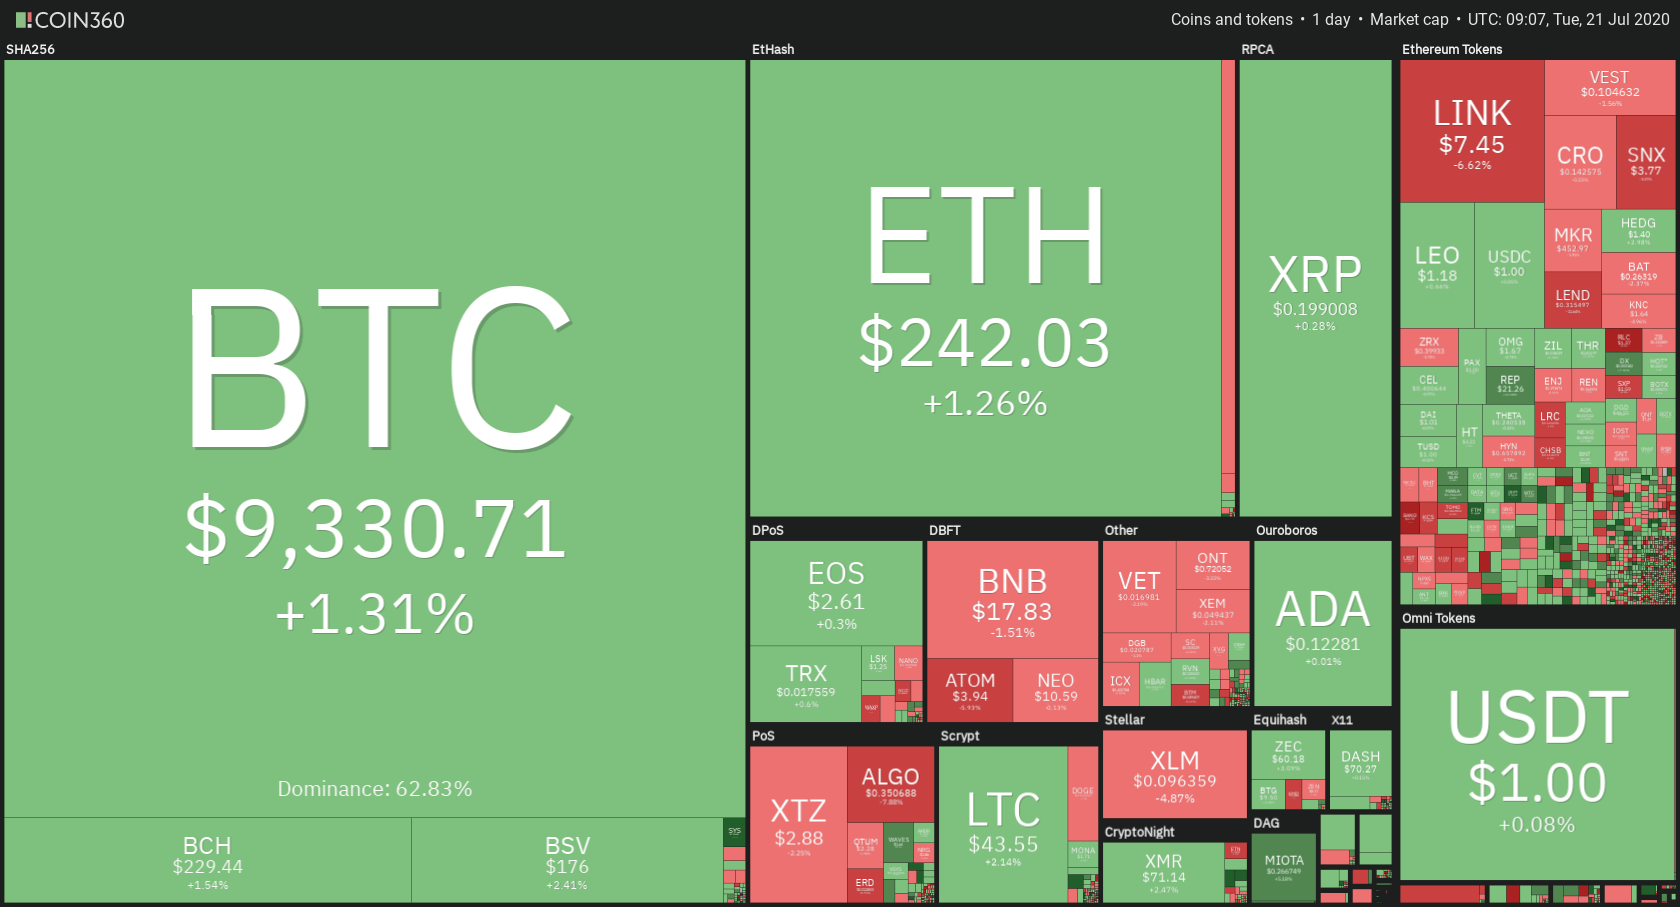
Daily Crypto Sector Heat Map
When talking about top100 cryptocurrencies, Augur gained 11.37% on the day, making it the most prominent daily gainer. Waves (11.36%) and DxChain Token (6.32%) also did great. On the other hand, Band Protocol has lost 19.85%, making it the most prominent daily loser. It is followed by Kava’s loss of 17.94% and iExec RLC’s loss of 16.09%.
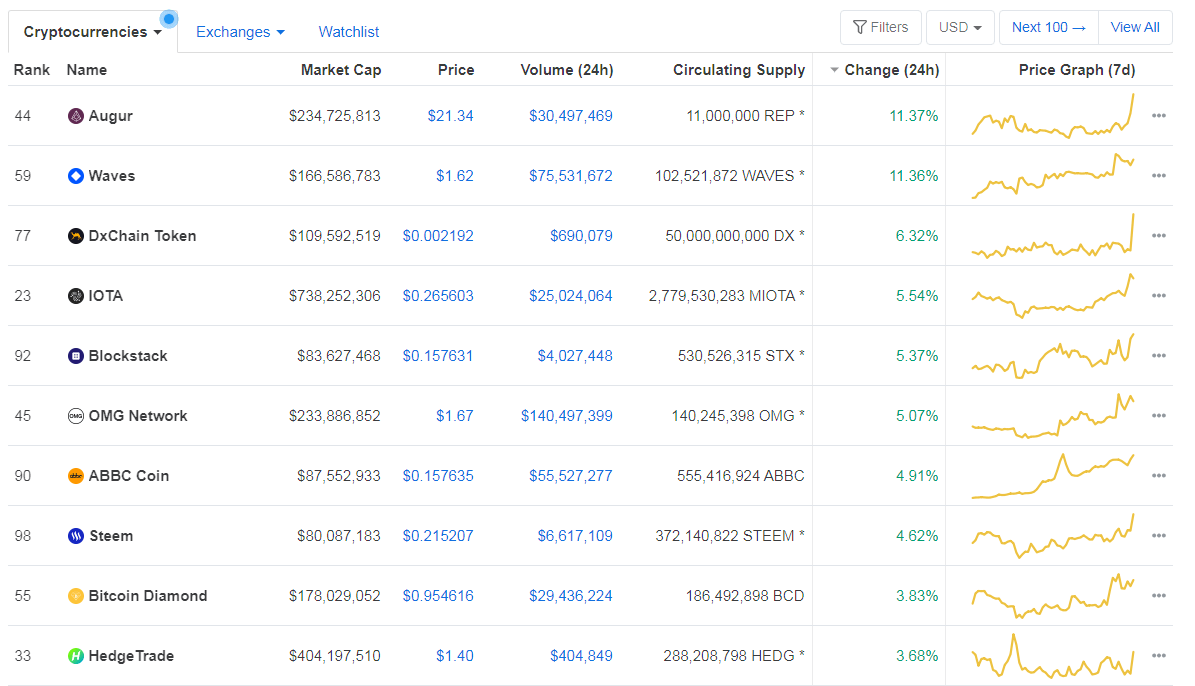
Top 10 24-hour Performers (Click to enlarge)
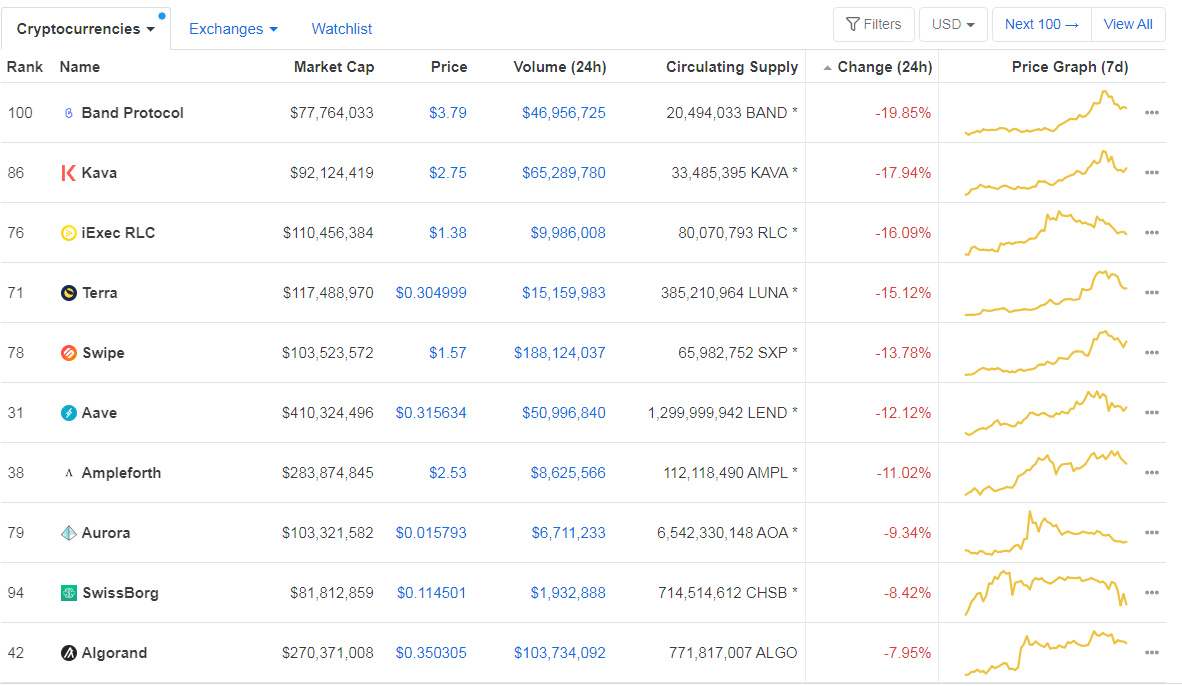
Bottom 10 24-hour Performers (Click to enlarge)
Bitcoin’s dominance level increased slightly since we last reported, with its value currently at 62.83%. This value represents a 0.33% difference to the upside when compared to Friday’s value.
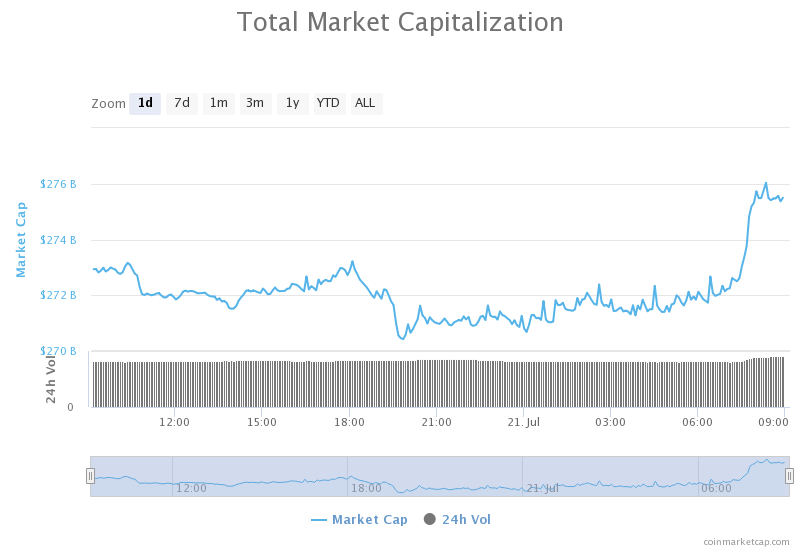
Daily Crypto Market Cap Chart
The cryptocurrency market capitalization increased slightly when compared to when we last reported, with the market’s current value being $275.58 billion. This value represents an increase of $2.89 billion when compared to the value it had on yesterday.
_______________________________________________________________________
What happened in the past 24 hours?
_______________________________________________________________________
- After Banning Crypto in 2018, Mastercard Is Now Bullish on Bitcoin (Cryptobriefing)
- What Ant Group’s massive IPO might mean for digital currency and blockchains (The Block)
- Grayscale Receives FINRA Approval for BCH and LTC to Trade Publicly (Cointelegraph)
- Paxos Beats Out Coinbase to Become PayPal’s Bitcoin Custodian (Cryptobriefing)
- Coinbase and other crypto exchanges are designing a P2P system for sharing user info under FATF rules (The Block)
- Tether CTO: ‘USDT Will Continue to Exist Alongside CBDCs’ (Cointelegraph)
- CME futures traders widely bearish on Bitcoin as a big movement looms (Cryptoslate)
- The biggest thing since Bitcoin? New AI protocol scares Twitter users (Cryptoslate)
- Japan: Bitcoin-friendly central bank creates digital currency division (Cryptoslate)
- South African crypto exchange VALR raises $3.45 million in Series A funding (The Block)
_______________________________________________________________________
Technical analysis
_______________________________________________________________________
Bitcoin
The largest cryptocurrency by market capitalization spent the day contesting and poking the $9,251 resistance level until a large spike caused by an increase in bear presence brought its price to $9,380. Bitcoin passed $9,251 instantly, but could not reach $9,580. It is currently trying to stabilize at around $9,330.
BTC traders should look for a trade opportunity after bitcoin establishes its position.
BTC/USD 4-hour Chart
Technical factors:
- Price is above its 50-period EMA and its 21-period EMA
- Price above the top B.B.
- RSI is overextended (69.86)
- Increased volume
Key levels to the upside Key levels to the downside
1: $9,580 1: $9,251
2: $9,735 2: $9,120
3: $9,870 3: $8,980
Ethereum
Ethereum accompanied Bitcoin on its slow path towards the upside, but with its own little twist. While the upswings were much more explosive, the downswings were slower and less volatile. Ethereum reached past $240, which is where it is consolidating at the moment. The start of the explosive move got supported by the influx of buyers as well as the 21-period and 50-period moving averages, which were right at the bottom of the candle.
Ethereum traders should look for an opportunity when Ethereum confirms that it will stay above $240, or when it fails to do so.
ETH/USD 4-hour Chart
Technical Factors:
- Price is above the 50-period EMA and the 21-period EMA
- Price above the top B.B.
- RSI elevated (67.20)
- Slightly increased volume
Key levels to the upside Key levels to the downside
1: $240 1: $228
2: $251.4 2: $225.4
3: $260 3: $218
Ripple
The third-largest cryptocurrency by market cap, unlike Bitcoin and Ethereum, had a pretty slow day. XRP hovered around the $0.2 resistance level, but could not break it. The inability to break this level might come from the steady low volume XRP has. For the time being, XRP will continue to trade stuck in a range, bound by support level of $0.19 and resistance level of $0.2.
XRP traders can look for an opportunity to trade when the currency breaks $0.2 with increased volume, or falls down towards $0.19 with increased volume.
XRP/USD 4-hour Chart
Technical factors:
- XRP in a mid-term descending trend (though it broke the trend in the short-term)
- XRP lacks strong support levels below $0.178
- Price above 21-period and the 50-period EMA
- Price between the middle B.B. (20-period SMA) and the top B.B.
- RSI is neutral (56.72)
- Volume average
Key levels to the upside Key levels to the downside
1: $0.2 1: $0.19
2: $0.205 2: $0.178
3: $0.214
Related posts
 Daily Crypto Review, Oct 13 – G7 Will Continue to Oppose Libra; Bitcoin Consolidating After Another Bull Run
 Daily Crypto Review, Oct 15 – JP Morgan Says Bitcoin is Overvalued; XRP Crashes As it Breaks Major Support
 Daily Crypto Review, Oct 16 – ICO That Raised $257 Million in 60 Minutes Finally Launched; Bitcoin Pushing Towards $11,500
 Daily Crypto Review, Oct 19 – Stablecoin Market Surpasses $20 Billion; Tether Dominating With Market Cap of Almost $16 Billion