
The cryptocurrency sector was full of volatility today but ended the day with close to no gains. Bitcoin is currently trading for $13,561, representing an increase of 2.50% on the day. Meanwhile, Ethereum gained 0.01% on the day, while XRP lost 1.12%.

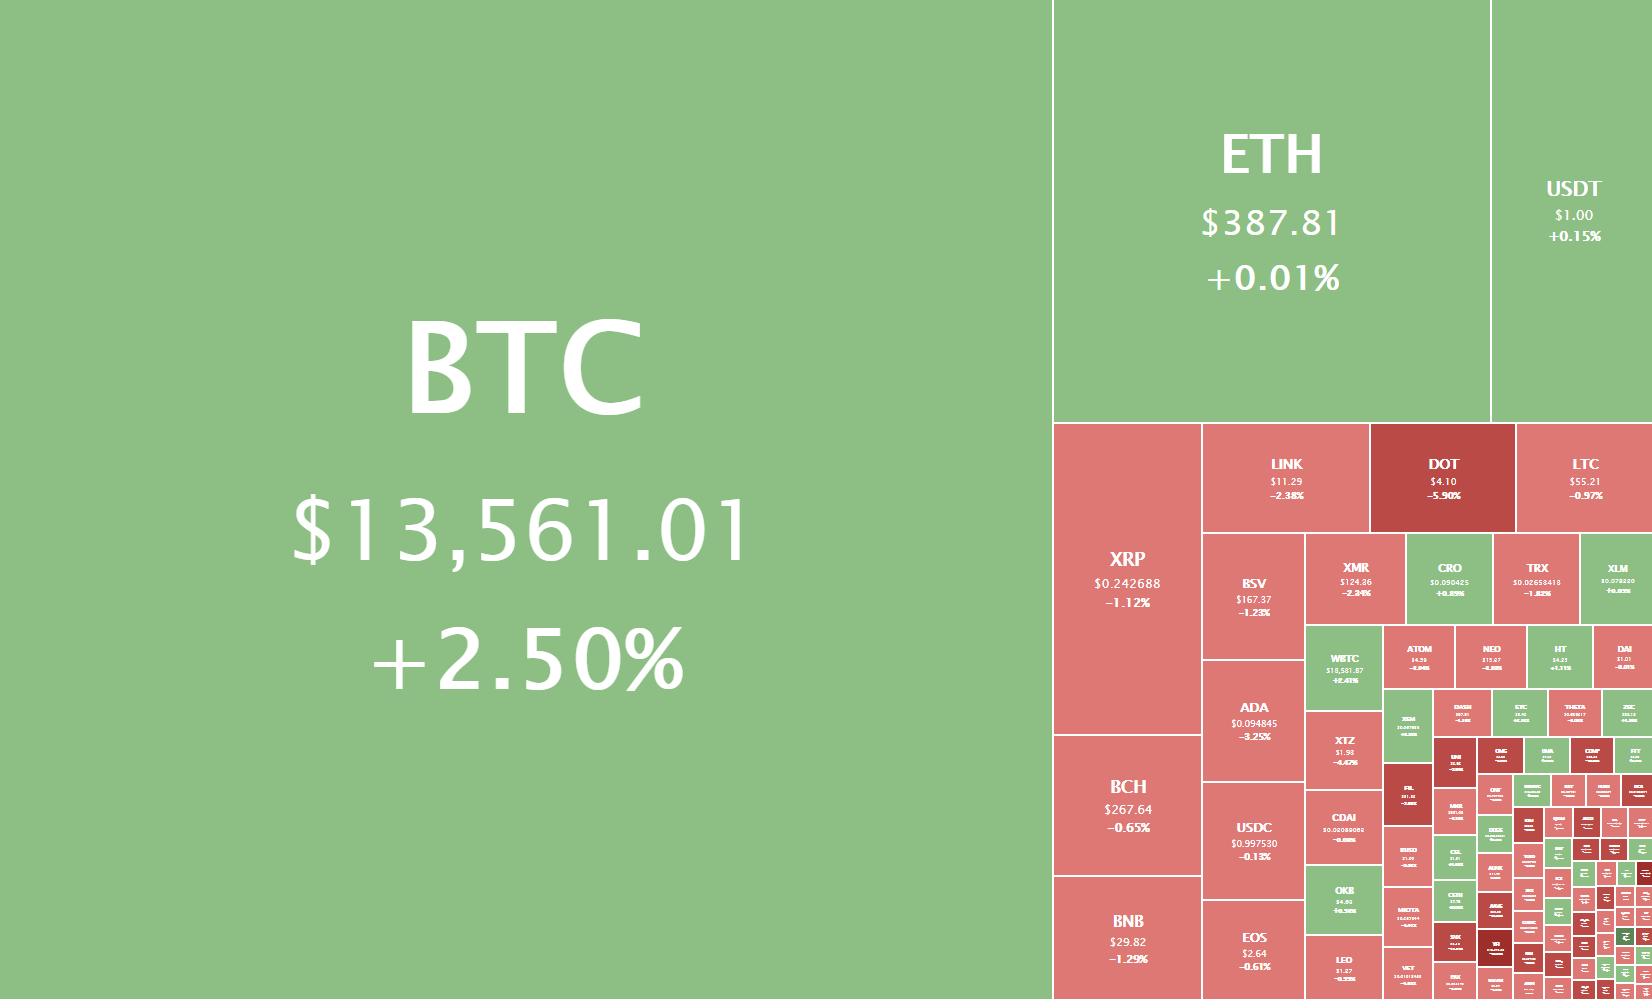
Daily Crypto Sector Heat Map
None of the top100 cryptocurrencies gained much over the course of the day. NEM gained 3.57% in the past 24 hours, making it the crypto to gain the most in a day. Celsius (2.68%) and FTX Token (2.63%) also did great. On the other hand, yearn.finance lost 16.68%, making it the most prominent daily loser. It is followed by Ocean Protocol’s loss of 16.06% and Reserve Rights’ loss of 15.74%.
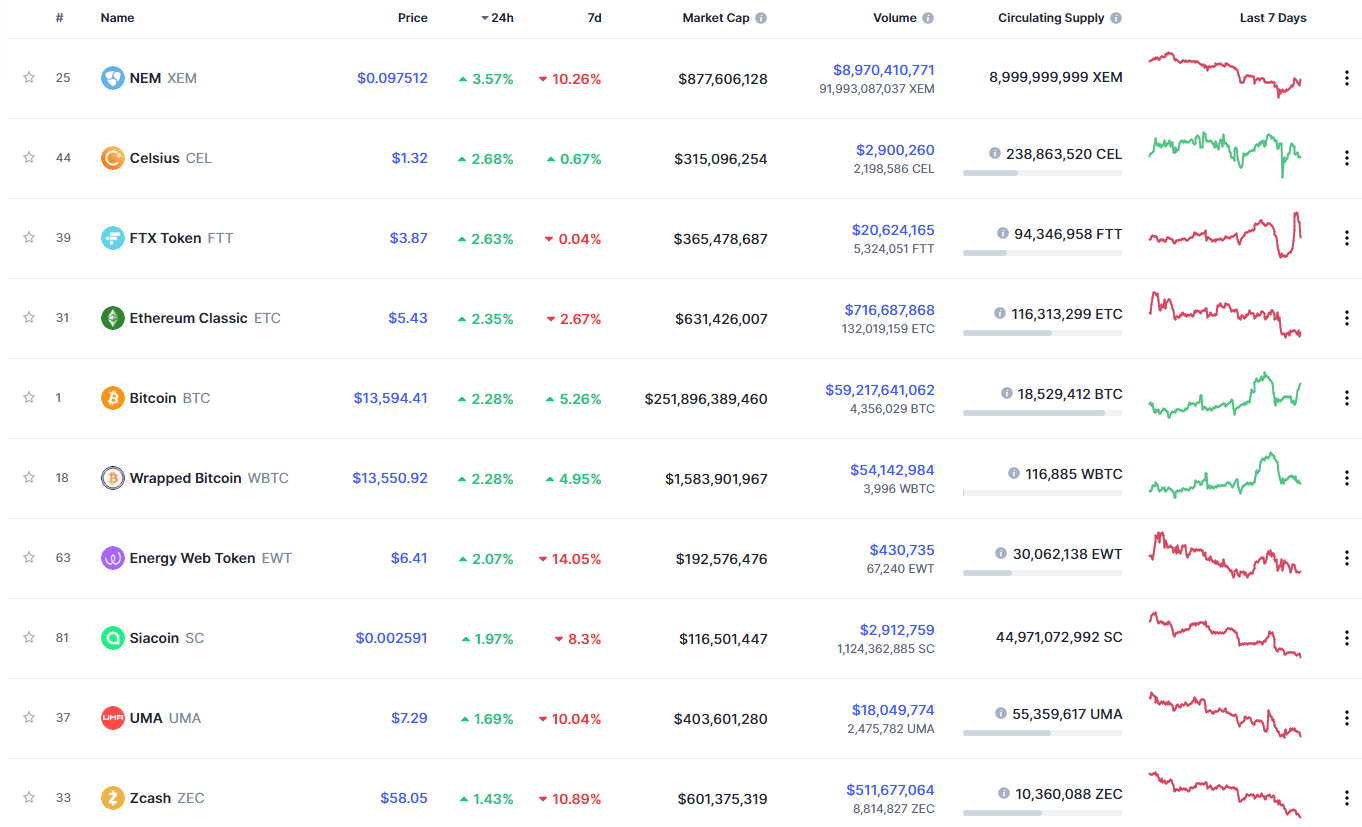
Top 10 24-hour Performers (Click to enlarge)
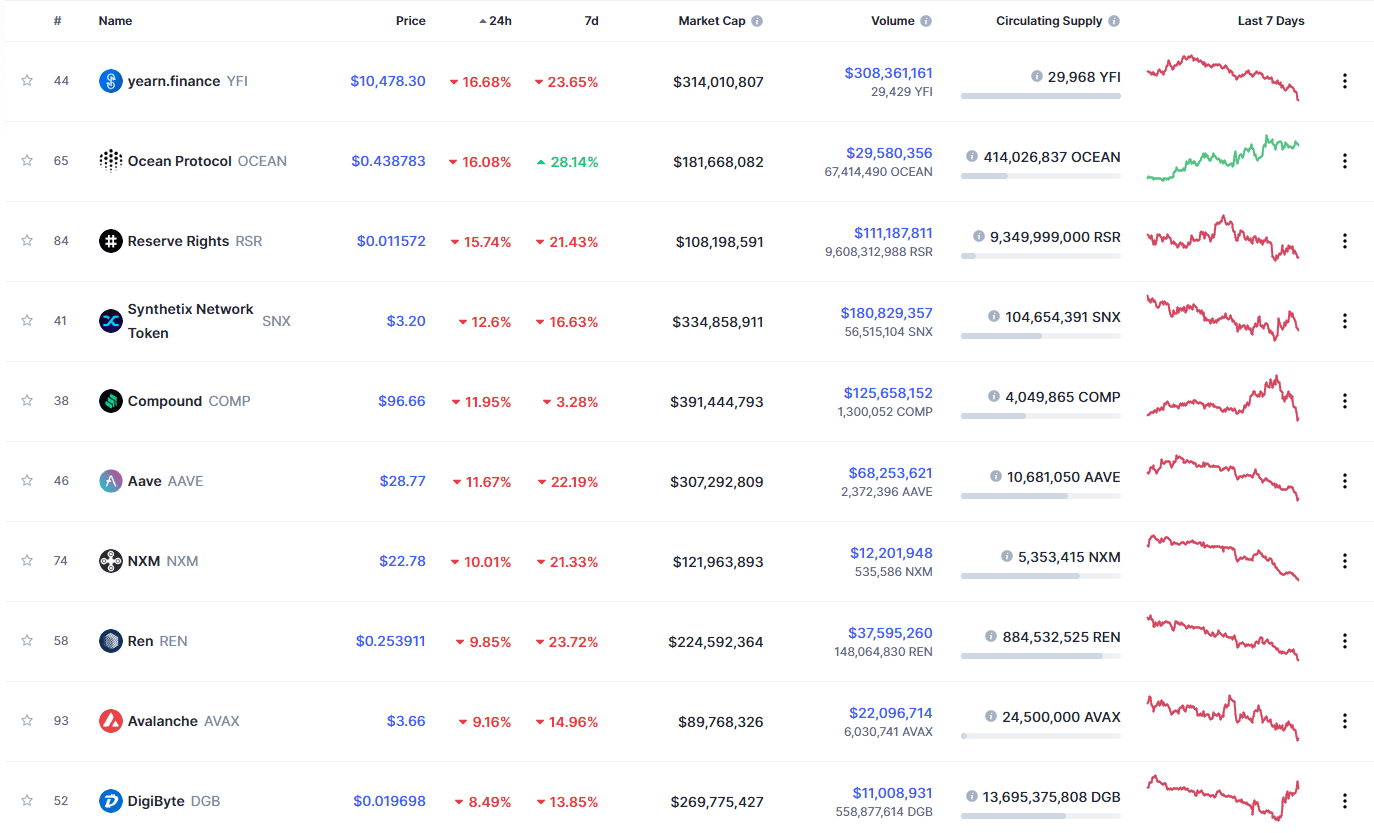
Bottom 10 24-hour Performers (Click to enlarge)
Bitcoin’s market dominance level had increased since we last reported, with its value is currently 63.1%. This value represents a 0.8% difference to the upside when compared to when we last reported.
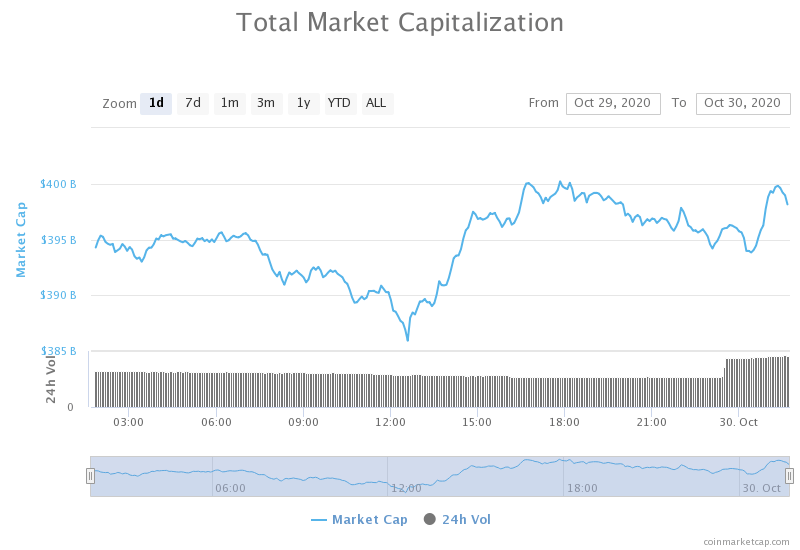
Daily Crypto Market Cap Chart
The crypto sector capitalization has increased slightly in the past 24 hours. Its current value is $399.63 billion, representing a $6.58billion increase compared to our previous report.
_______________________________________________________________________
What happened in the past 24 hours?
_______________________________________________________________________
- Crypto Exchange FTX Launches Tesla, Amazon Stock Trading (Cryptobriefing)
- Bitcoin Hash Rate Drops as Chinese Miners Hunt for Cheaper Power (Cryptobriefing)
- Monero is Outpacing Litecoin and Bitcoin Cash as a Payment Crypto (Cryptobriefing)
- Chainlink oracles to bolster AML measures for Coinfirm’s DeFi solution (Cryptoslate)
- Forbes: Leaked document details Binance plan to avoid U.S. regulatory scrutiny (The Block)
- Uniswap’s $40M Governance Vote Closes on Halloween and Some UNI Holders Fear for Price (Coindesk)
- Tax professional reveals the most important thing for crypto holders from the US (Cointelegraph)
- Chinese city seeks to power its governance and more using blockchain tech (Cointelegraph)
- Japan is currently the ‘leading candidate’ for Ripple’s new headquarters (Cointelegraph)
- Declining DEX volumes reflect investors’ shift to Bitcoin, data shows (Cointelegraph)
_______________________________________________________________________
Technical analysis
_______________________________________________________________________
Bitcoin
The largest cryptocurrency by market capitalization had quite a volatile day, with its price bouncing back from the $13,180 resistance and pushing up. While the price has reached ~$13,700 level, it has pulled back since, currently contesting the $13,570 resistance.
Traders should look at Bitcoin contesting the $13,570 level and trade in whichever direction the price confirms its move in.
BTC/USD 4-hour Chart
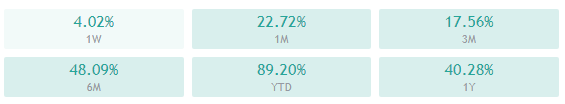
Bitcoin’s 4-hour and weekly overviews are neutral bullish, while its daily and monthly overviews are tilted towards the buy-side with close to no neutrality.
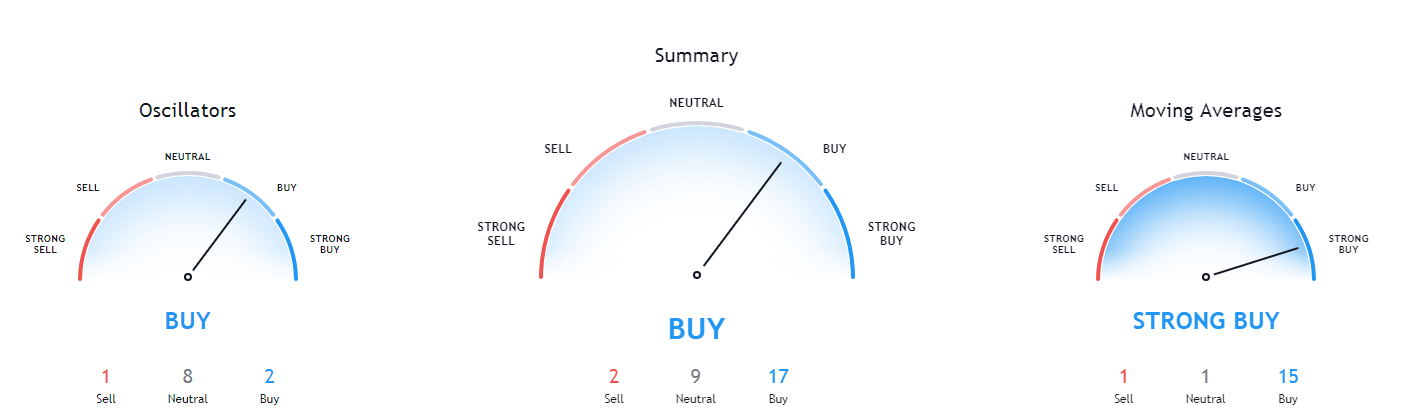
BTC/USD 1-day Technicals
Technical factors (4-hour Chart):
- Price is far above its 50-period EMA and above its 21-period EMA
- Price slightly above its middle Bollinger band
- RSI is ascending towards overbought (59.94)
- Volume is slightly above average
Key levels to the upside Key levels to the downside
1: $13,570 1: $13,180
2: $13,900 2: $12,870
3: $14,000 3: $12,500
Ethereum
Ethereum had, just like Bitcoin, quite a volatile day today. Its price first bounced off of the ascending channel bottom line, which prompted a push towards $395 before falling yet again. As things stand now, the leg down is still not over yet, and Ethereum is yet to decide whether it will change its course towards the upside or break the channel down.
Traders should look for Ethereum’s response to the bottom channel line and trade in continuation to where it chooses to go.
ETH/USD 4-hour Chart
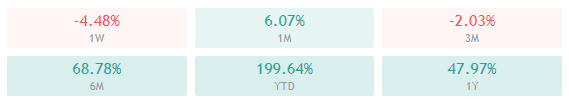
Ethereum’s technicals on all time-frames except for the 4-hour one are tilted towards the buy-side, with hints of neutrality. On the other hand, its 4-hour time-frame is tilted towards the sell-side with slight hints of neutrality.
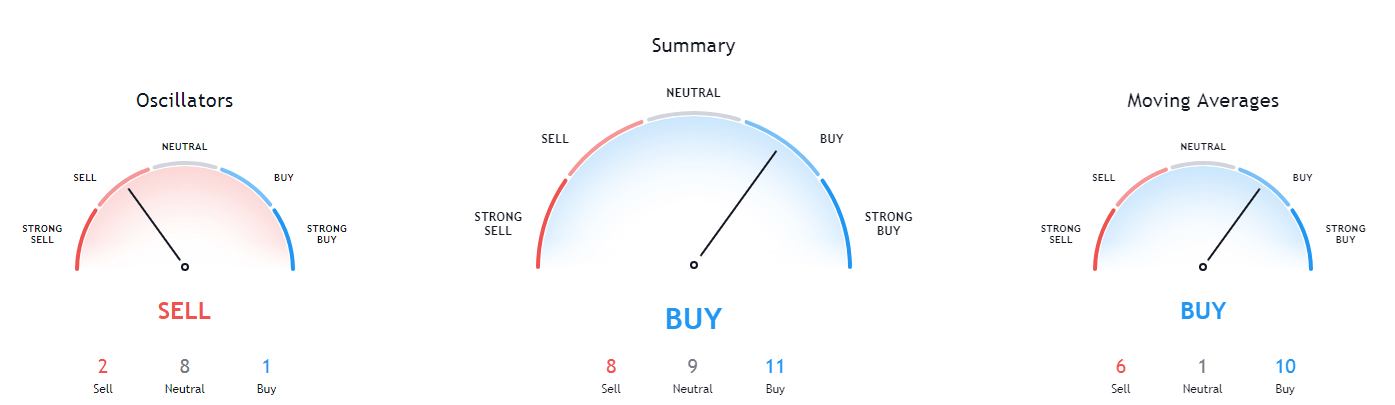
ETH/USD 1-day Technicals
Technical Factors (4-hour Chart):
- The price is below its 50-period and its 21-period EMA
- Price is between its middle and bottom Bollinger band
- RSI is neutral (40.64)
- Volume is slightly above average
Key levels to the upside Key levels to the downside
1: $400 1: $378
2: $415 2: $371
3: $420 3: $361
Ripple
The fourth-largest cryptocurrency by market cap had a bad day, as its price dropped below the crucial $0.2454 support level. XRP tried to recover and went above it at one point but failed to keep the price above the level, therefore triggering another push towards $0.24, where it is currently consolidating.
It is hard to say how traders should look at XRP, though the outlook is certainly bearish. Any push towards the upside will almost certainly result from Bitcoin making a large move towards the upside.
XRP/USD 4-hour Chart
XRP’s technicals are uniformed in its bearishness, with the 1-day and monthly overviews showing a bit more neutrality than the others.

XRP/USD 1-day Technicals
Technical factors (4-hour Chart):
- The price well below both its 50-period EMA and its 21-period EMA
- Price is slightly above its bottom Bollinger band
- RSI is near oversold (35.97)
- Volume is average
Key levels to the upside Key levels to the downside
1: $0.2454 1: $0.235
2: $0.26 2: $0.227
3: $0.266 3: $0.221
Related posts
 Daily Crypto Review, Apr 8 – BCH and BSV halving countdown; Cryptos consolidating after a move up
 Daily Crypto Review, August 11 – yEarn Finance Token Explodes After Binance Listing; BTC Hashrate Unaffected by the Price Upswing
 Daily Crypto Review, August 20 – ETH Plummets Due To Skyrocketing Transaction Fees; $12,000 Level Too Strong For Bitcoin
 Daily Crypto Review, Dec 18 – Bitcoin at $23,000; Crypto Sector Preparing for the Next Move