
While most of the top cryptos had a slightly red day, Ethereum tokens mostly did great. Bitcoin is currently trading for $11,732, which represents a decrease of 0.25% on the day. Meanwhile, Ethereum lost 1.26% on the day, while XRP lost 1.24%.

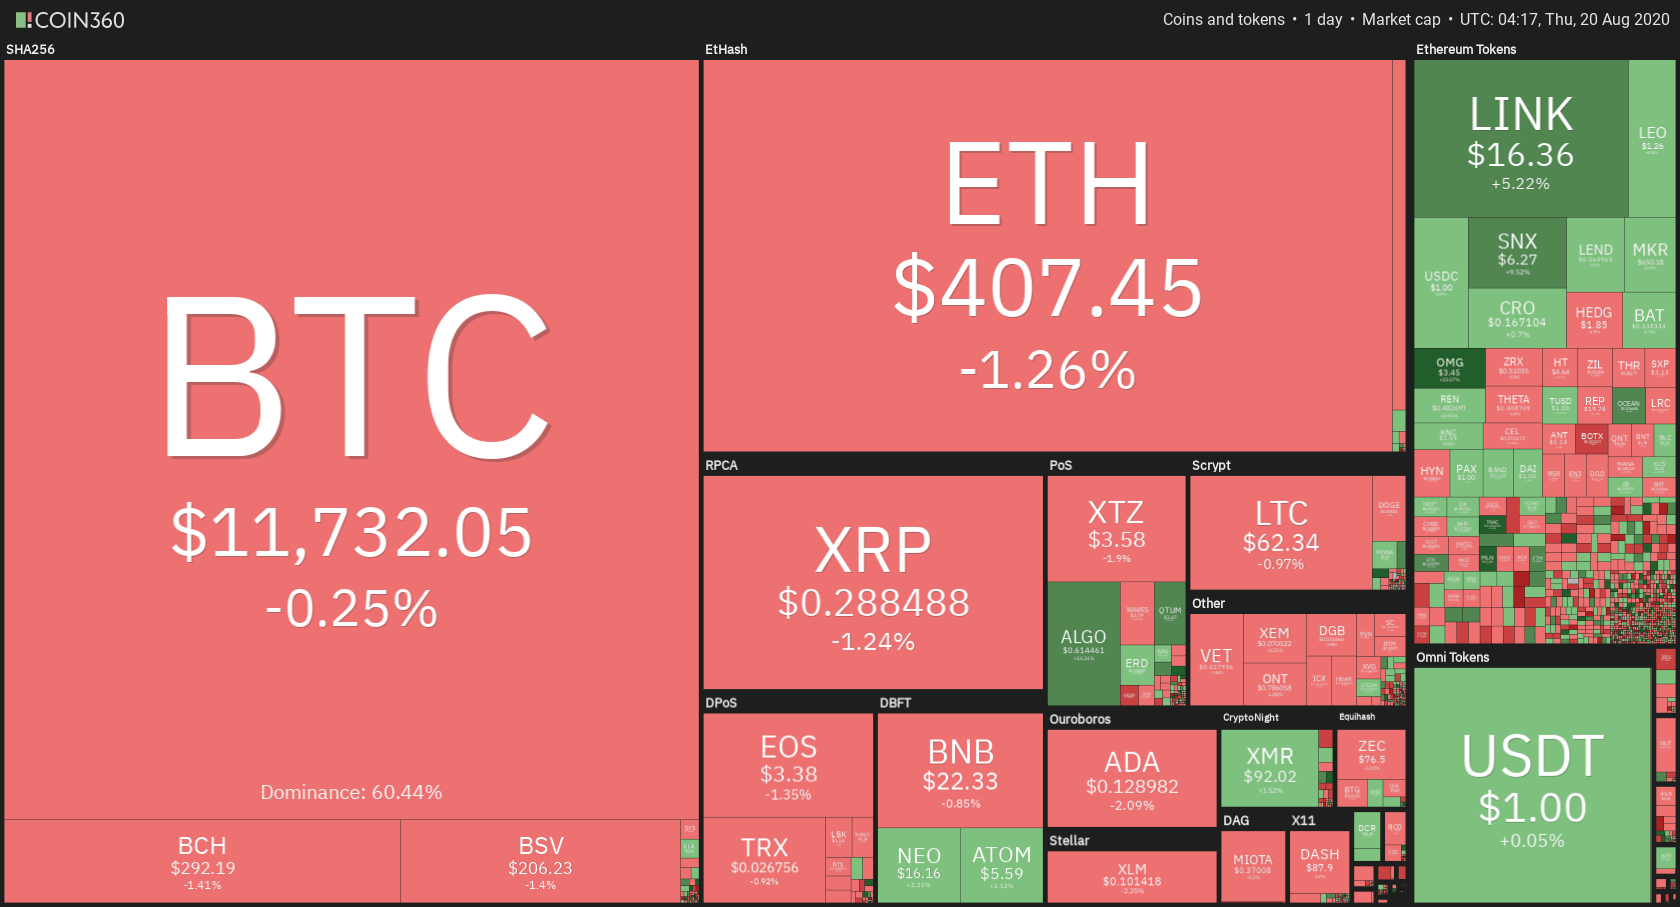
Daily Crypto Sector Heat Map
When taking a look at top100 cryptocurrencies, OMG Network gained 26.67% on the day, making it the most prominent daily gainer. yearn.finance (20.13%) and Qtum (10.04%) also did great. On the other hand, Balancer lost 19.84%, making it the most prominent daily loser. It is followed by Compound’s loss of 9.50% and Waves’ drop of 8,97%.
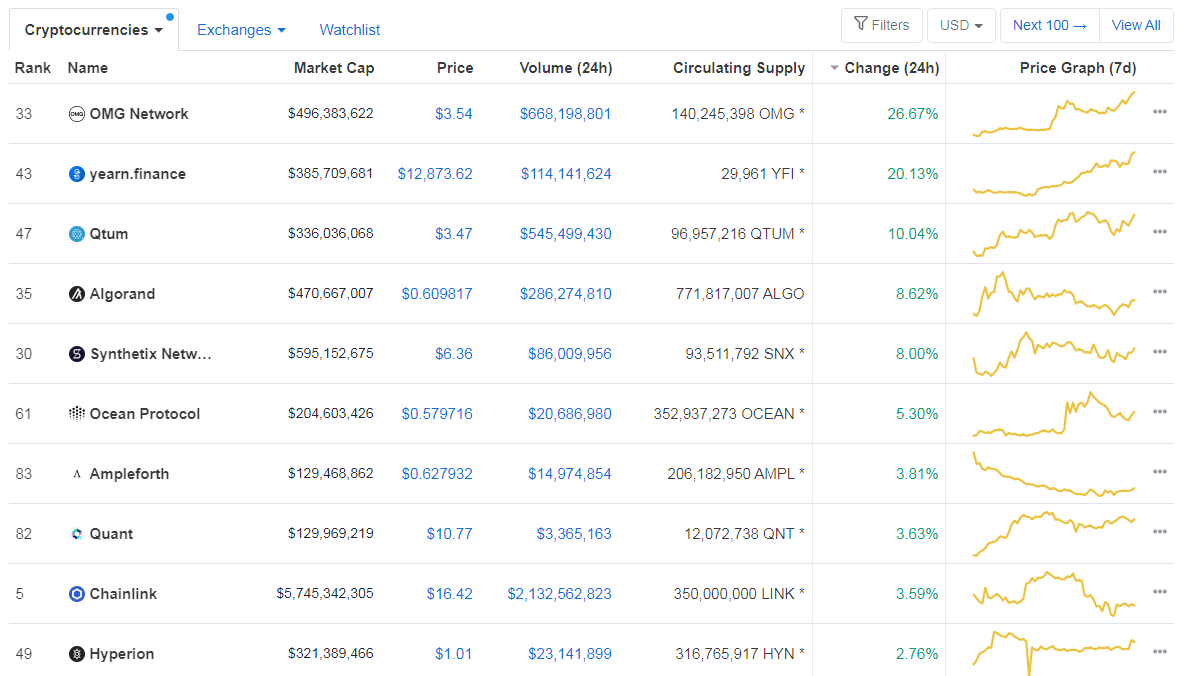
Top 10 24-hour Performers (Click to enlarge)
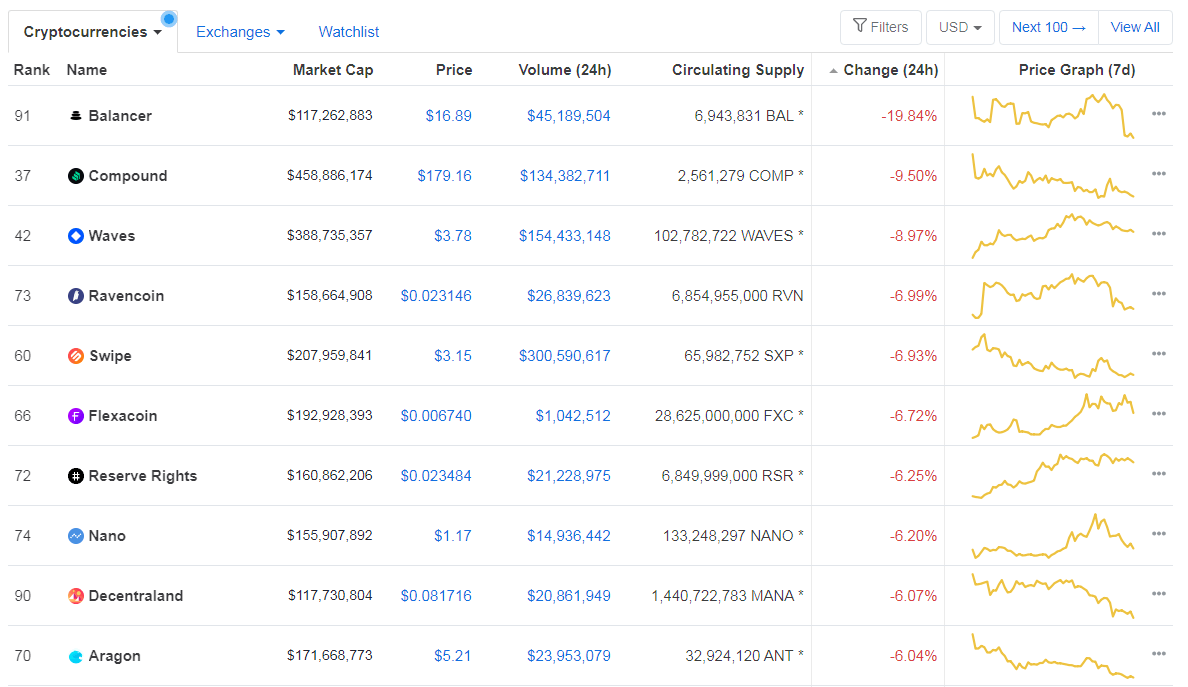
Bottom 10 24-hour Performers (Click to enlarge)
Bitcoin’s dominance level has increased slightly and passed the 60% mark, with its value currently at 60.44%. This value represents a 0.77% difference to the upside when compared to our last report.
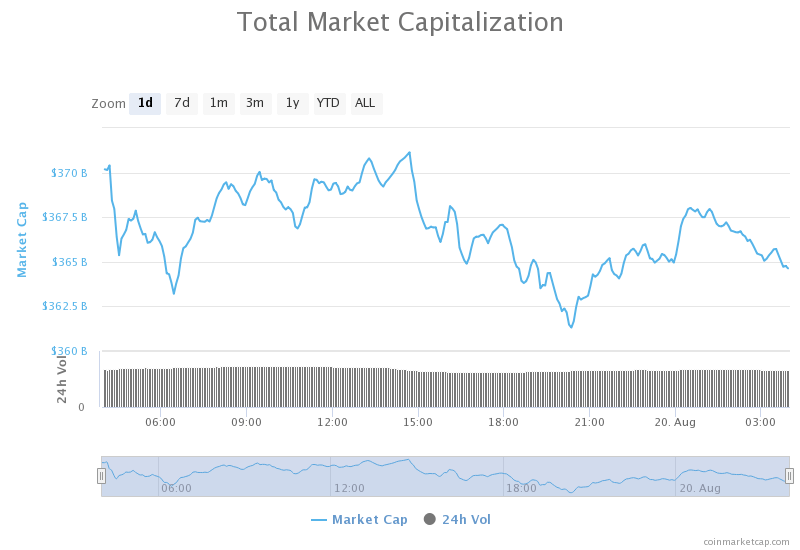
Daily Crypto Market Cap Chart
The cryptocurrency market cap experienced a slight increase in value over the course of the day. Its current value is $364.76 billion, which represents an increase of $0.56 billion when compared to our previous report.
_______________________________________________________________________
What happened in the past 24 hours?
_______________________________________________________________________
- High Ethereum Fees Push Tether to Its Eighth Blockchain, OMG Network (Coindesk)
- Market Wrap: Bitcoin Sinks to $11.6K as Ether’s Gas Keeps Rising (Coindesk)
- Litecoin has massive fundamentals lined up ahead, says Charlie Lee (Cryptoslate)
- Investors pour in $400 million into YAM, a “dead” Ethereum DeFi project (Cryptoslate)
- Bitcoin derivatives data shows the institutional “herd” is finally here: fund manager (Cryptoslate)
- Coinbase Announces Four Key Requirements for Listing DeFi Tokens (Cryptobriefing)
- Roger Ver Tells Disgruntled Bitcoin Cash Faction to Buy Dash (Cryptobriefing)
- UK regulator adds Gemini to list of registered firms (The Block)
- John McAfee Has Left His Own Privacy Asset Project (Cointelegraph)
- IOTA’s Chrysalis Upgrade Turbocharges Network Speeds 50x (Cointelegraph)
_______________________________________________________________________
Technical analysis
_______________________________________________________________________
Bitcoin
After a brief break of the $12,000 level, Bitcoin fell down and is controlled by BTC bears for the second day in a row. The largest cryptocurrency by market cap has moved towards the $11,630 support level (as we said in our previous article) and tried to test its strength. The level held up, and Bitcoin is now consolidating right above it.
This bear push was caused by several factors, but mostly because of the immense resistance at around $12,000 and the challenges Ethereum faces with its incredibly high transaction fees (Bitcoin acts as a “representative” to all the cryptos, so it affects others, but is also affected by others).
BTC traders should be looking for a trade when Bitcoin breaks $11,630 to the downside or pushes towards $12,000 again.
BTC/USD 4-hour Chart
Technical factors:
- Price is below its 50-period EMA and its 21-period EMA
- Price is between its lower and middle band
- RSI is slightly tilted towards the oversold area (41.97)
- Volume is average
Key levels to the upside Key levels to the downside
1: $12,015 1: $11,630
2: $12,300 2: $11,460
3: $12,900 3: $11,090
Ethereum
Even though Ethereum’s social sentiment is still extremely high due to the craze over DeFi, it is a fact that ETH’s transaction fees have been skyrocketing as the demand for DeFi increased. This fact, along with Bitcoin not being able to break the $12,000 mark, caused the second-largest cryptocurrency by market cap to drop below its $415 support level (now resistance). The drop stopped around $400 and changed direction, trying to retake its previous highs. However, the $415 resistance level confirmed its strength, leaving ETH below it.
Ethereum traders should look for a trade when ETH breaks $415 to the upside.
ETH/USD 4-hour Chart
Technical Factors:
- Price is currently below its 21-period and its 50-period EMA
- Price is slightly above its lower band
- RSI is descending (39.54) and approaching oversold levels
- Volume is average
Key levels to the upside Key levels to the downside
1: $415 1: $400
2: $445 2: $361
3: $496 3: $340
Ripple
XRP has had quite a bad day, as it essentially nullified any previous moves towards the upside. The third-largest cryptocurrency by market cap dropped to $0.285 levels (and even below it at one point). While the level held up and secured XRP’s position above it, for the time being, XRP does not look like it will make another move towards the upside soon.
Traders can look for a trade when XRP breaks $0.285 to the downside.
XRP/USD 4-hour Chart
Technical factors:
- Price is currently below the 21-period and 50-period EMA
- Price is slightly above the lower band
- RSI is neutral (40.49)
- Volume is descending (though it is slightly elevated)
Key levels to the upside Key levels to the downside
1: $0.31 1: $0.285
2: $0.32 2: $0.266
3: $0.332 3:$0.2454
Related posts
 Daily Crypto Review, Feb 12 – Bitcoin pushing to $11,000? Coronavirus affecting Crypto Mining
 Daily Crypto Review, July 10 – Tether and Bitfinex on Trial for $850 million? Tether Holders: Watch Out!
 Daily Crypto Review, July 13 – Coinbase Working With the US Secret Service; ETH 2.0 Facing Delays
 Daily Crypto Review, Nov 12 – Bitcoin Formed a Triple Top? Ethereum Accidentally Hard Forks
One reply on “Daily Crypto Review, August 20 – ETH Plummets Due To Skyrocketing Transaction Fees; $12,000 Level Too Strong For Bitcoin”
Hopefully ETH is in a retracement once fees are sorted