
The cryptocurrency market spent the weekend mostly rising in price after a semi-severe drop in price. Bitcoin is currently trading for $9,289, which represents an increase of 0.03% on the day. Meanwhile, Ethereum gained 0.59% on the day, while XRP lost 1.03%.

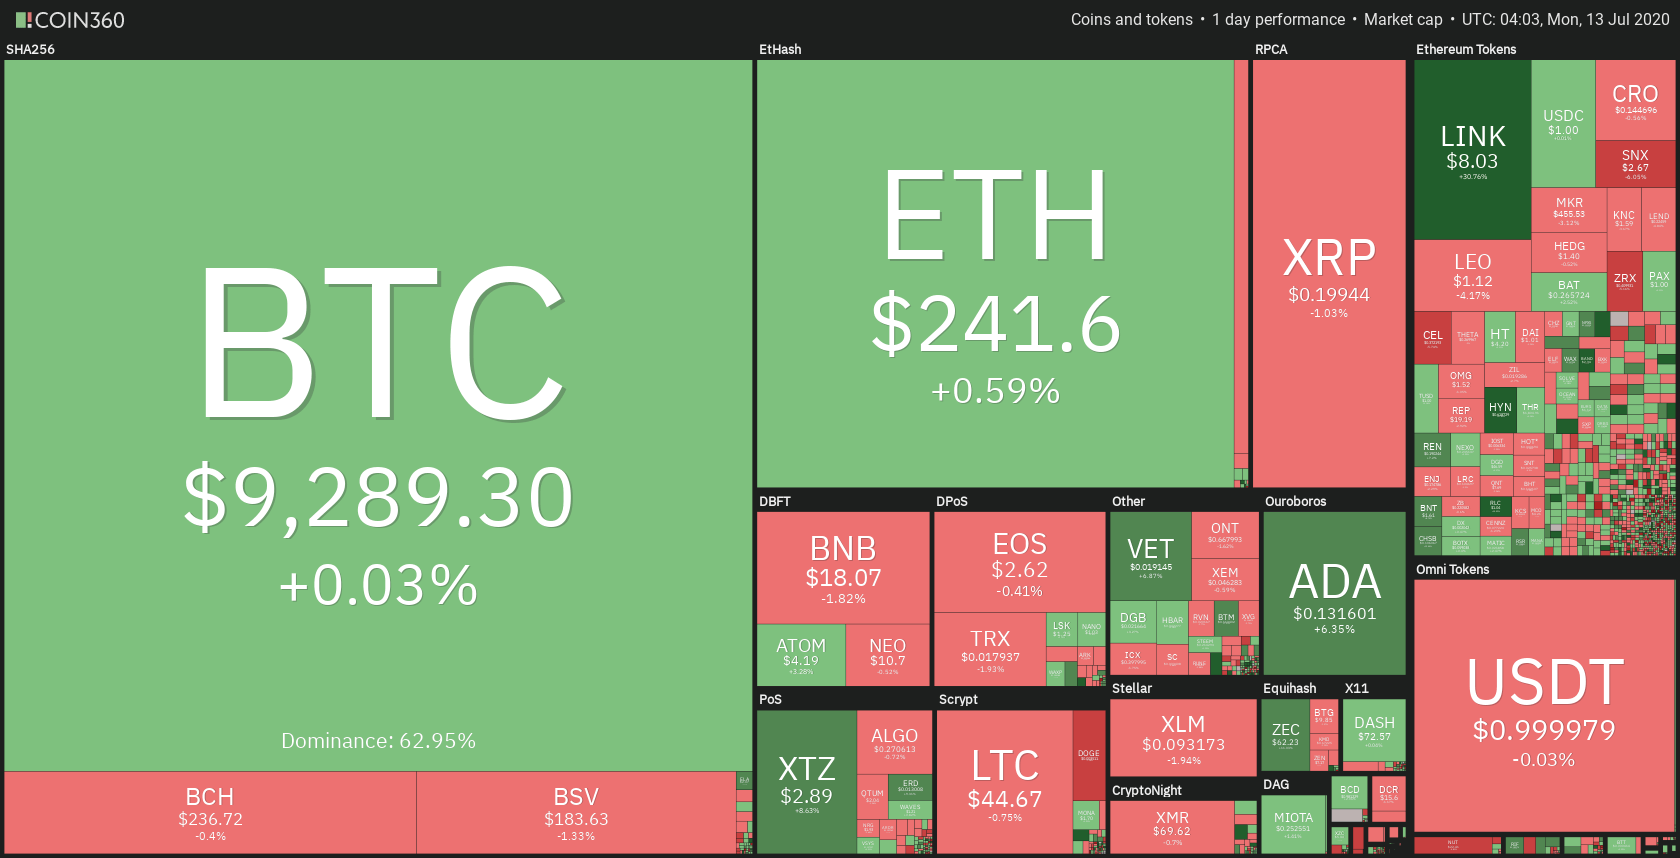
Daily Crypto Sector Heat Map
When talking about top100 cryptocurrencies, iExec RLC gained 17.91% on the day, making it by far the most prominent daily gainer. Chainlink (17.25%) and Elrond (12.52%) also did great. On the other hand, Flexacoin has lost 21.07%, making it the most prominent daily loser. It is followed by UNUS SED LEO’s loss of 6.27% and Celsius’ loss of 6.03%.
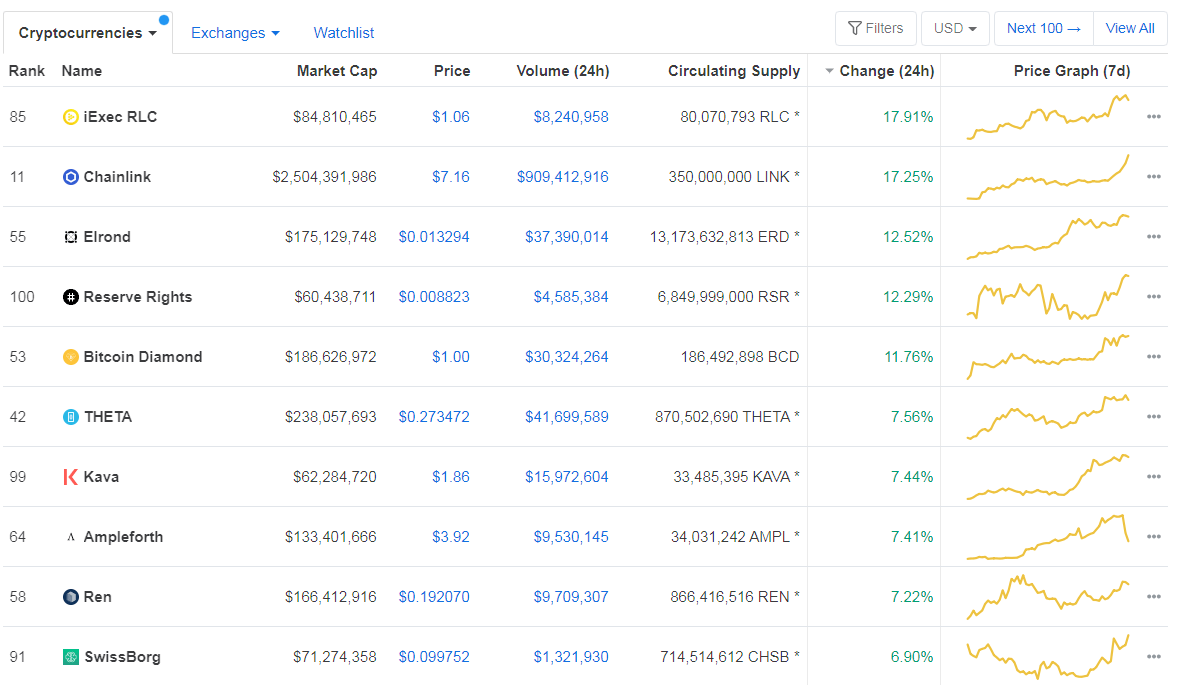
Top 10 24-hour Performers (Click to enlarge)
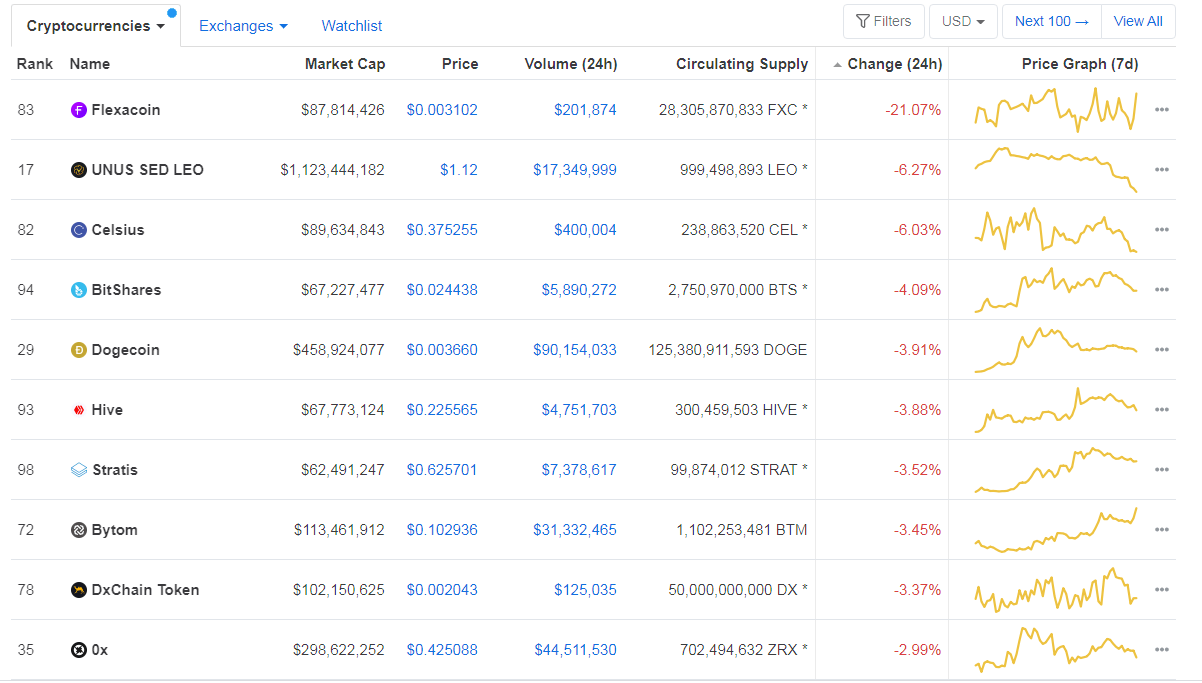
Bottom 10 24-hour Performers (Click to enlarge)
Bitcoin’s dominance level decreased slightly since we last reported, with its value currently at 62.95%. This value represents a 0.34% difference to the downside when compared to Friday’s value.

Daily Crypto Market Cap Chart
The cryptocurrency market capitalization increased slightly when compared to when we last reported, with the market’s current value being $273.87 billion. This value represents an increase of $0.74 billion when compared to the value it had on Friday.
_______________________________________________________________________
What happened in the past 24 hours?
_______________________________________________________________________
- Coinbase is selling blockchain analytics software to the US Secret Service (The Block)
- These charts suggest Bitcoin’s “safe-haven” status is about to see its ultimate test (Cryptoslate)
- More Delays? Ethereum 2.0 Developers Expect 2021 Launch, Vitalik Buterin Pushes for 2020 (Cryptobriefing)
- Despite Crypto Bans, YouTube Now Shows Scam Ads Asking Users to Send Bitcoin (Cryptobriefing)
- ETH trades 80% below its $1,400 high, but Ethereum metrics are setting records (Cryptoslate)
- The IRS needs a crypto ‘subject matter expert’ to help beef up its crypto investigation efforts (The Block)
- The CFTC to Further Legitimize Bitcoin With Regulated Derivatives (Cryptobriefing)
- Attempted 51% Attack on Bitcoin Gold Was Thwarted, Developers Say (Coindesk)
- Chainlink (LINK) Surges 39.5% to a New All-Time High — Here’s Why (Cointelegraph)
- Key Metrics Show Institutional Interest in Crypto Is High and Rising (Cointelegraph)
_______________________________________________________________________
Technical analysis
_______________________________________________________________________
Bitcoin
The largest cryptocurrency by market capitalization had an average weekend in terms of volatility. Its price went down from $9,200 levels to $9,000 first, but bounced back quickly and started regaining its previous levels. BTC faced resistance in the form of the descending trend line for a short while but overcame it eventually. The price went up and then down to confirm the position above the level above which it is currently trading.
BTC trades should wait for the next increase in volume before trading BTC.
BTC/USD 4-hour Chart
Technical factors:
- Price is above its 50-period EMA and its 21-period EMA
- Price between the upper B.B. and the middle B.B (20-period SMA)
- RSI at the mid-levels (52.35)
- Decreased volume
Key levels to the upside Key levels to the downside
1: $9,580 1: $9,251
2: $9,735 2: $9,120
3: $9,870 3: $8,980
Ethereum
Ethereum had had a slow weekend, with mostly sideways movement. However, the second-largest cryptocurrency by market cap managed to establish its position above the $240 during it. While the move to the upside seems to be done, Ethereum fulfilled its short-term goal and can trade, knowing it has strong support at $240.
Ethereum traders should look for an opportunity to trade the next bounce off of $240 or break to the downside from the $240.
ETH/USD 4-hour Chart
Technical Factors:
- Price above the 50-period EMA and the 21-period EMA
- Price slightly below the upper B.B.
- RSI near the middle (55.41)
- Decreased volume
Key levels to the upside Key levels to the downside
1: $251.4 1: $240
2: $260 2: $228
3: $278.8 3: $225.4
Ripple
The third-largest cryptocurrency by market cap kept making higher lows and lower highs throughout the weekend. Ultimately, the price broke $0.2 to the downside and came back above it many times, with it currently being below $0.2. It is still uncertain where the price will end up.
XRP traders can look for an opportunity to trade after XRP establishes whether it will end up above or below $0.2.
XRP/USD 4-hour Chart
Technical factors:
- XRP in a mid-term descending trend (though it broke the trend in the short-term)
- XRP lacks strong support levels below $0.178
- Price is at the 21 and above the 50-period EMA
- Price slightly above the middle B.B. (20-period SMA)
- RSI is neutral (52.65)
- Average volume
Key levels to the upside Key levels to the downside
1: $0.205 1: $0.2
2: $0.214 2: $0.19
3: $0.227 3:$0.178
Related posts
 Daily Crypto Review, May 19 – Bitcoin Not Producing Enough Blocks?
 Daily Crypto Review, May 25 – Bitcoin Under $9,000; Goldman Sachs Hosting a Conference Call on Crypto
 Daily Crypto Review, May 29 – Bitcoin above $9,500; Goldman’s Criticism vs. Grayscale’s Optimism
 Daily Crypto Review, Sept 11 – DeFi Sector Experiences Volatility; The Rest Of The Market Stable