
The cryptocurrency sector was full of volatility over the weekend as Bitcoin tried to break the $14,000 mark. Bitcoin is currently trading for $13,735, representing a decrease of 0.13% on the day. Meanwhile, Ethereum gained 3.12% on the day, while XRP gained 1.31%.
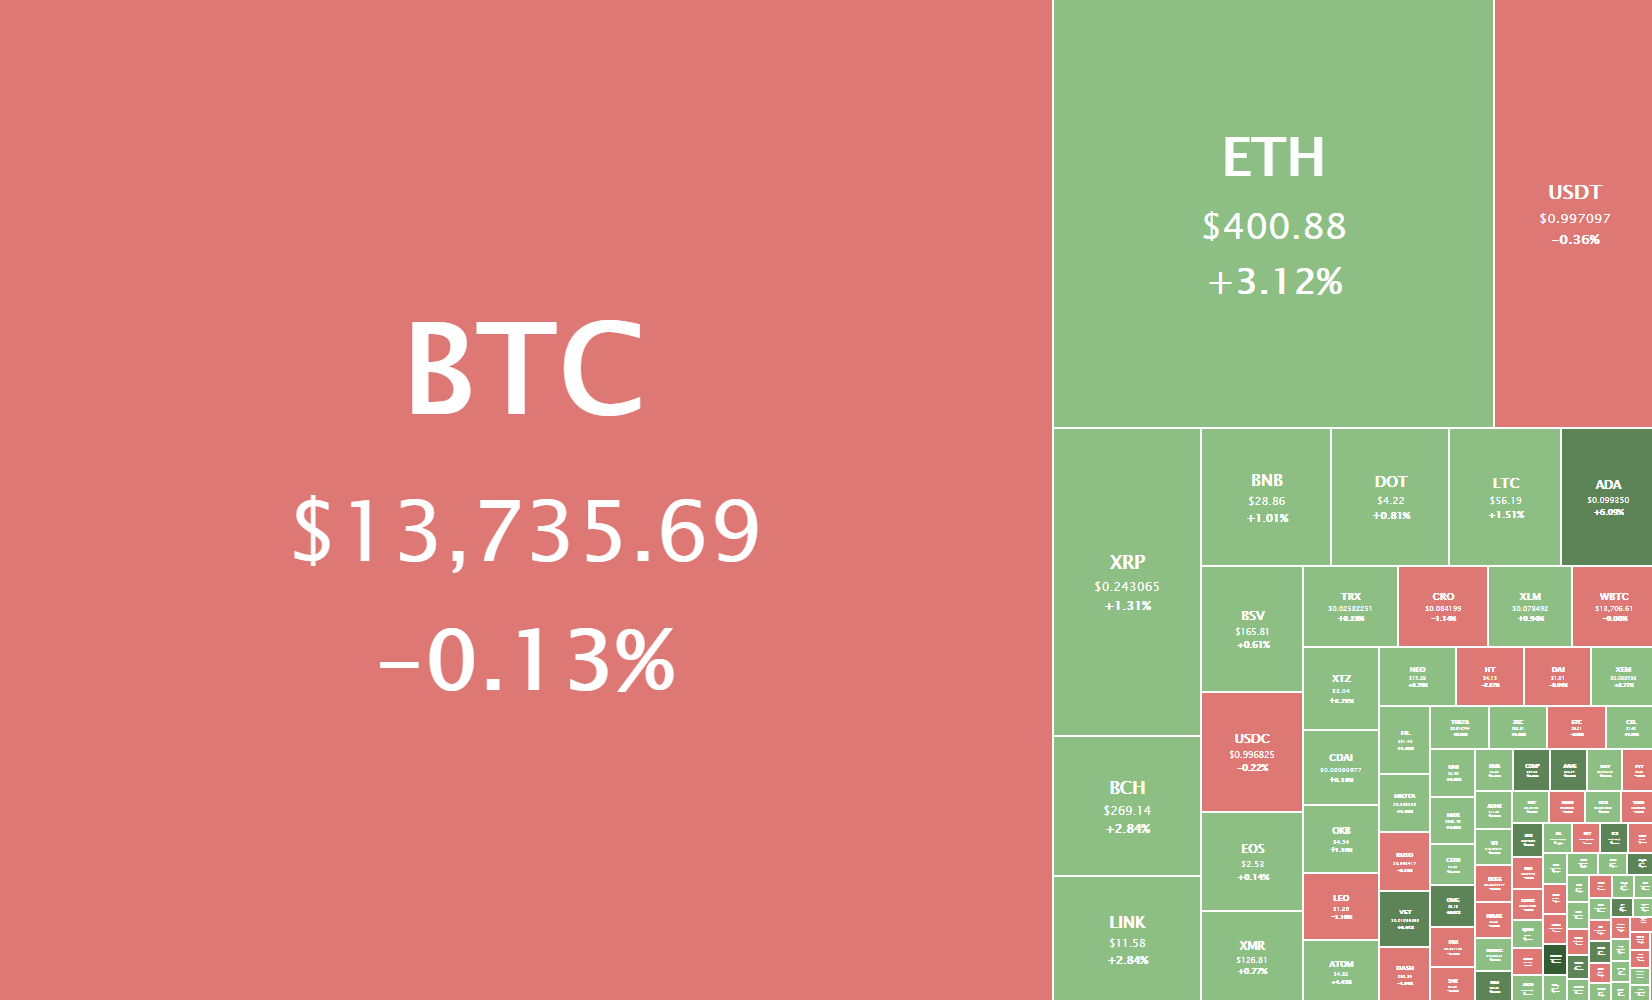
Daily Crypto Sector Heat Map
Taking a look at the top 100 cryptocurrencies, Ocean Protocol gained 20.20% in the past 24 hours, making it the crypto to gain the most in a day. Aave (10.97%) and Ox (8.84%) also did great. On the other hand, ABBC Coin lost 10.72%, making it the most prominent daily loser. It is followed by CyberVain’s loss of 7.62% and Ren’s loss of 3.92%.
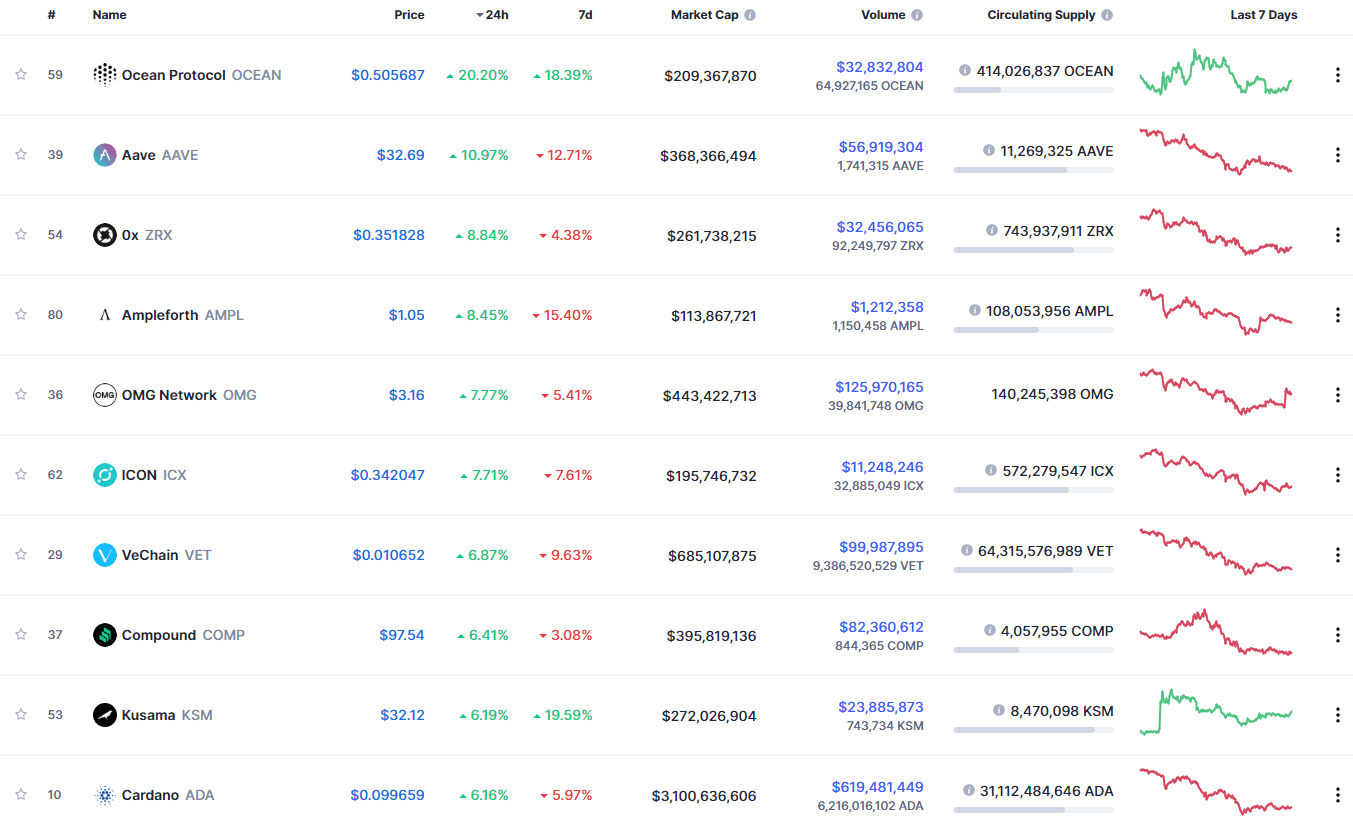
Top 10 24-hour Performers (Click to enlarge)
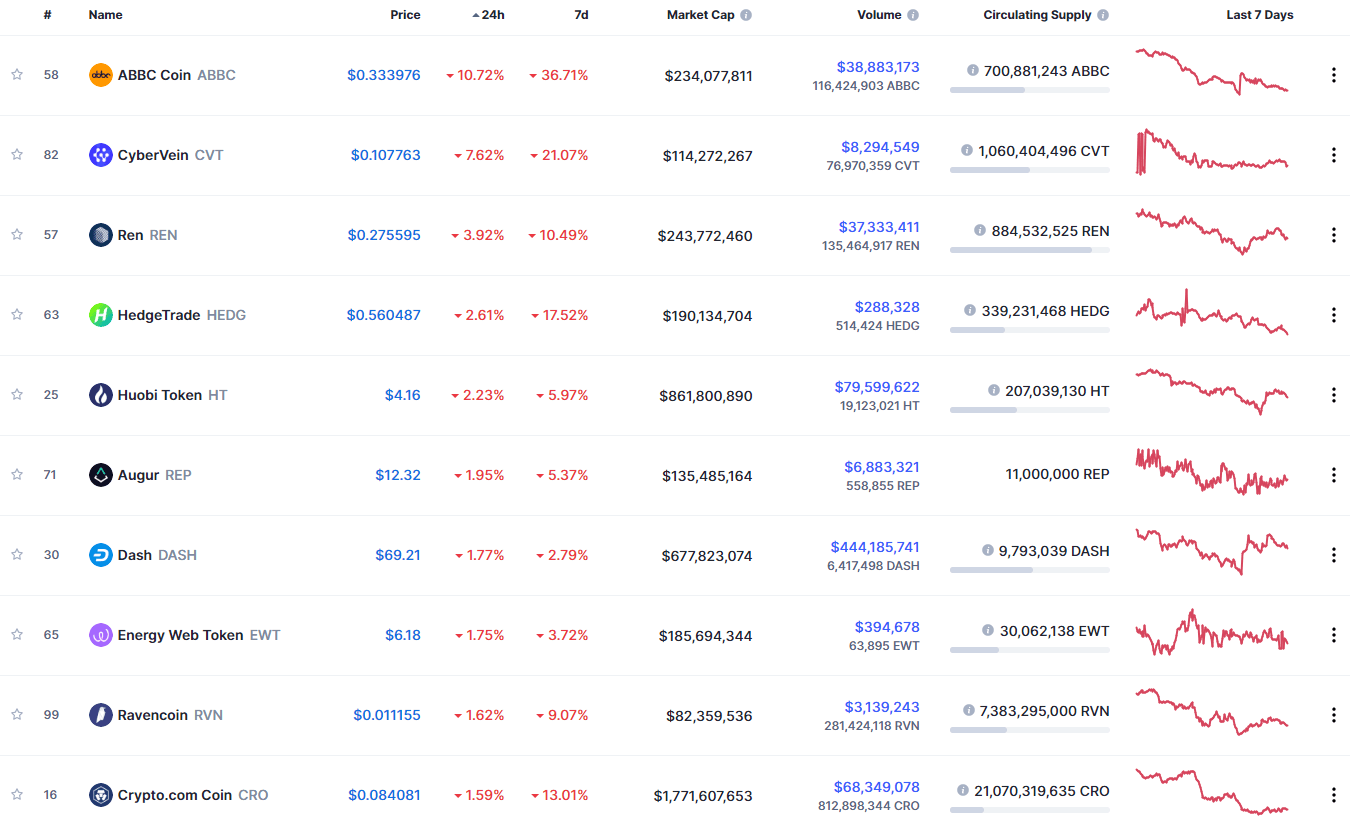
Bottom 10 24-hour Performers (Click to enlarge)
Bitcoin’s market dominance level had stayed at the same place since we last reported, with its value is currently 63.1%. This value represents a 0% difference when compared to the value it had on Friday.
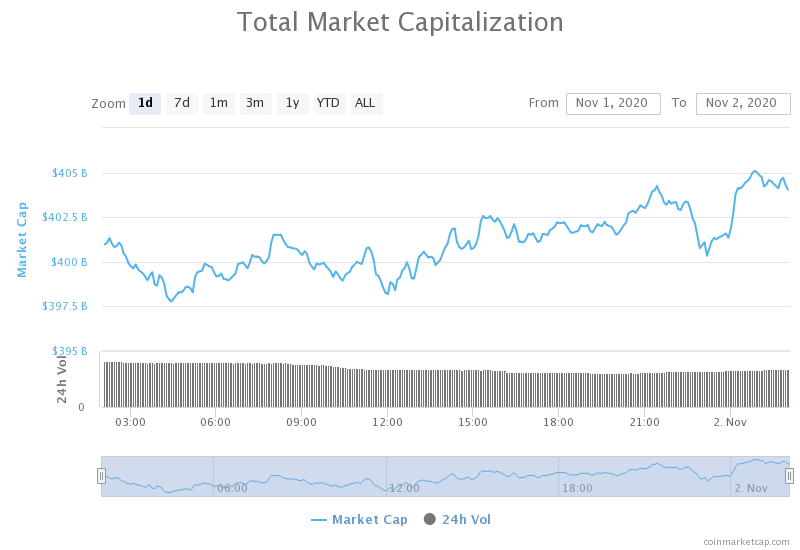
Daily Crypto Market Cap Chart
The crypto sector capitalization has increased slightly over the weekend. Its current value is $404.52 billion, representing a $4.91 million increase compared to our previous report.
_______________________________________________________________________
What happened in the past 24 hours?
_______________________________________________________________________
- Bitcoin’s white paper published 12 years ago today (The Block)
- A timeline of fintech’s involvement in crypto in 2020 thus far (The Block)
- BitMEX officials allegedly ‘looted’ $440 million from exchange after learning about U.S. charges, per lawsuit filing (The Block)
- The KuCoin thief’s exploits reveal the cutting edge of digital money laundering (The Block)
- Despite 95% drop in SUSHI, Ethereum DEX SushiSwap launches extensive update (Cryptoslate)
- Two multi-million dollar Ethereum DeFi project forks just “rug pulled” their investors (Cryptoslate)
- US Banks Could Seek Partnership With or Buy Crypto Custodians, OCC’s Brooks Says (Coindesk)
- Lagarde Seeks Public Comments About a Digital Euro, Implying a Broad Retail Offering Is Now on the Table (Coindesk)
- Ripple CTO offers answers for lack of adoption (Cointelegraph)
- Traders apathetic as Huobi exchange launches two new wrapped assets on Ethereum (Cointelegraph)
_______________________________________________________________________
Technical analysis
_______________________________________________________________________
Bitcoin
The largest cryptocurrency by market cap had quite a volatile weekend, with its price breaking the $13,900 mark at one point and even reaching as high as $14,100. However, this price didn’t hold up, and Bitcoin fell back below $13,900, where it is consolidating at the moment. Bitcoin is now trading within a tight range, bound by $13,570 to the downside and $13,900 to the upside. History has shown us that BTC doesn’t stay range-bound for long; thus, we may expect a large move soon.
Traders should look for a trade when Bitcoin breaks one of its immediate resistances.
BTC/USD 4-hour Chart
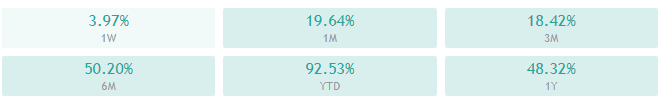
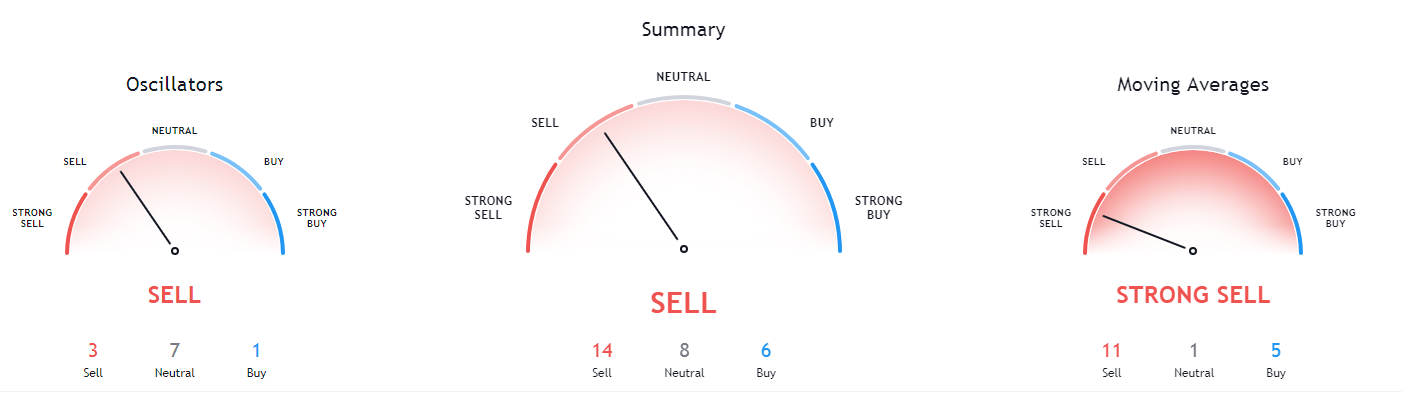
Bitcoin’s overview on all time-frames is slightly bullish, with hints of neutrality. The neutrality is more present on the shorter time-frames as opposed to less neutrality on longer time-frames.
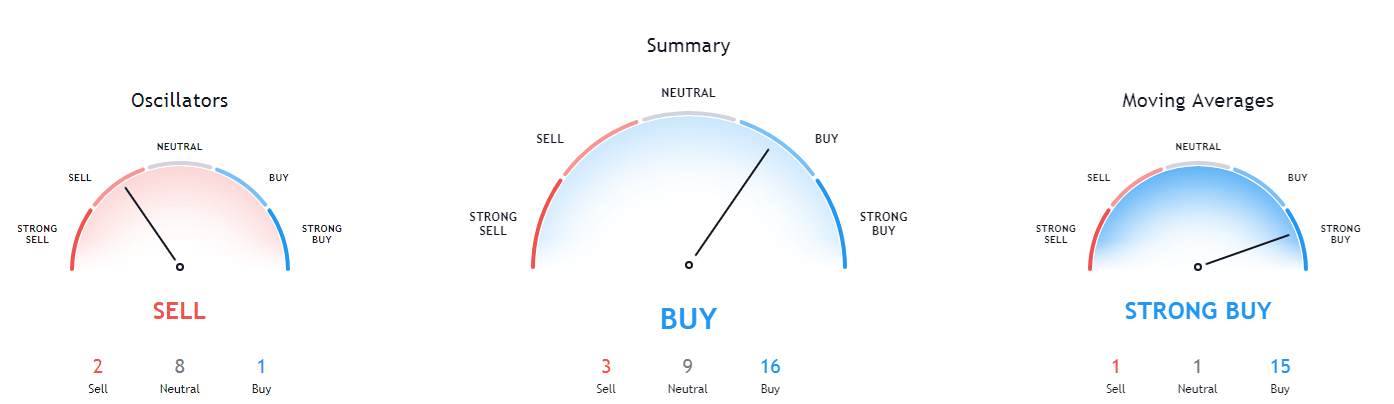
BTC/USD 1-day Technicals
Technical factors (4-hour Chart):
- Price is far above its 50-period EMA and above its 21-period EMA
- Price slightly above its middle Bollinger band
- RSI is neutral (53.43)
- Volume is slightly above average
Key levels to the upside Key levels to the downside
1: $13,900 1: $13,570
2: $14,000 2: $13,180
3: $14,660 3: $12,870
Ethereum
Ethereum had spent the weekend slowly following the ascending channel bottom line until Sunday when its price bounced off and pushed past $400. The second-largest cryptocurrency by market cap managed to reach as high as $405 before pulling back and consolidating. The fight for $400 will continue, and it will decide if Ethereum will push towards $415 and $420 in the near future or not.
Traders should look for Ethereum’s break (or the failure to break) the $400 level and trade off of that.
ETH/USD 4-hour Chart
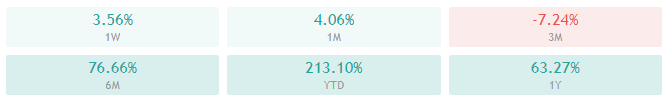
Ethereum’s 4-hour technicals have changed to a strong buy after Ether’s price spike, while its daily, weekly, and monthly time-frames are all slightly bullish with hints of neutrality.
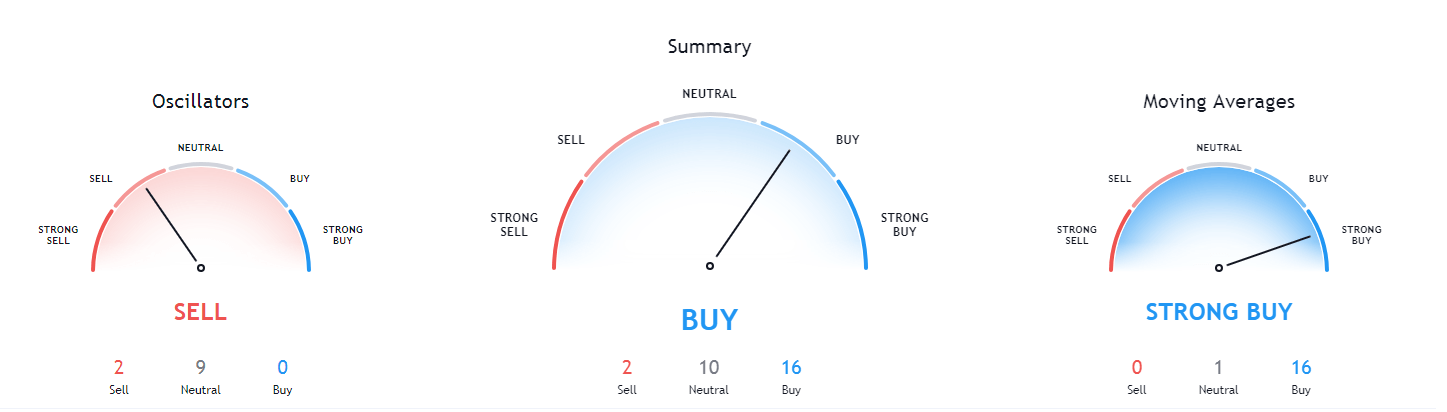
ETH/USD 1-day Technicals
Technical Factors (4-hour Chart):
- The price is far above both its 50-period and its 21-period EMA
- Price is at its top Bollinger band
- RSI is close to being overbought (64.51)
- Volume is slightly above average
Key levels to the upside Key levels to the downside
1: $400 1: $378
2: $415 2: $371
3: $420 3: $361
Ripple
The fourth-largest cryptocurrency by market cap spent the weekend consolidating below the $0.2454 level, which it has dropped below just before the weekend started. XRP tested both the $0.235 downside and $0.2454 upside, and both have proven to be strong support/resistance levels, which has left XRP range-bound.
XRP will take a lot of buying power to break above $0.2454 again, which means that the traders should consider trading sideways inside the range XRP is currently in.
XRP/USD 4-hour Chart
XRP’s daily, weekly, and monthly technicals are all showing a strong tilt towards the sell-side, while its 4-hour overview is slightly bullish with hints of neutrality.
XRP/USD 1-day Technicals
Technical factors (4-hour Chart):
- The price below its 50-period EMA and above its 21-period EMA
- Price is slightly above its middle Bollinger band
- RSI is neutral (50.10)
- Volume is average
Key levels to the upside Key levels to the downside
1: $0.26 1: $0.2454
2: $0.266 2: $0.235
3: $0.27 3: $0.227
Related posts
 Daily Crypto Review, Apr 16 – China launched Digital Yuan; Cryptos pushing up after retesting lows
 Daily Crypto Review, May 6 – China’s Digital Yuan to Fully Replace Cash? Former BoC President Discusses
 Daily Crypto Review, Sept 3 – DeFi Flippening: Unifi’s Volume Topples Coinbase
 Daily Crypto Review, Sept 7 – Peter Schiff: “I Was Wrong About Bitcoin”; Bitcoin Facing $9,000 or Recovering?