The cryptocurrency sector has spent the day trying to consolidate after Bitcoin finished its rally. However, while most cryptocurrencies moved less than 1%, almost every one of them ended up in the red. The largest cryptocurrency by market cap is currently trading for $17,708, representing a decrease of 0.73% on the day. Meanwhile, Ethereum lost 0.49% on the day, while XRP lost 1.53%.
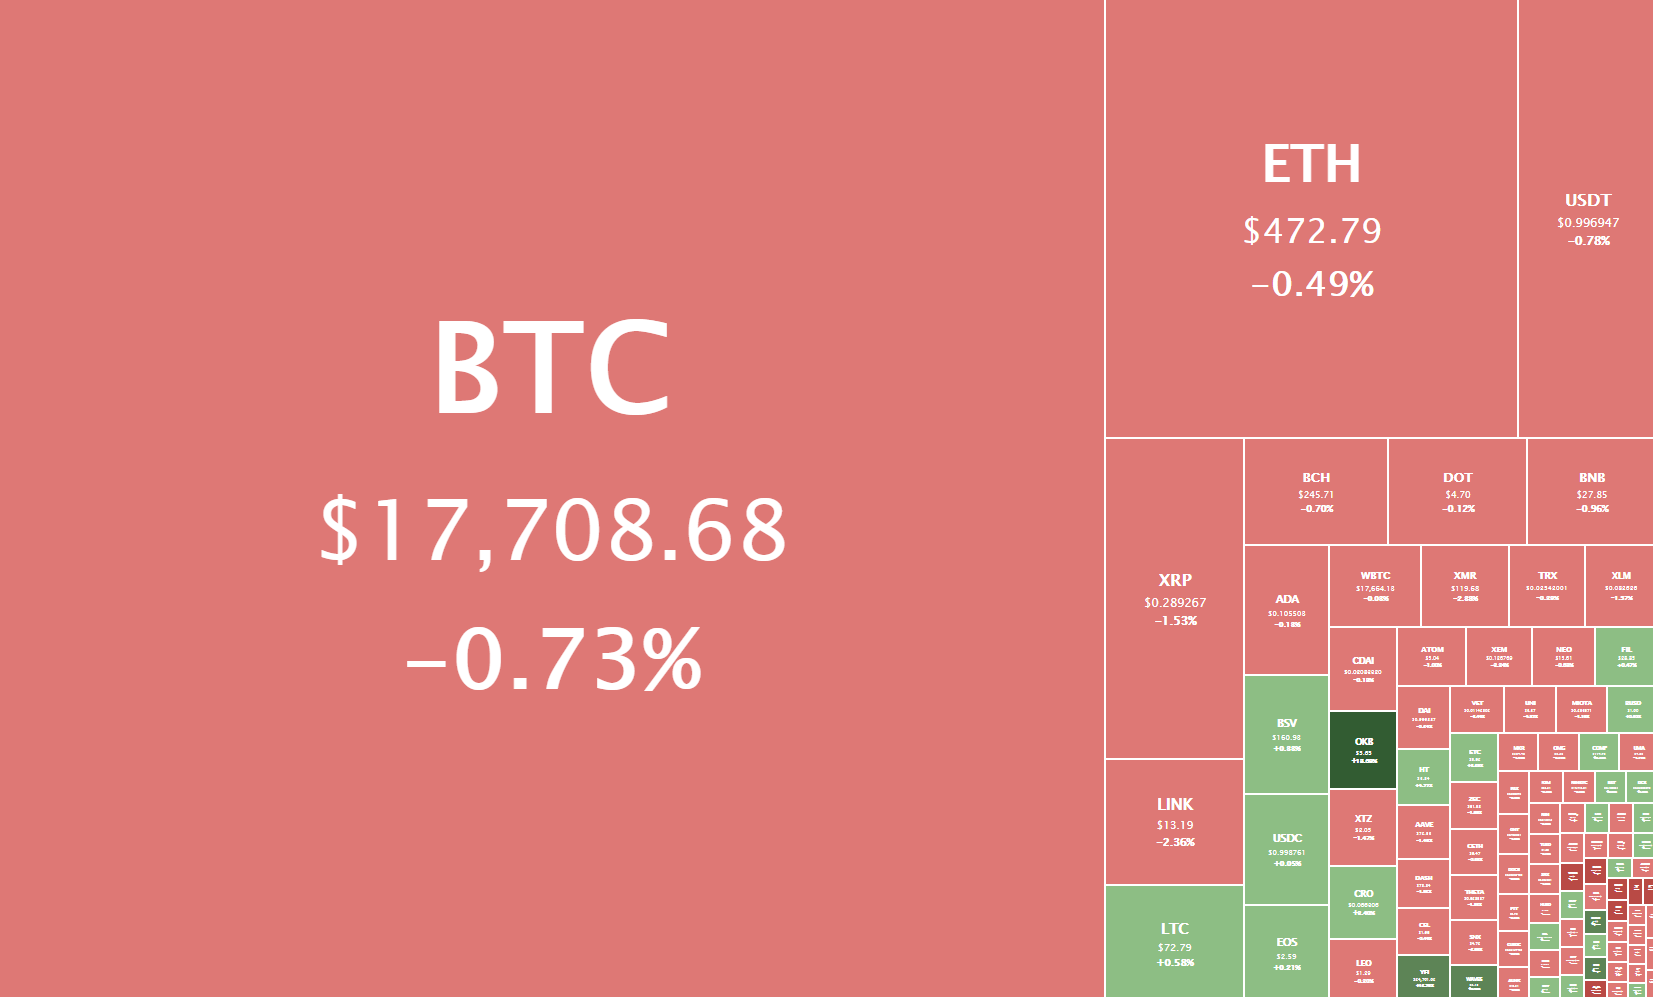
Daily Crypto Sector Heat Map
OKB gained 17.77% in the past 24 hours, making it the most prominent daily gainer out of the top100 cryptos ranked by market capitalization yet again today. It is closely followed by yearn.finance’s gain of 12.48% and SushiSwap’s 11.73% gain. On the other hand, Band Protocol lost 10.00%, making it the most prominent daily loser. Ampleforth lost 9.81% while Aragon lost 7.26%, making them the 2nd and 3rd most prominent daily losers.
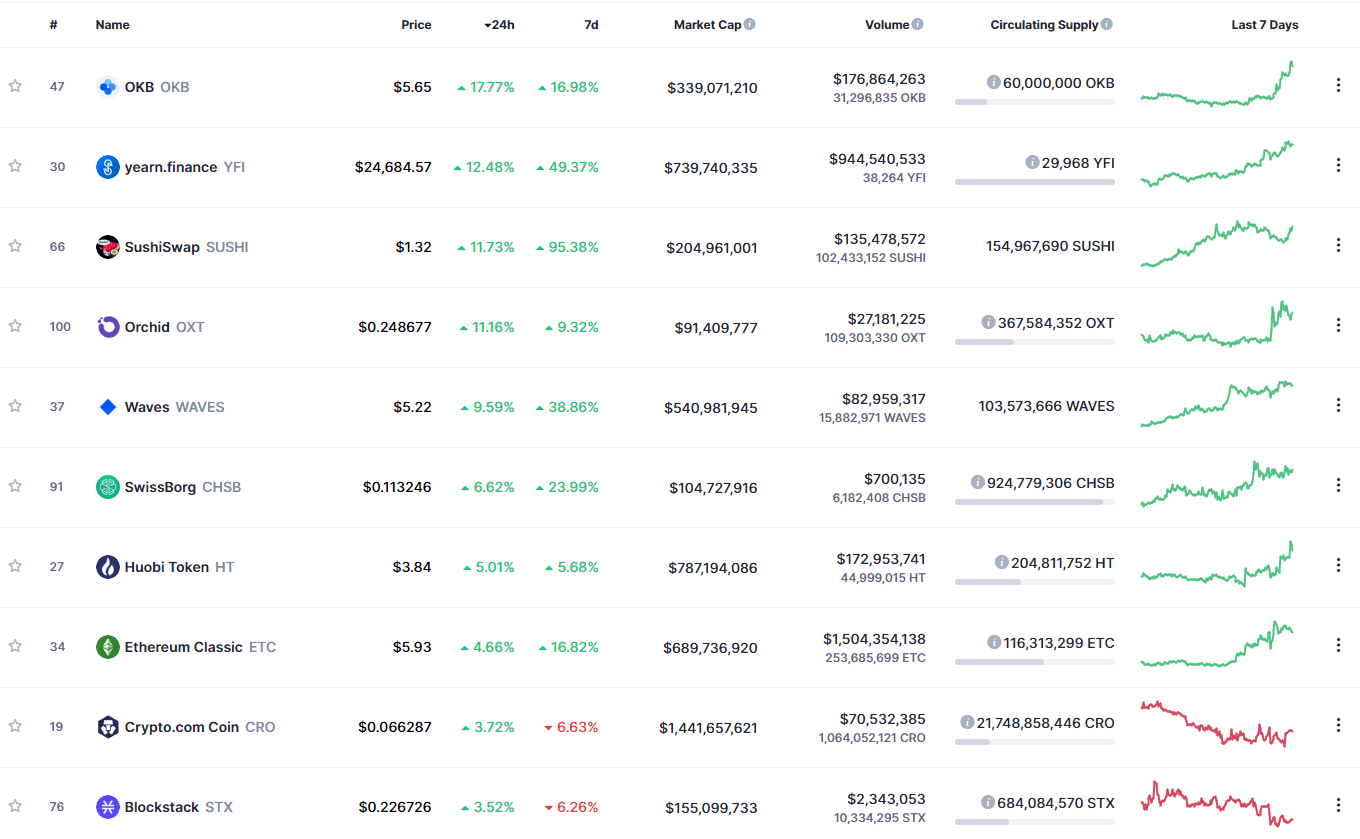
Top 10 24-hour Performers (Click to enlarge)
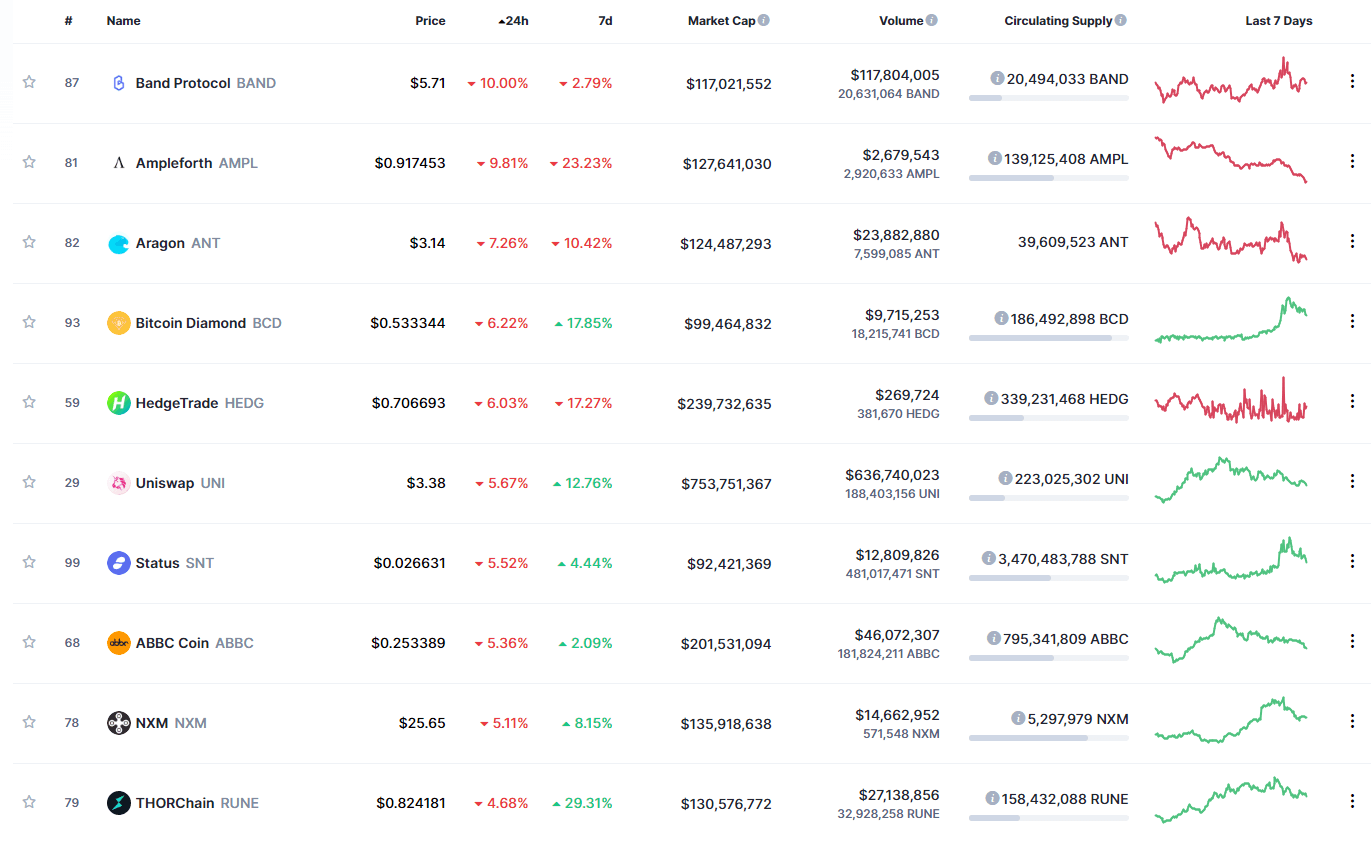
Bottom 10 24-hour Performers (Click to enlarge)
Bitcoin’s market dominance has stayed at exactly the same place over the course of the day, with its value is currently staying at 66.3%. This value represents no difference when compared to the value it had yesterday.
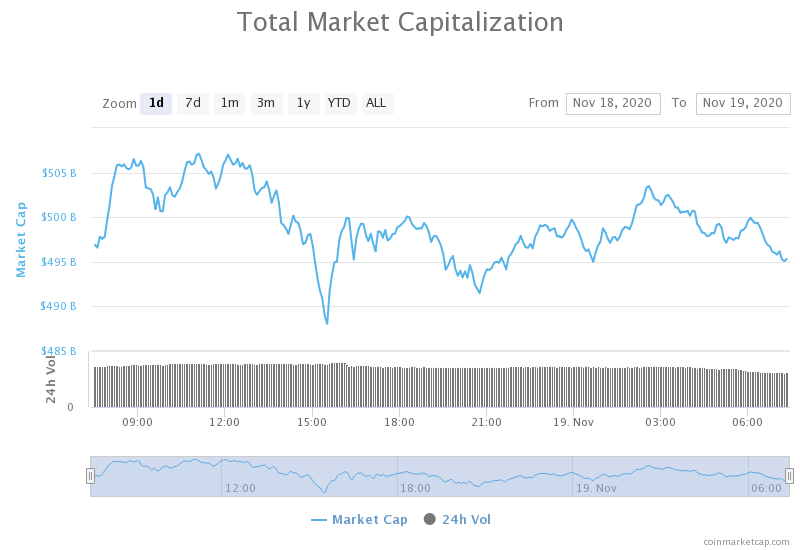
Daily Crypto Market Cap Chart
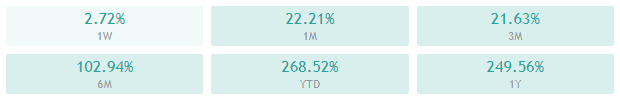
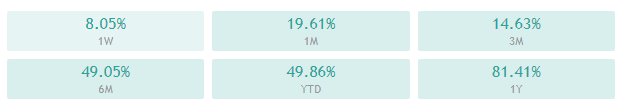
The crypto sector capitalization has stayed at the same place over the course of the day. Its current value is $495.07 billion, representing a $3.01 billion decrease compared to our previous report.
_______________________________________________________________________
What happened in the past 24 hours?
_______________________________________________________________________
- Bank of England’s chief economist: digital currencies may mitigate the need for negative interest rates (The Block)
- Will Eth2’s Phase 0 launch happen on December 1? Polymarket betters say no (The Block)
- The Interchange: MicroStrategy’s first mover advantage into bitcoin as corporate treasury is already demonstrating eye-watering results (The Block)
- Bitcoin ETP volumes surge as institutions jump into the BTC bull run (Cryptoslate)
- This crypto fund just bought $10m in Chainlink (LINK) during last night’s flash dip (Cryptoslate)
- XRP Set to Stage Comeback, 60% Breakout in the Works (Cryptobriefing)
- Binance Sues Forbes and Two Journalists Citing “Millions of Dollars” in Damages (Cryptobriefing)
- OKEx Token Rallies on Rumors Founder Xu Released From Custody (Coindesk)
- Survey of millionaires finds 73% own or want to invest in crypto (Cointelegraph)
- Bitcoin mining revenue hits yearly high, after return to pre-halving levels (Cointelegraph)
_______________________________________________________________________
Technical analysis
_______________________________________________________________________
Bitcoin

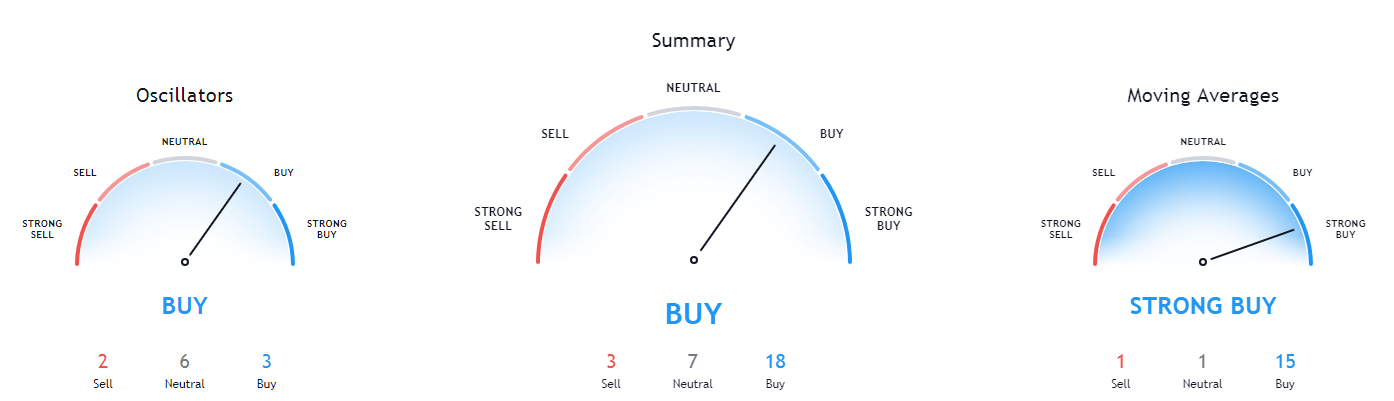
While it may seem that Bitcoin has had a pretty slow and uneventful day, that is certainly not the case. The largest cryptocurrency by market cap has spent the past 24 hours fighting for the $17,850 level and constantly going over and under it. However, the battle is finished, and BTC remains below $17,850 for the time being.
Many traders and analysts are warning BTC traders of a potential triangle formation forming. They also advise traders to refrain from trading until BTC chooses a clear direction.
BTC/USD 1-hour Chart
Bitcoin’s technicals on the daily, weekly, and monthly time-frame are all bullish but show signs of neutral presence. On the other hand, its 4-hour overview is tilted towards the buy-side and doesn’t show any bearishness.

BTC/USD 1-day Technicals
Technical factors (4-hour Chart):
- Price is slightly above its 50-period EMA and below its 21-period EMA
- Price is slightly below its middle Bollinger band
- RSI is neutral (44.71)
- Volume is slightly below average
Key levels to the upside Key levels to the downside
1: $18500 1: $17,850
2: $19000 2: $17,450
3: $19500 3: $17,130
Ethereum
Ethereum has established itself above the top line of the ascending channel (yellow dotted line) and is now trading within a new range, bound by the yellow line as support and a new ascending trend line as resistance. Ethereum’s price seems to be in a correction phase at the moment, so we can expect a retest of the yellow line as well as a possible sharp move afterward.
Ethereum traders should wait for the cryptocurrency to confirm its support level or fall under it, and then trade “with the wave.”
ETH/USD 1-hour Chart
Ethereum’s time-frames are slightly tilted towards the buy-side, with its daily overview showing slight bear presence, while its 4-hour and weekly overviews are showing slight neutrality. On the other hand, its monthly overview is completely bullish.

ETH/USD 1-day Technicals
Technical Factors (4-hour Chart):
- The price is below both its 50-period and its 21-period EMA
- Price is between its middle and bottom Bollinger band
- RSI is neutral (41.77)
- Volume is slightly below average
Key levels to the upside Key levels to the downside
1: $490 1: $470
2: $500 2: $451
3: $510 3: $445
Ripple
The fourth-largest cryptocurrency by market cap had another day of slowly marching towards the downside. However, the extremely low volume may be suggesting that the current price movement is a “calm before the storm,” and that a new big move is coming. Analysts are calling for another push towards the upside. Still, a move down is just as likely with the current state of the sector (the crypto sector is currently in a consolidation/correction phase).
XRP/USD 1-hour Chart
XRP’s daily and weekly overviews are completely bullish and show no signs of neutrality or bearishness. On the other hand, its 4-hour and monthly overviews show slight neutrality.
XRP/USD 1-day Technicals
Technical factors (4-hour Chart):
- The price is below both its 50-period EMA and its 21-period EMA
- Price is slightly below its middle Bollinger band
- RSI is pushing towards being oversold (39.45)
- Volume is below average
Key levels to the upside Key levels to the downside
1: $0.31 1: $0.28
2: $0.3244 2: $0.27
3: $0.3328 3: $0.266
Related posts
 Daily Crypto Review, Oct 14 – Analysts Calling for a Bull Market; Bitcoin Back Under $11,500
 Daily Crypto Review, Nov 5 – Bitcoin Finally Above $14,000 as the Bull Run Continues; Ethereum 2.0 Contract Release Live
 Daily Crypto Review, Nov 30 – Ethereum Soars on Great Fundamentals; Bitcoin Bulls Back in the Game
 Daily Crypto Review, Dec 3 – PayPal and BlackRock Heads Extremely Bullish on Bitcoin; Crypto Sector Consolidating