The cryptocurrency sector has spent the weekend recovering from the price descent on Dec 3 and 4. Bitcoin is currently trading for $19,288, representing an increase of 0.16% compared to our last report. Meanwhile, Ethereum’s price has decreased by 1.49% on the day, while XRP managed to lose 0.74%.

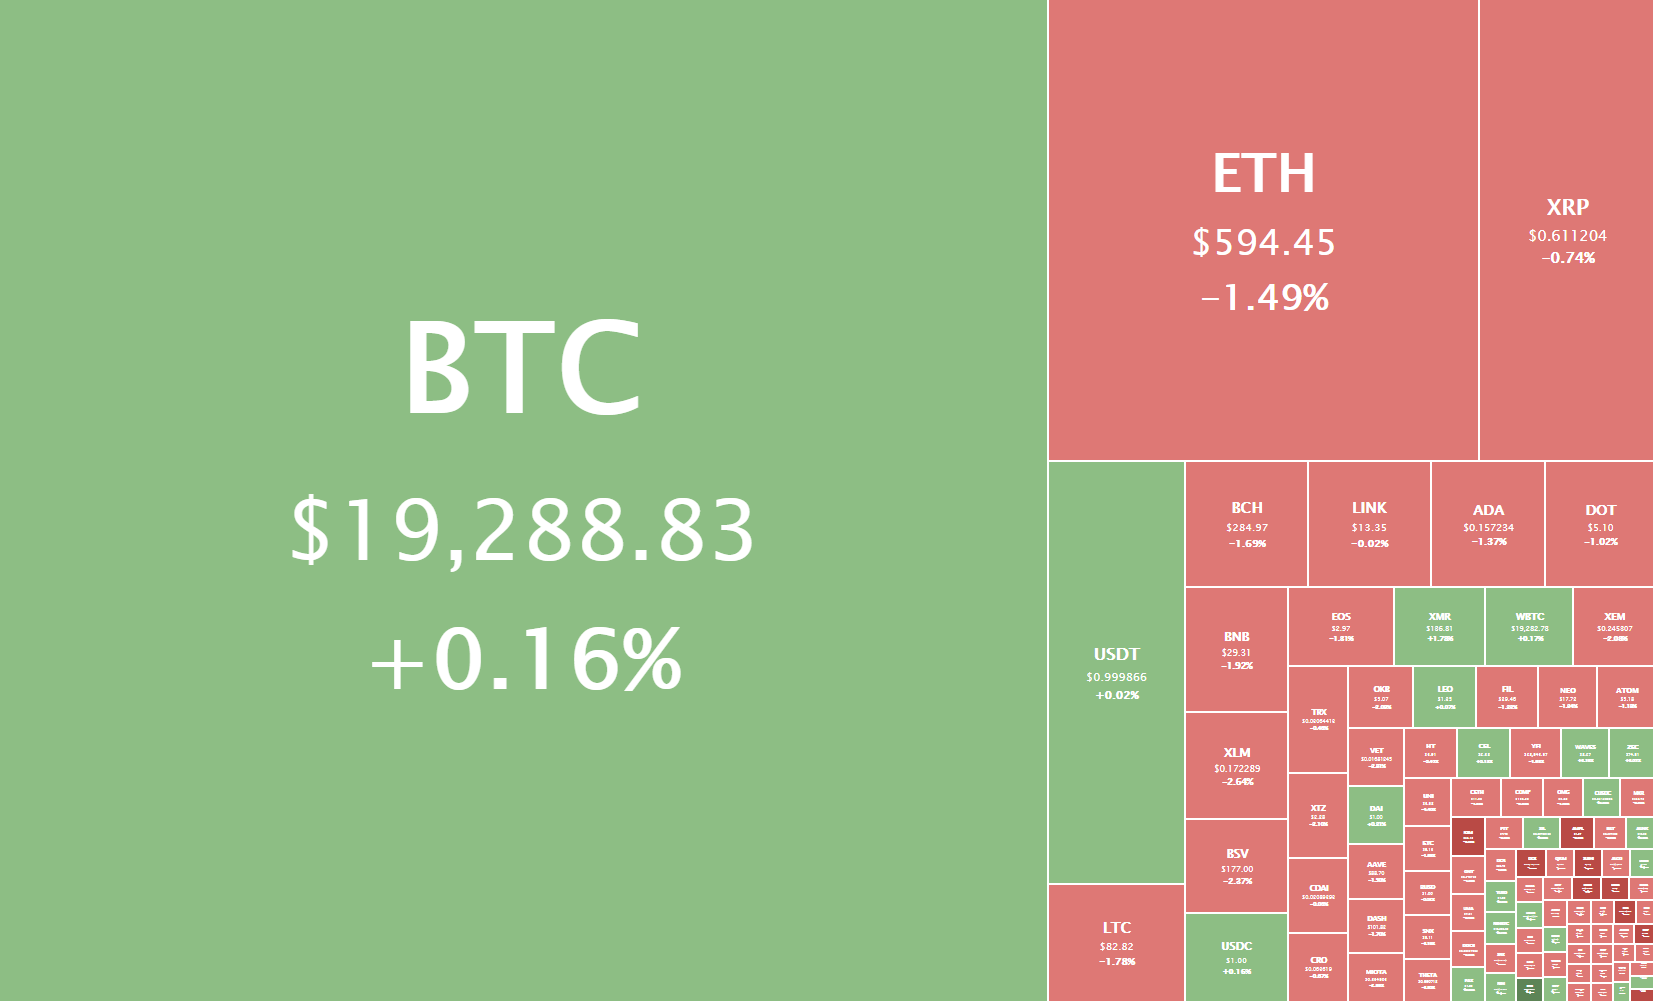
Daily Crypto Sector Heat Map
Omnitude gained 241.76% in the past 24 hours, making it the most prominent daily crypto gainer. It is closely followed by KIMCHI.finance’s 185% and Badger DAO’s 123.92% gain. On the other hand, DAV Coin lost 71.6%, making it the most prominent daily loser. It is followed by Semux’s loss of 66.12% and Bitball Treasure’s loss of 65.05%.
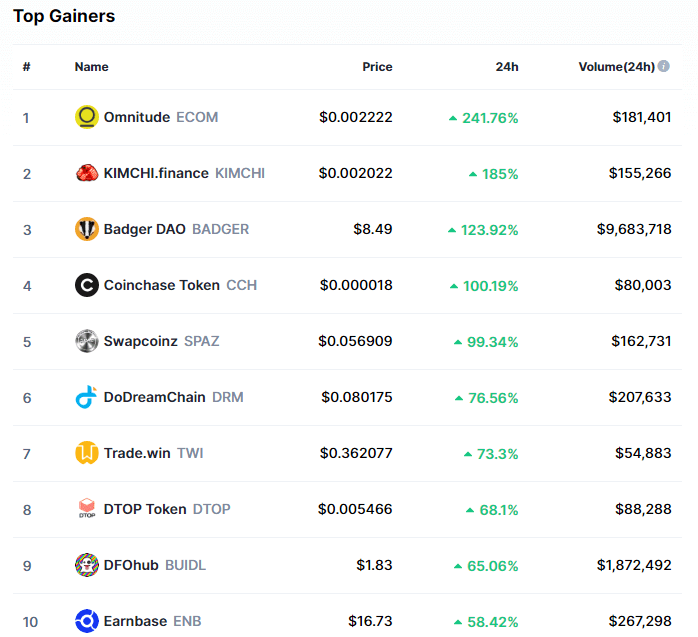
Top 10 24-hour Performers (Click to enlarge)
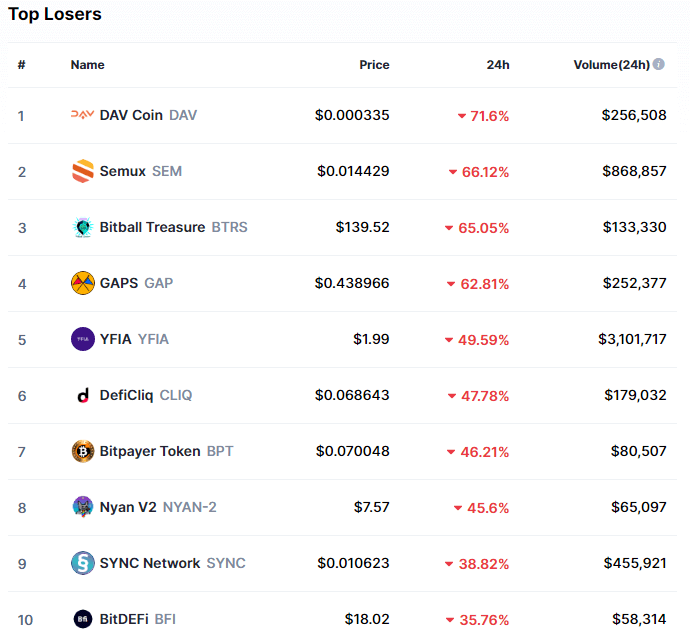
Bottom 10 24-hour Performers (Click to enlarge)
Bitcoin’s market dominance has barely moved to the downside since we last reported, with its value currently being 62.1%. This value represents a difference of 0.3% to the downside when compared to Friday’s value.

Daily Crypto Market Cap Chart
The crypto sector capitalization has decreased over the weekend. Its current value is $551.68 billion, representing an $18.83 billion decrease when compared to our previous report.
_______________________________________________________________________
What happened in the past 24 hours?
_______________________________________________________________________
- MicroStrategy discloses new $50 million bitcoin buy (The Block)
- GBTC reached its highest average daily trading volumes since 2017 in November (The Block)
- Rep. Waters calls on Joe Biden to reverse policies that let banks custody cryptocurrencies and stablecoin reserves (The Block)
- Grayscale’s ETHE hits an all-time high average daily volume in Nov (The Block)
- Ex-Goldman Sachs executive with 98% of his net worth in cryptocurrencies warns of strong Bitcoin correction (Cryptoslate)
- Microstrategy Holds 3 Times More Bitcoin Than Crypto Fund Galaxy Digital (Cryptobriefing)
- New KYC Rules May Arrive Before Trump Leaves Office (Cryptobriefing)
- Bitcoin Miners Saw 48% Revenue Increase in November (Coindesk)
- Hong Kong in Talks With PBOC on Digital Yuan Trial for Cross-Border Payments (Coindesk)
- Facebook’s Libra (Diem) stablecoin is an existential threat to traditional banking (Cointelegraph)
_______________________________________________________________________
Technical analysis
_______________________________________________________________________
Bitcoin
Bitcoin has spent the weekend trying to recover from the downturn it had on Dec 3 and 4. The largest cryptocurrency by market cap has formed a triangle formation that is respected throughout the weekend and then broke it to the upside. While the move was short-lived, the overall short-term bullishness has increased.
Some traders see a bull flag instead of the triangle formation, which makes the possibly future even more bullish. Posting any short trades would most likely be more risky than profitable at the moment.
It is also important to note that the Has Ribbons (one of the best accumulation indicators) indicator has posted a buy signal.
BTC/USD 4-hour chart
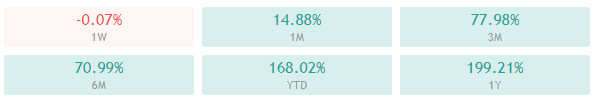
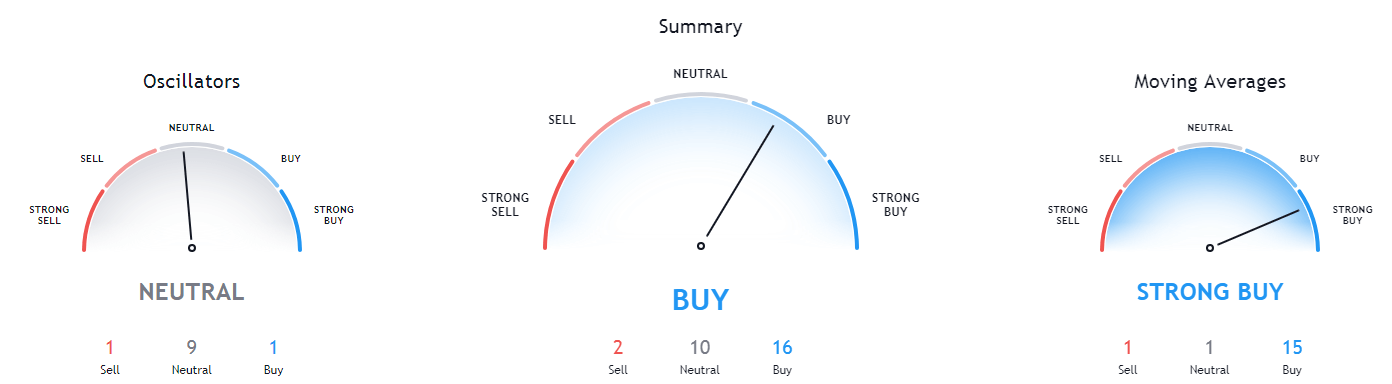
Bitcoin’s technicals on all time-frames are bullish, with 4-hour and weekly time-frames showing full tilt to the buy-side and daily and monthly time-frames tilting more towards neutrality.
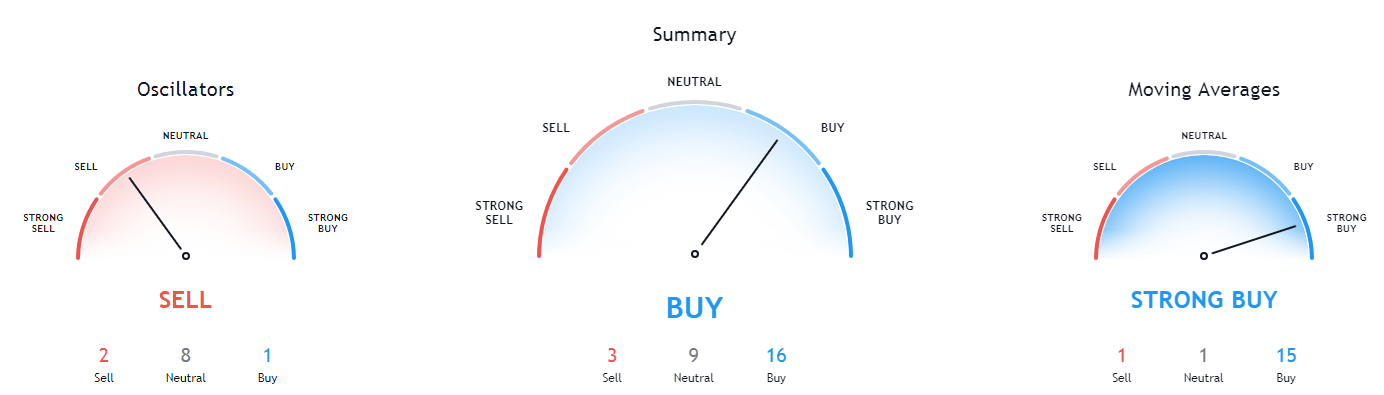
BTC/USD 1-day Technicals
Technical factors (4-hour Chart):
- Price is above its 50-period EMA and slightly above its 21-period EMA
- Price is slightly above its middle Bollinger band
- RSI is neutral (54.36)
- Volume is below average
Key levels to the upside Key levels to the downside
1: $19,500 1: $19,000
2: $19,666 2: $18,790
3: $20,000 3: $18,500
Ethereum
Ethereum has spent the weekend slowly pushing towards the upside, reaching just under $600 and bouncing off the resistance level. Its current failure to break $600 is not a big red flag, as Ethereum’s large moves are (lately) mostly caused by Bitcoin’s movement.
Ethereum traders have a great opportunity to catch a safe trade if ETH/USD breaks $600. A stop-loss slightly below $600 and a possible target of $620 or $630 would make quite a viable trade.
ETH/USD 4-hour Chart
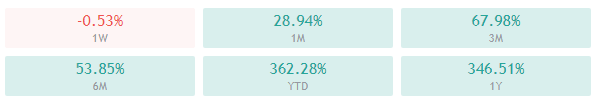
Ethereum’s 4-hour, weekly, and monthly overviews show a full tilt towards the buy-side, while its daily overview shows some signs of neutrality.
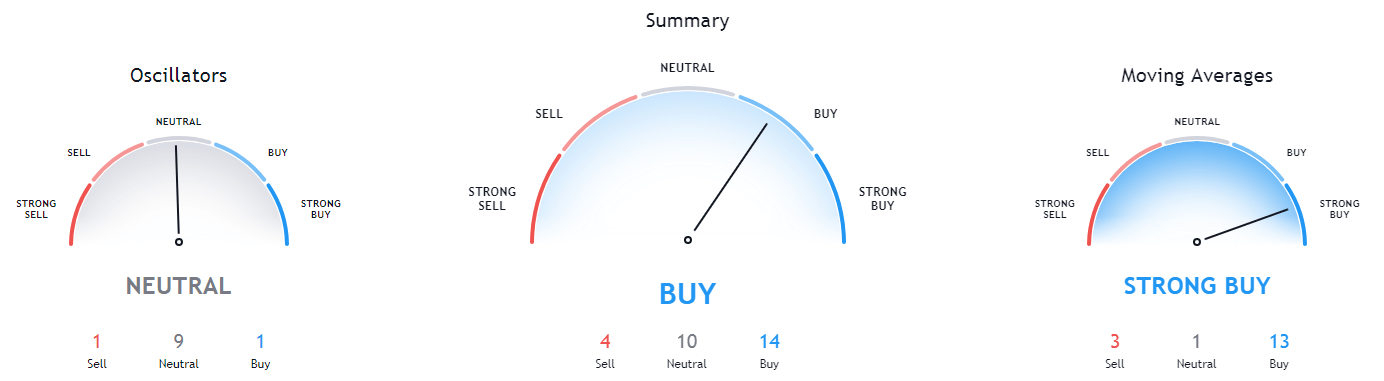
ETH/USD 1-day Technicals
Technical Factors (4-hour Chart):
- The price is slightly above its 50-period and at its 21-period EMA
- Price is at its middle Bollinger band
- RSI is neutral (50.51)
- Volume is slightly below average
Key levels to the upside Key levels to the downside
1: $620 1: $600
2: $630 2: $510
3: $735 3: $500
Ripple
The fourth-largest cryptocurrency by market cap experienced slightly more volatility over the weekend than during the previous week, with its price hovering between $0.542 and $0.626. The $0.6 level is currently holding quite well as a support line, and XRP shows no signs of dropping below it unless some external factor surfaces.
Trading XRP is, even with the slight increase in volatility, a near-impossible feat at the moment. Trading other (more volatile) cryptocurrencies could be a much better option.
XRP/USD 4-hour Chart
XRP’s 4-hour, weekly, and monthly overviews show complete bullishness, while its daily overview shows some signs of neutrality.
XRP/USD 1-day Technicals
Technical factors (4-hour Chart):
- The price is at both its 50-period EMA and its 21-period EMA
- Price is at its middle Bollinger band
- RSI is neutral (53.49)
- Volume is slightly below average
Key levels to the upside Key levels to the downside
1: $0.666 1: $0.6
2: $0.78 2: $0.596
3: $0.79 3: $0.535
Related posts
 Daily Crypto Review, Apr 17 – Bitcoin above $7,000; The US expanding on the idea of the Digital Dollar
 Daily Crypto Review, Apr 20 – Blockchain Jobs Booming; Lightning Network Unsafe?
 Daily Crypto Review, Apr 22 – The Netherlands testing grounds for EU digital currency; Ripple Labs suing YouTube
 Daily Crypto Review, May 13 – Bitcoin Pushing Towards 9,000; WBTC Larger than BTC’s Lightning Network