The cryptocurrency sector has spent the day pushing towards the upside as Bitcoin rallied and reached past $19,000. The largest cryptocurrency by market cap is currently trading for $19,093, representing an increase of 4.37% on the day. Meanwhile, Ethereum lost 0.55% on the day, while XRP gained 14.94%.
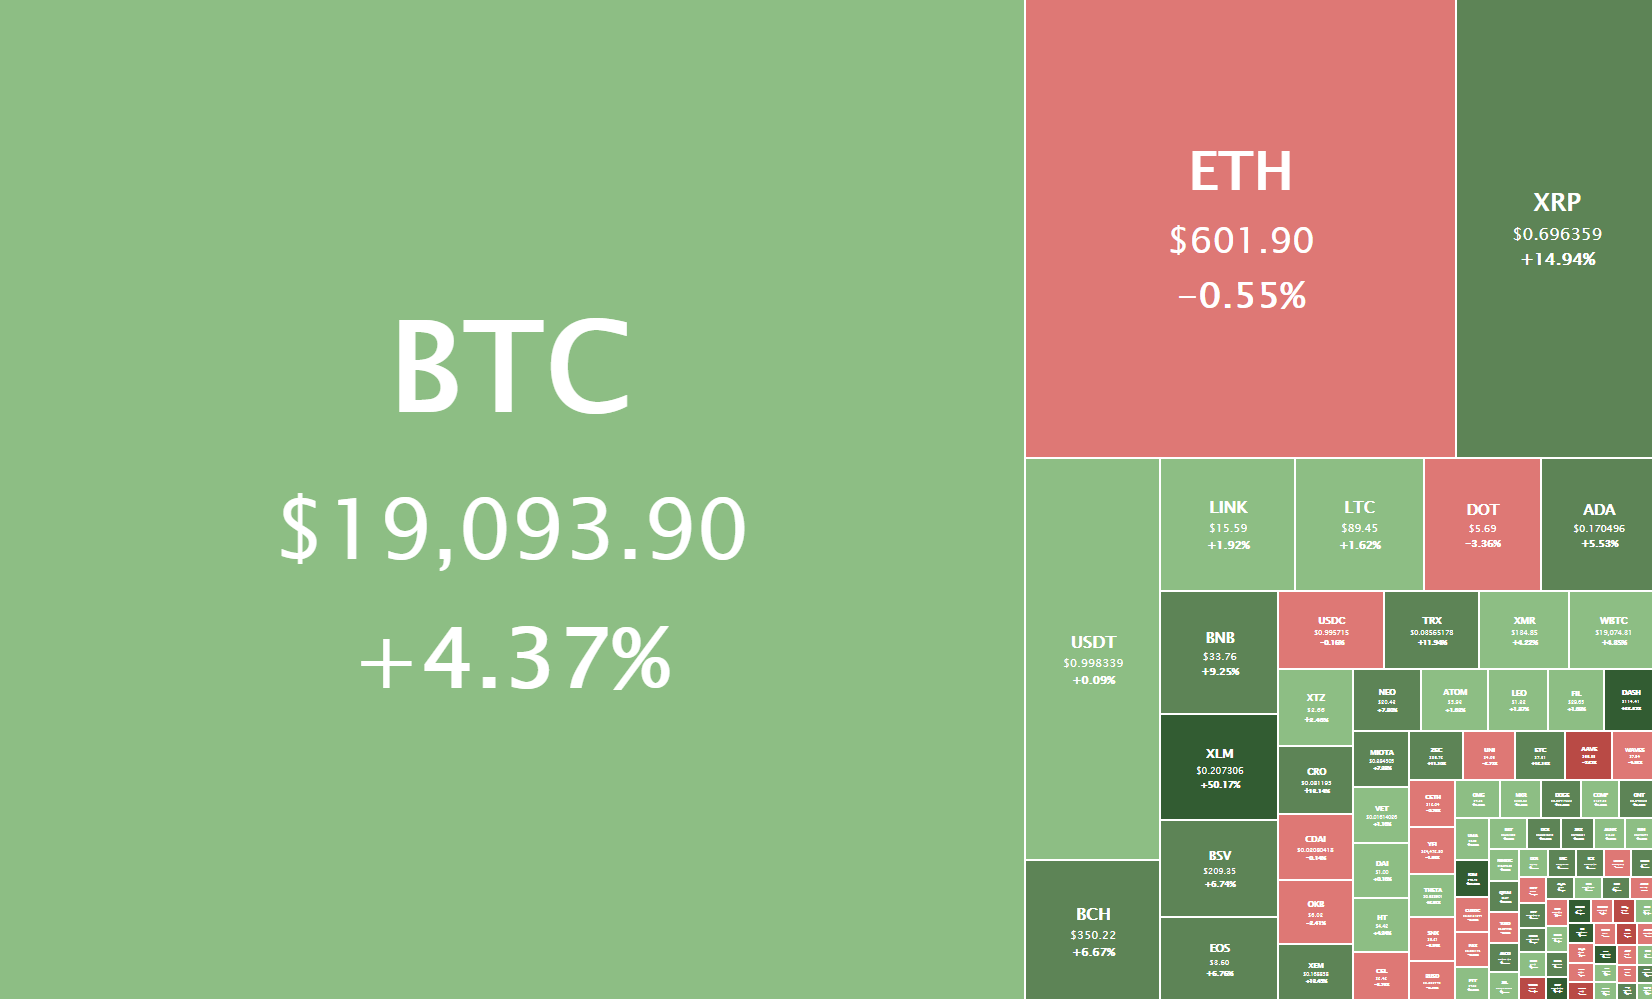
Daily Crypto Sector Heat Map
Verge 63.06% in the past 24 hours, making it the most prominent daily gainer in the top100. It is closely followed by Stellar’s gain of 59.30% and Status’s 31.14% gain. On the other hand, Bitcoin Gold lost 16.21%, making it the most prominent daily loser. SushiSwap lost 12.05% while Balancer lost 7.89%, making them the 2nd and 3rd most prominent daily losers.
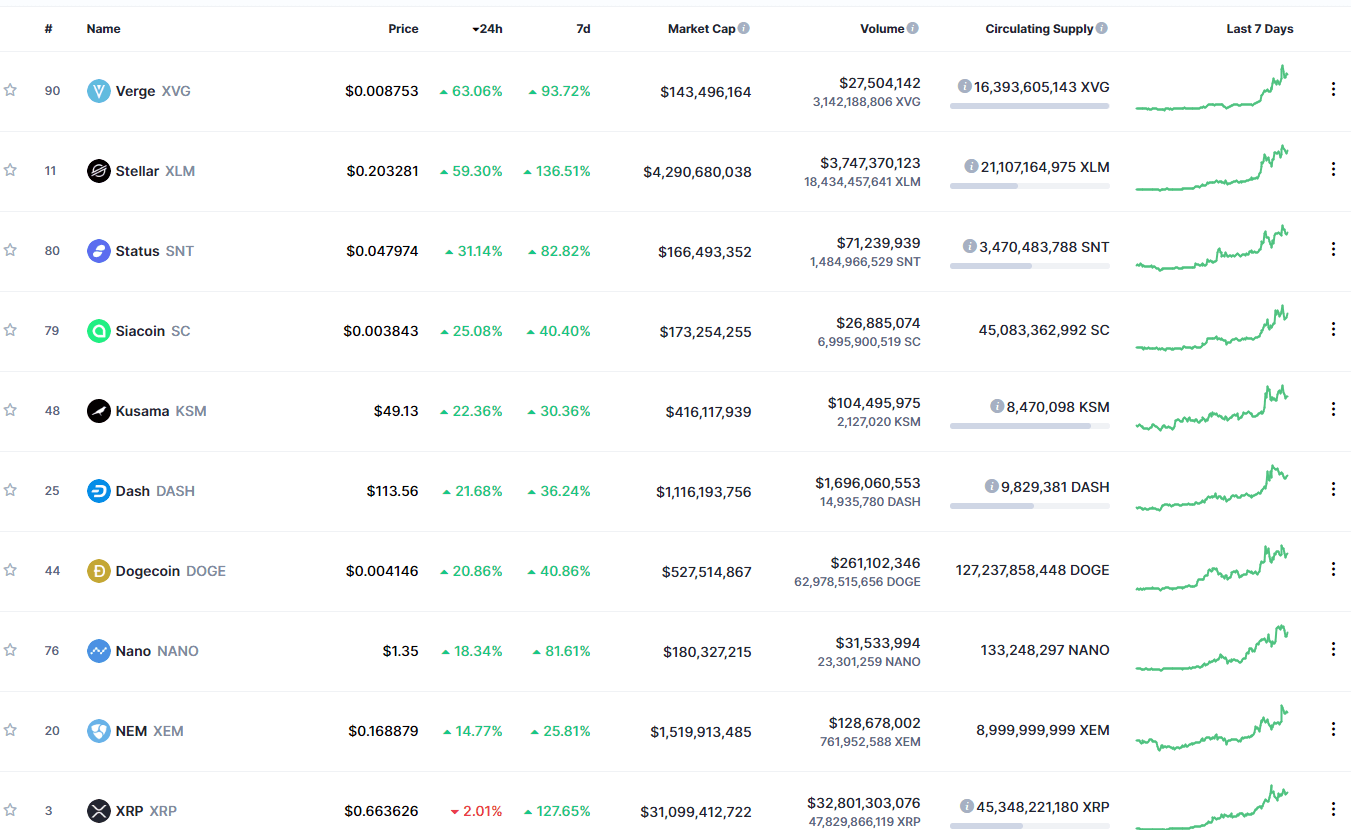
Top 10 24-hour Performers (Click to enlarge)

Bottom 10 24-hour Performers (Click to enlarge)
Bitcoin’s market dominance has increased over the course of the day, with its value is currently staying at 61.06%. This value represents a 1% difference to the upside compared to the value it had yesterday.
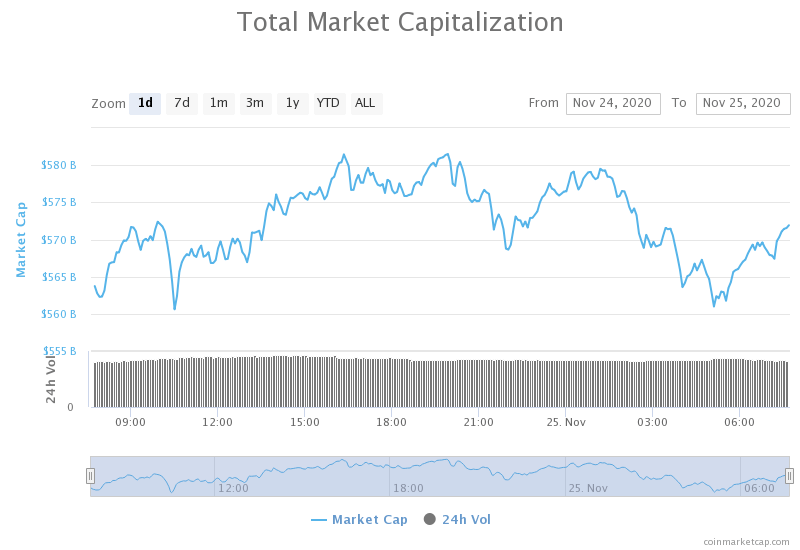
Daily Crypto Market Cap Chart
The crypto sector capitalization has increased slightly over the course of the day. Its current value is $571.53 billion, representing an $8.86 billion increase compared to our previous report.
_______________________________________________________________________
What happened in the past 24 hours?
_______________________________________________________________________
- Ripple’s Rise Short-Lived as XRP Holders Rush to Exchanges (Cryptobriefing)
- Coinbase Ends Margin Trading In Response to CFTC Regulations (Cryptobriefing)
- Bitcoin has been massively outperforming gold in November—but why? (Cryptoslate)
- Major announcements on Cardano will take place by the end of the year (Cryptoslate)
- Binance is now blocking users ‘identified as a US person’ with a 14-day deadline (The Block)
- Korean lawmakers propose delaying crypto tax rule to January 2022 (The Block)
- Nigeria is establishing a framework for nation-wide crypto adoption (Cointelegraph)
- Stellar Lumens doubles in price following upgrade (Cointelegraph)
- Yearn Finance absorbs Pickle to boost DeFi rewards (Cointelegraph)
- In Her Own Words: Here’s What Janet Yellen Has Said About Bitcoin (Coindesk)
_______________________________________________________________________
Technical analysis
_______________________________________________________________________
Bitcoin

The largest cryptocurrency by market cap has had an exciting day as its price reached past the $18,500 mark and pushed towards its all-time highs. Bitcoin managed to get to $19,450 before the momentum started dying off. It is currently consolidating just at the $19,000 mark, fighting to stay above it. This move was enabled by a booming altcoin situation, which led to a money pour-over into Bitcoin.
Any trading to the downside is completely irresponsible now due to how Bitcoin is moving. On the other hand, its movement towards the upside is very hectic, and traders should pay attention to when they enter and exit trades. If Bitcoin establishes its presence above the $19,000 mark with confidence, another push that might break the $20,000 all-time high level is entirely possible.
BTC/USD 2-hour Chart
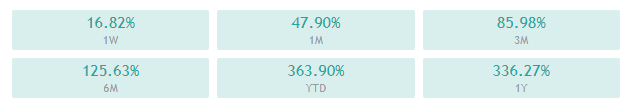
Bitcoin’s technicals are tilted to the bull-side slightly, with only the weekly time-frame being completely bullish. In contrast, its other time-frames contain a hint of neutrality or even bearishness.
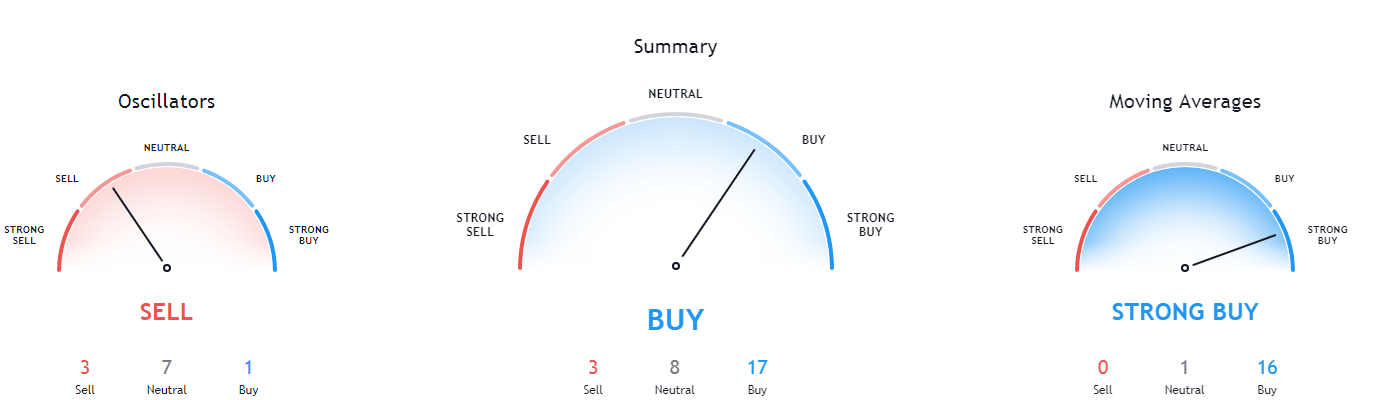
BTC/USD 1-day Technicals
Technical factors (4-hour Chart):
- Price is above its 50-period EMA and at its 21-period EMA
- Price slightly above its middle Bollinger band
- RSI is neutral (55.57)
- Volume is average
Key levels to the upside Key levels to the downside
1: $19000 1: $18500
2: $19500 2: $17,850
3: $19,666 3: $17,450
Ethereum
Ethereum’s parabolic move, which brought its price from $480 to $625, has seemingly ended, and Ethereum has entered a consolidation/retracement phase. While it was uncertain whether the second-largest cryptocurrency by market cap will stay above $600, the fight for the level has ended, and ETH moved back below it.
Ethereum has a very strong zone of resistance above $600 and all the way up to $632. On the other hand, it has a decently strong support zone at $575-$580. We can expect Ethereum to move in that range in the short-term unless a new breakout occurs.
ETH/USD 2-hour Chart
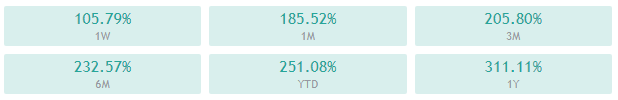
Ethereum’s technicals are tilted to the bull-side slightly, with only the monthly time-frame being completely bullish. In contrast, its other time-frames contain slight neutrality or even bearishness.
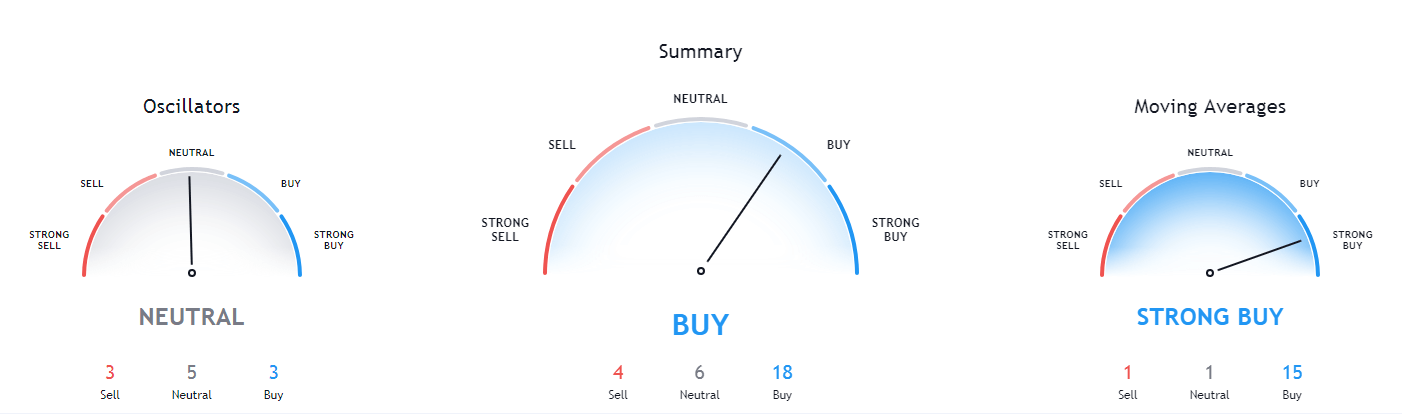
ETH/USD 1-day Technicals
Technical Factors (4-hour Chart):
- The price is above its 50-period and slightly below its 21-period EMA
- Price is near its bottom Bollinger band
- RSI is neutral (50.82)
- Volume is above average
Key levels to the upside Key levels to the downside
1: $600 1: $510
2: $630 2: $500
3: $735 3: $490
Ripple
The fourth-largest cryptocurrency by market cap’s controversial parabolic rise has died down and actually kept most of its gains. XRP has moved back from its recent highs of $0.78 (and even $0.9 on some exchanges) to a steadier $0.68, which is its current price. We can also see that XRP made a double top at the $0.735 mark, as well as a double bottom at the $0.625 support level.
Trading XRP is more manageable now as the volatility has died down, and the zones of support/resistance have been established. However, trading crypto overall is extremely risky at the moment, and only moves to the upside (and possibly sideways movement) should be traded.
XRP/USD 2-hour Chart
XRP’s 4-hour and daily overviews are completely bullish and show no signs of neutrality whatsoever, while its weekly and monthly overviews show slight neutrality or even a hint of bearishness.

XRP/USD 1-day Technicals
Technical factors (4-hour Chart):
- The price is far above its 50-period EMA and slightly above its 21-period EMA
- Price is slightly above its middle Bollinger band
- RSI is neutral (59.98)
- Volume is above average
Key levels to the upside Key levels to the downside
1: $0.79 1: $0.625
2: $0.963 2: $0.475
3: $1.01 3: $0.443
Related posts
 Daily Crypto Review, Apr 24 – Bitcoin transaction fees jumping up by 50% in the past 24 hours; Cryptos making new gains
 Daily Crypto Review, Sept 3 – DeFi Flippening: Unifi’s Volume Topples Coinbase
 Daily Crypto Review, Sept 7 – Peter Schiff: “I Was Wrong About Bitcoin”; Bitcoin Facing $9,000 or Recovering?
 Daily Crypto Review, Sept 9 – Will DeFi Bubble Burst, Send Ethereum to Freefall?