
The cryptocurrency sector is mostly green as cryptocurrencies took the day to recover from the sudden drop that occurred on Dec 8. Bitcoin is currently trading for $18,411, representing an increase of 1.25% compared to our last report. Meanwhile, Ethereum’s price has increased by 3.37% on the day, while XRP managed to gain 4.66%.
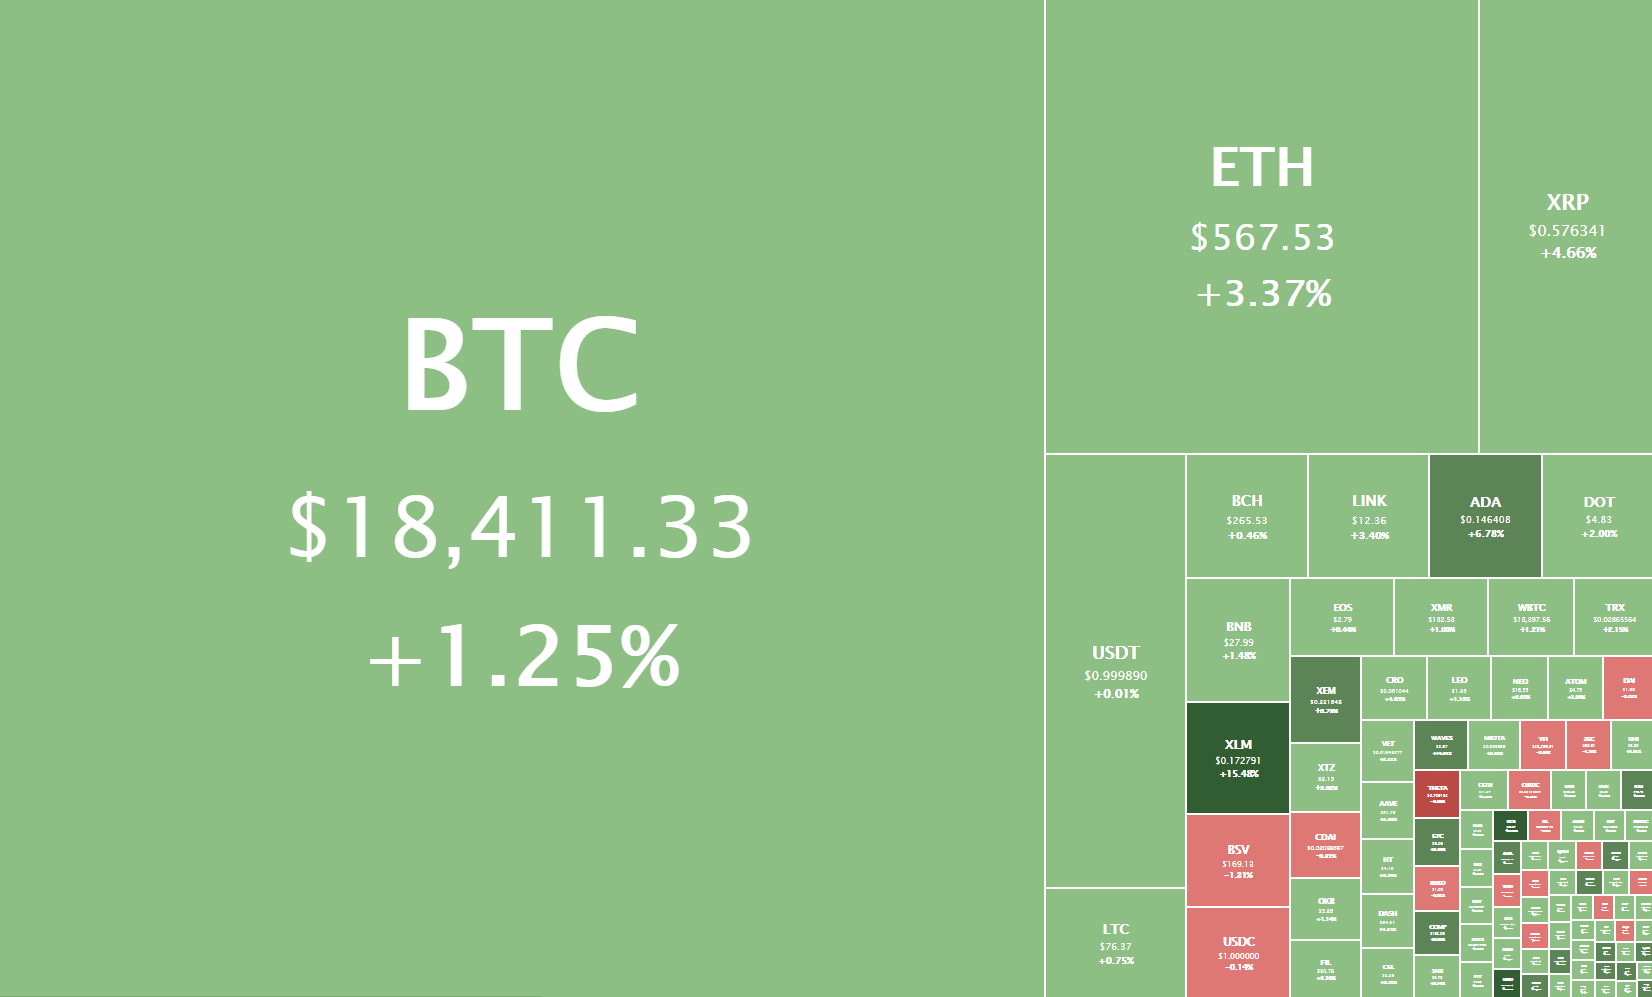
Daily Crypto Sector Heat Map
WinCash gained 207.65% in the past 24 hours, making it the most prominent daily crypto gainer by far. It is followed by Nyan V2’s 181.02% and Pamp Network’s 172.94% gain. On the other hand, DMme lost 68.63%, making it the most prominent daily loser. It is followed by ALL BEST ICO’s loss of 64.69% and Moonday Finance’s loss of 54.48%.
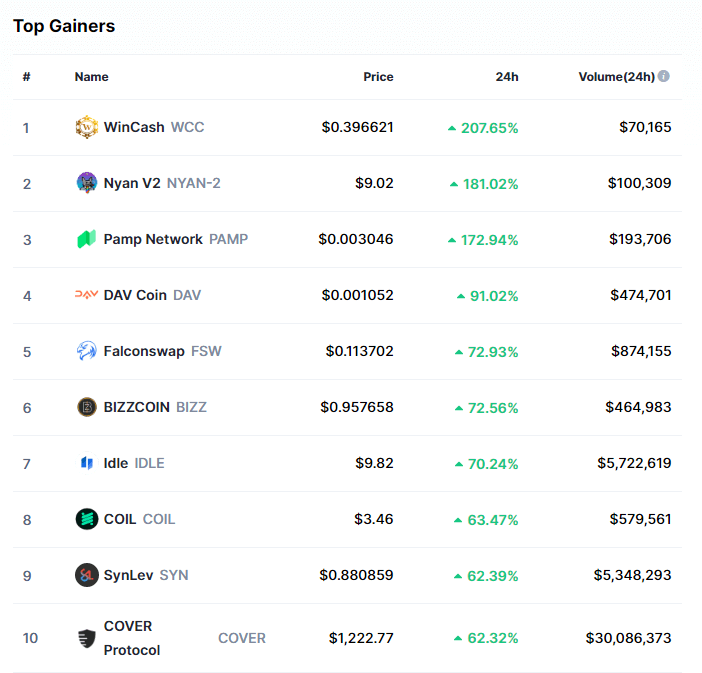
Top 10 24-hour Performers (Click to enlarge)
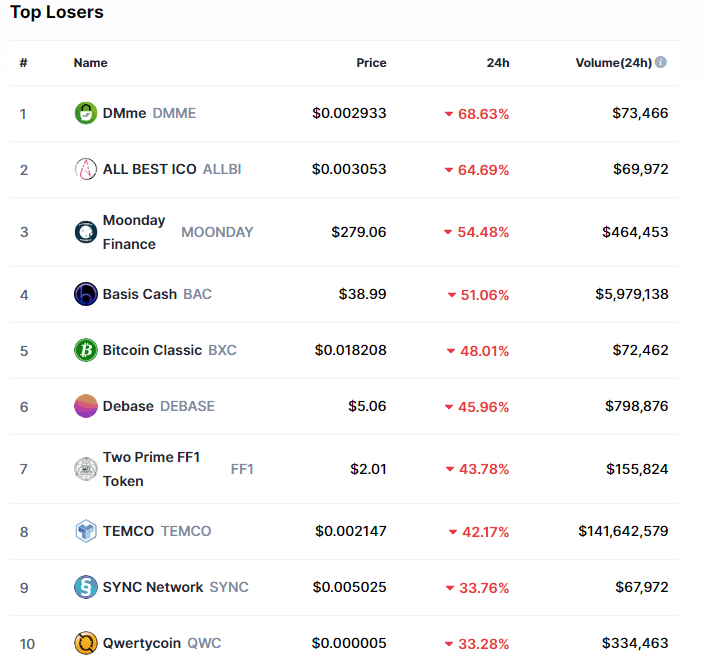
Bottom 10 24-hour Performers (Click to enlarge)
Bitcoin’s market dominance has moved to the downside just under half a percent since we last reported, with its value currently being 62.6%. This value represents a 0.4% difference to the downside compared to the value it had when we last reported.
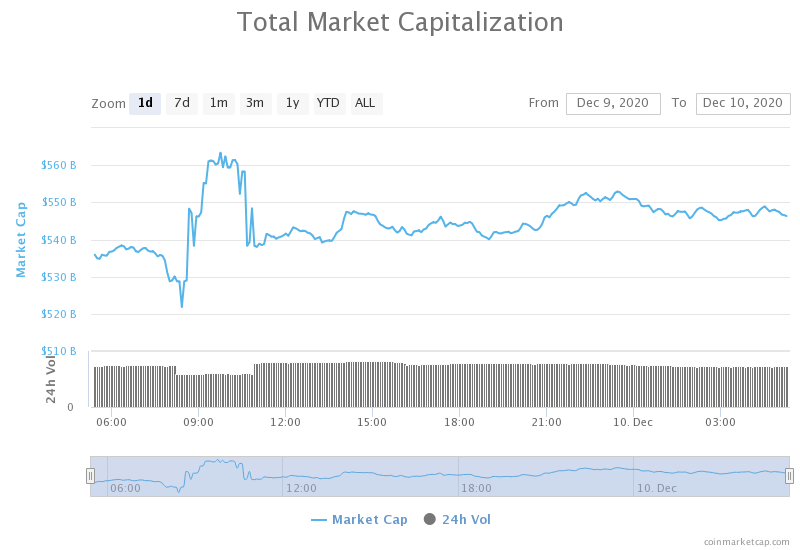
Daily Crypto Market Cap Chart
The cryptocurrency sector capitalization has increased significantly in the past 24 hours, with its current value being $546.31 billion. This represents a $10.23 billion increase when compared to our previous report.
_______________________________________________________________________
What happened in the past 24 hours?
_______________________________________________________________________
- France imposes tougher KYC requirements for crypto, including peer-to-peer transactions (The Block)
- Core Scientific partners with Foundry, garners financing raise of $23 million for mining equipment (The Block)
- Paxos files application with U.S regulator to obtain a national bank charter (The Block)
- Cardano is still the most developed blockchain on GitHub (Cryptoslate)
- JPMorgan admits Bitcoin’s growth represents a risk to gold as an investment (Cryptoslate)
- Crypto and stocks broker eToro is now a $2.5 billion ‘unicorn’ (Cryptoslate)
- Bitwise Joins Grayscale, Launches Crypto Index for Institutions (Cryptobriefing)
- Fidelity to Offer Bitcoin-Backed Cash Loans via BlockFi (Cryptobriefing)
- Euro stablecoin launched on Stellar by one of Europe’s oldest banks (Cointelegraph)
- Venezuela ramps up Bitcoin payments for imports from Iran and Turkey (Cointelegraph)
_______________________________________________________________________
Technical analysis
_______________________________________________________________________
Bitcoin
Bitcoin has spent the day slowly moving up after a sharp price descent, which brought it to $18,000. After establishing itself above $18,190, Bitcoin even tried to push further up above $18,600 but failed almost instantly, making its price go back to previous levels.
We want to point out (once again) Micheal van de Poppe’s call of a large CME gap looming between $18,275 and $16,995.
Due to the amount of support/resistance levels Bitcoin currently has, any push towards either the upside or downside could be a possible safe trade in the same direction.
BTC/USD 2-hour chart
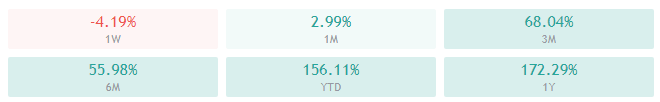
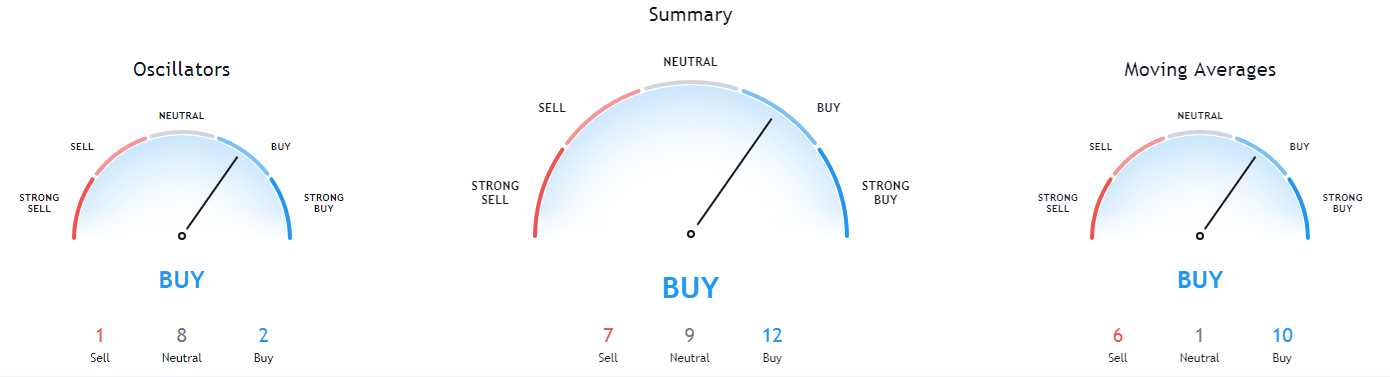
Bitcoin’s daily, weekly, and monthly technicals are completely tilted towards the buy-side and show no bearish signs. Its 4-hour overview, however, is completely bearish.
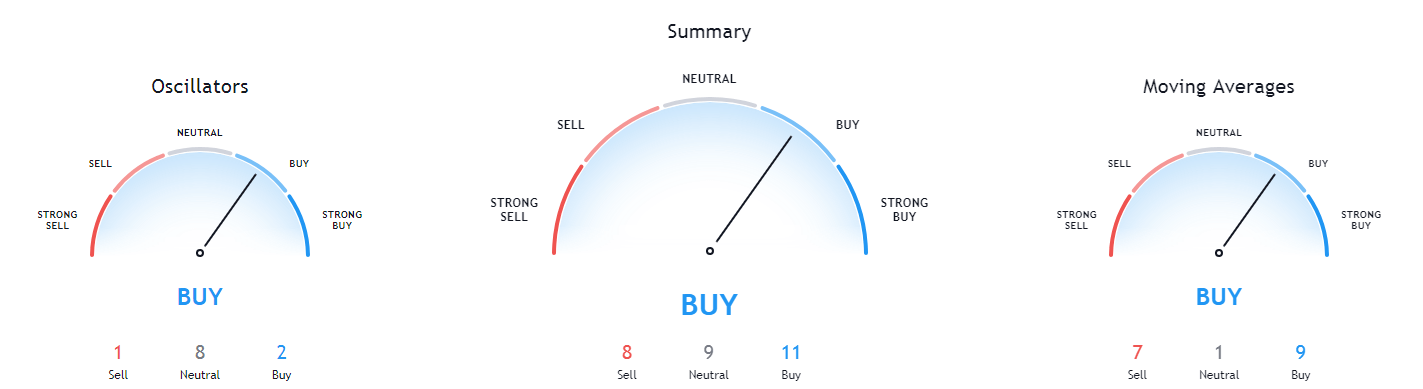
BTC/USD 1-day Technicals
Technical factors (4-hour Chart):
- Price is below both its 50-period and 21-period EMAs
- Price is between its middle and bottom Bollinger band
- RSI is has recovered from being oversold (43.38)
- Volume is slightly above average
Key levels to the upside Key levels to the downside
1: $18,600 1: $18,190
2: $18,790 2: $17,780
3: $19,000 3: $17,200
Ethereum
Ethereum has not only recovered from its drop to $530, where it hit the ascending (red) trend line but pushed back towards $600. Even though the price is not yet ready to tackle this resistance level, it has made an attempt to break the $581 level but failed and returned to the $565 one.
Ethereum traders should pay attention to whether the cryptocurrency will end up above or below $565, which may be an indicator of its short-term movement. Traders should also pay attention to Bitcoin’s movement whenever taking a trade with Ethereum.
ETH/USD 2-hour Chart
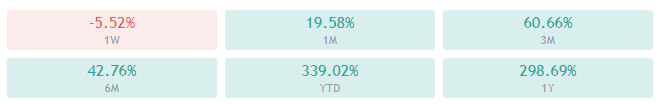
Ethereum’s daily and monthly technicals are completely tilted towards the buy-side and show no signs of bearishness. However, its 4-hour overview is completely bearish, while its weekly overview is bullish but shows slight neutrality as well.
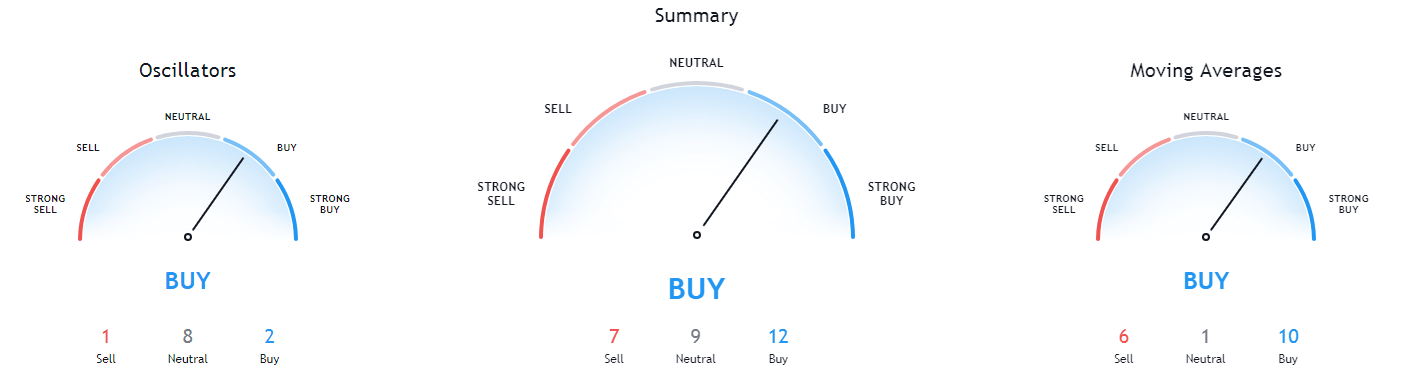
ETH/USD 1-day Technicals
Technical Factors (4-hour Chart):
- Price is below both its 50-period and 21-period EMAs
- Price is slightly below its middle Bollinger band
- RSI has recovered from being in the oversold territory (42.83)
- Volume is slightly above average
Key levels to the upside Key levels to the downside
1: $565 1: $550
2: $581 2: $525
3: $600 3: $510
Ripple
XRP made a sharp (to the upside) price recovery as well, with its price pushing past $0.5435, as well as its $0.57 resistance (now support) levels. The fourth-largest cryptocurrency by market cap even tried to break $0.6 but got shut down swiftly. Its price is now consolidating slightly above $0.57 and showing no signs of potential dips.
XRP traders (finally) have the option to trade this cryptocurrency after several days of close-to-no volatility. Keeping track of Bitcoin’s movements when trading XRP is a must, as any change in Bitcoin’s price could change the outlook of the market as a whole.
XRP/USD 2-hour Chart
XRP’s daily, weekly, as well as monthly technicals, are completely tilted towards the buy-side and show no signs of neutrality or bearishness. Its 4-hour overview, on the other hand, is bearish with slight signs of neutrality.
XRP/USD 1-day Technicals
Technical factors (4-hour Chart):
- The price is currently slightly below both its 50-period EMA, as well as its 21-period EMA
- Price is slightly below its middle Bollinger band
- RSI is neutral and recovered from being oversold (47.26)
- Volume is slightly above average
Key levels to the upside Key levels to the downside
1: $0.57 1: $0.5435
2: $0.6 2: $0.5
3: $0.63 3: $0.475
Related posts
 Daily Crypto Review, Feb 21 – Morgan Stanley dipping its toes into crypto? Analysts still confused by the price drop
 Daily Crypto Review, July 21 – Mastercard Bullish On Bitcoin; Paxos To Become Paypal’s Bitcoin Custodian
 Daily Crypto Review, July 23 – Ethereum’s Price Skyrockets As Developers Announce Ethereum 2.0 Test Specifications
 Daily Crypto Review, Nov 26 – Bitcoin’s “Flash Crash” Pulls Price Below $18,000; Blood on the Crypto Streets