
The majority of the cryptocurrency sector has ended up being in the red as Bitcoin spent most of the day under the $18,000 level. Bitcoin is currently trading for $17,920, representing a decrease of 2.91% compared to our last report. Meanwhile, Ethereum’s price has decreased by 4.30% on the day, while XRP managed to lost 2.85%.
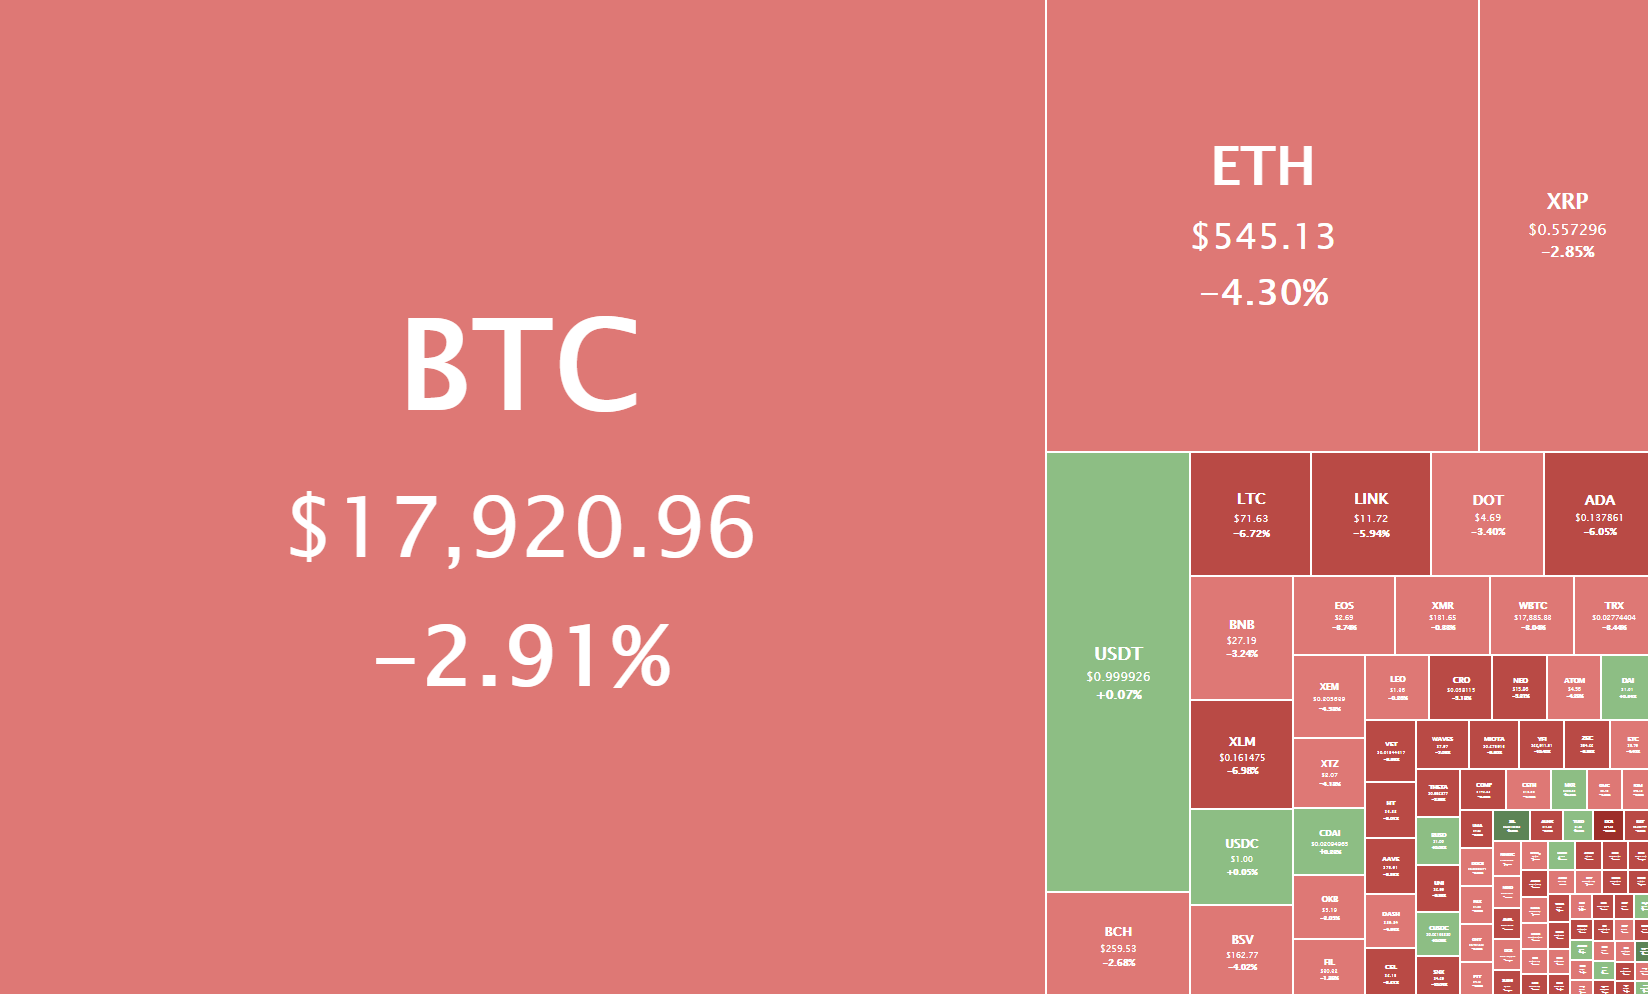
Daily Crypto Sector Heat Map
Freedom Reserve gained 950.51% in the past 24 hours, making it the most prominent daily crypto gainer by far. It is followed by LBRY Credits’s 336.6% and Seigniorage Shares’ 117.99% gain. On the other hand, Basis Cash lost 87.95%, making it the most prominent daily loser. It is followed by xBTC’s loss of 55.09% and IterationSyndicate’s loss of 44.55%.
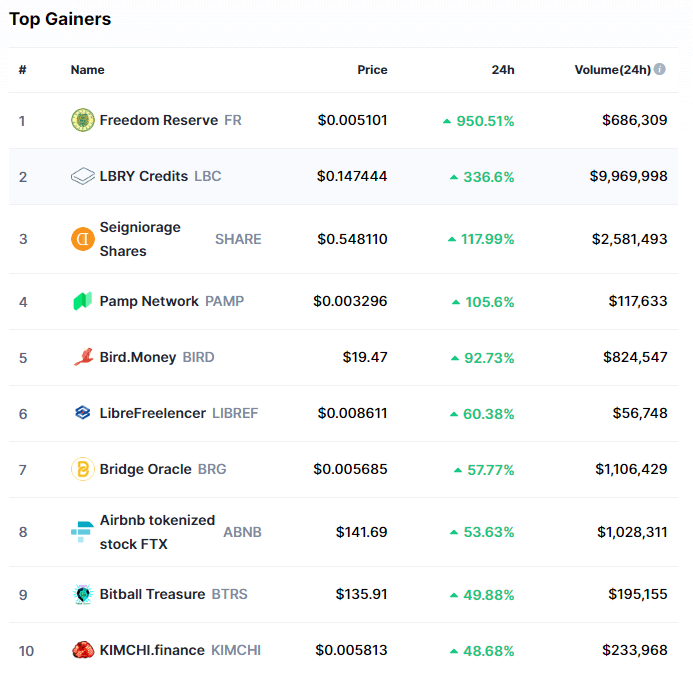
Top 10 24-hour Performers (Click to enlarge)

Bottom 10 24-hour Performers (Click to enlarge)
Bitcoin’s market dominance has moved up less than half a percent since we last reported, with its value currently being 62.8%. This value represents a 0.2% difference to the upside compared to the value it had when we last reported.

Daily Crypto Market Cap Chart
The cryptocurrency sector capitalization has decreased in the past 24 hours, with its current value being $528.97 46.31 billion. This represents a $17.34 billion decrease when compared to our previous report.
_______________________________________________________________________
What happened in the past 24 hours?
_______________________________________________________________________
- Mt. Gox Victims Fear Next Week’s Billion-Dollar Payout Unlikely (Cryptobriefing)
- MassMutual Makes $100 Million Bitcoin Investment (Cryptobriefing)
- Yearn Releases Quarterly Report, a First for DeFi (Cryptobriefing)
- WordPress Users Can Earn Ethereum as Ad Revenue (Cryptobriefing)
- Bitcoin bull case validated again as new trillion-dollar stimulus programs roll out (Cryptoslate)
- German legacy bank turns to Stellar (XLM) to issue Euro stablecoin (Cryptoslate)
- World Economic Forum Wants to Standardize Ethical Data Collection (Coindesk)
- Market Wrap: Bitcoin Briefly Slides Below $18K as ETH Is More Volatile Than BTC in 2020 (Coindesk)
- Millennials will boost Bitcoin adoption for years to come: BlockFi CEO (Cointelegraph)
- Report identifies 18 serious ‘non-financial risks’ for DeFi (Cointelegraph)
_______________________________________________________________________
Technical analysis
_______________________________________________________________________
Bitcoin
Bitcoin has spent most of the day in a price descent after it failed to break the $18,600 mark. BTC bulls tried to pick the price back up but failed, which has caused another mini-dip, which brought the price as low as $17,721 on Bitstamp. The $17,780 level has proven itself as great support once again, and Bitcoin is now trading in a range between it and $18,190.
Due to the amount of support and resistance levels in a narrow price range Bitcoin currently has, a push towards either side could be a possible safe trade to catch.
BTC/USD 2-hour chart
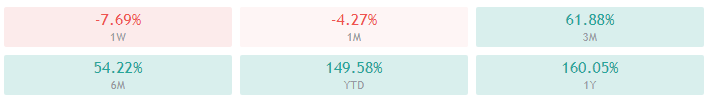
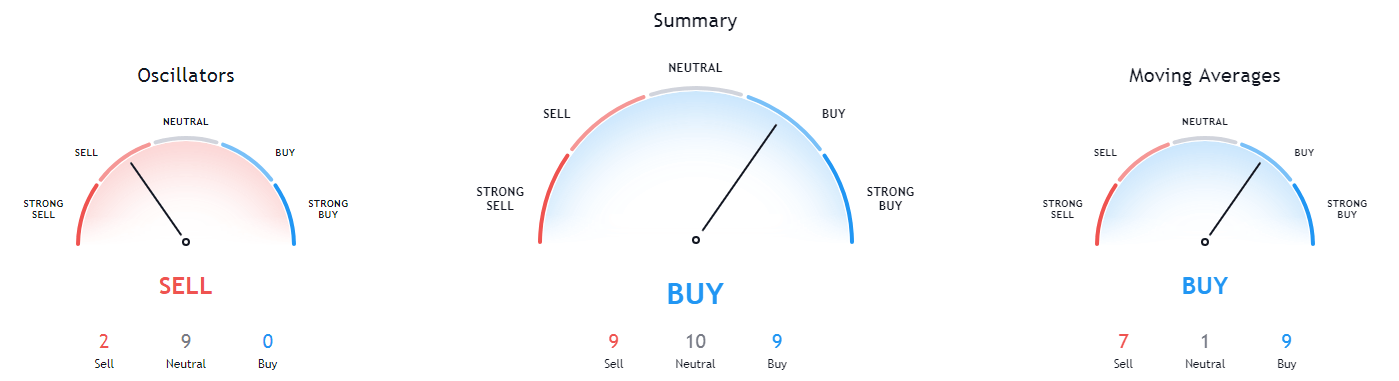
Bitcoin’s short-term technicals are tilted towards the sell-side but show slight signs of neutrality. Its long-time technicals, however, are completely bullish.
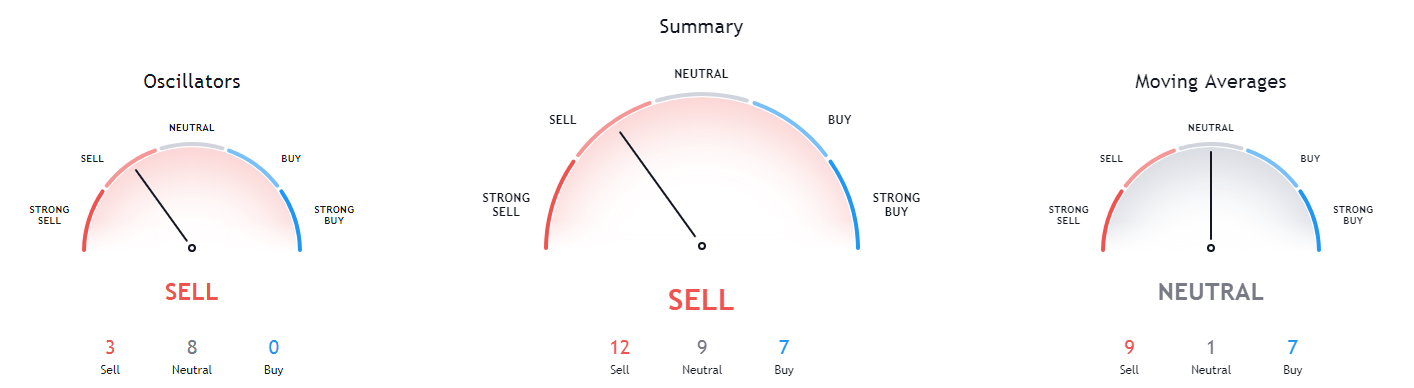
BTC/USD 1-day Technicals
Technical factors (4-hour Chart):
- Price is below both its 50-period and 21-period EMAs
- Price is close to its bottom Bollinger band
- RSI is dipping towards being oversold (36.77)
- Volume is slightly above the average level
Key levels to the upside Key levels to the downside
1: $18,190 1: $17,780
2: $18,600 2: $17,500
3: $18,790 3: $17,200
Ethereum
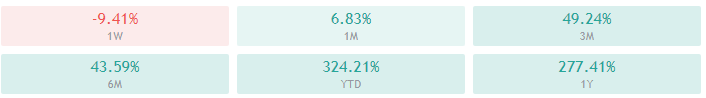
Ethereum has quickly stopped in its tracks towards $600 after hitting a brick wall at $581. The rebound pulled its price back below $565, as well as $545, which it is now fighting for. The fact that Ethereum is in a short-term bear run is confirmed by higher volume candles during price drops than during price spikes.
Our call from yesterday regarding Ethereum’s dip after dropping below $565 turned out as predicted. Traders should pay attention to Bitcoin’s movements and the ascending (red) trend line when trading Etheruem.
ETH/USD 2-hour Chart
Ethereum’s short-term technicals are tilted towards the sell-side but show slight neutral signs. However, its long-time technicals are bullish, with its weekly overview being slightly neutral than its monthly overview.

ETH/USD 1-day Technicals
Technical Factors (4-hour Chart):
- Price is below both its 50-period and 21-period EMAs
- Price is slightly above its bottom Bollinger band
- RSI is dipping towards oversold territory (36.18)
- Volume is slightly above the average level
Key levels to the upside Key levels to the downside
1: $565 1: $545
2: $581 2: $525
3: $600 3: $510
Ripple
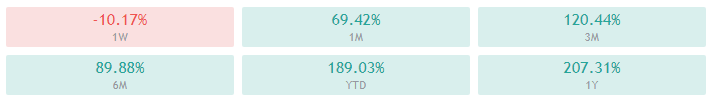
XRP followed the rest of the crypto sector and made a price dip, which brought its price to the $0.543 level, which held up quite nicely. Its price is now recovering and consolidating between $0.543 and $0.57, with no signs of potential movement to either side.
XRP traders should pay attention to Bitcoin’s price movement, as most cryptocurrencies follow the general market direction it sets.
XRP/USD 2-hour Chart
XRP’s 4-hour and daily overviews show confusing signs, with some indicators being bullish and some bearish. Its long-term technicals are, however, completely bullish.
XRP/USD 1-day Technicals
Technical factors (4-hour Chart):
- The price is currently below both its 50-period EMA and its 21-period EMA
- Price is slightly below its middle Bollinger band
- RSI is neutral (41.75)
- Volume is slightly above the average level
Key levels to the upside Key levels to the downside
1: $0.57 1: $0.5435
2: $0.6 2: $0.5
3: $0.63 3: $0.475
Related posts
 Daily Crypto Review, May 15 – Bitcoin Rejected from $10,000 – What’s Next?
 Daily Crypto Review, Jun 03 – Large BTC Miner Capitulation Causing The Price Drop? BTC Under $10,000 Again
 Daily Crypto Review, Jun 10 – Crypto Ransomware Cartels Forming; Market Preparing For A Move
 Daily Crypto Review, Dec 4 – Bitcoin Above $19,000; Ether Fighting for $600