
The cryptocurrency sector has pushed further up as Bitcoin made a new all-time high for a moment. The largest cryptocurrency by market cap is currently trading for $19,443, representing an increase of 5.03% on the day. Meanwhile, Ethereum gained 3.45% on the day, while XRP managed to gain 3.78%.

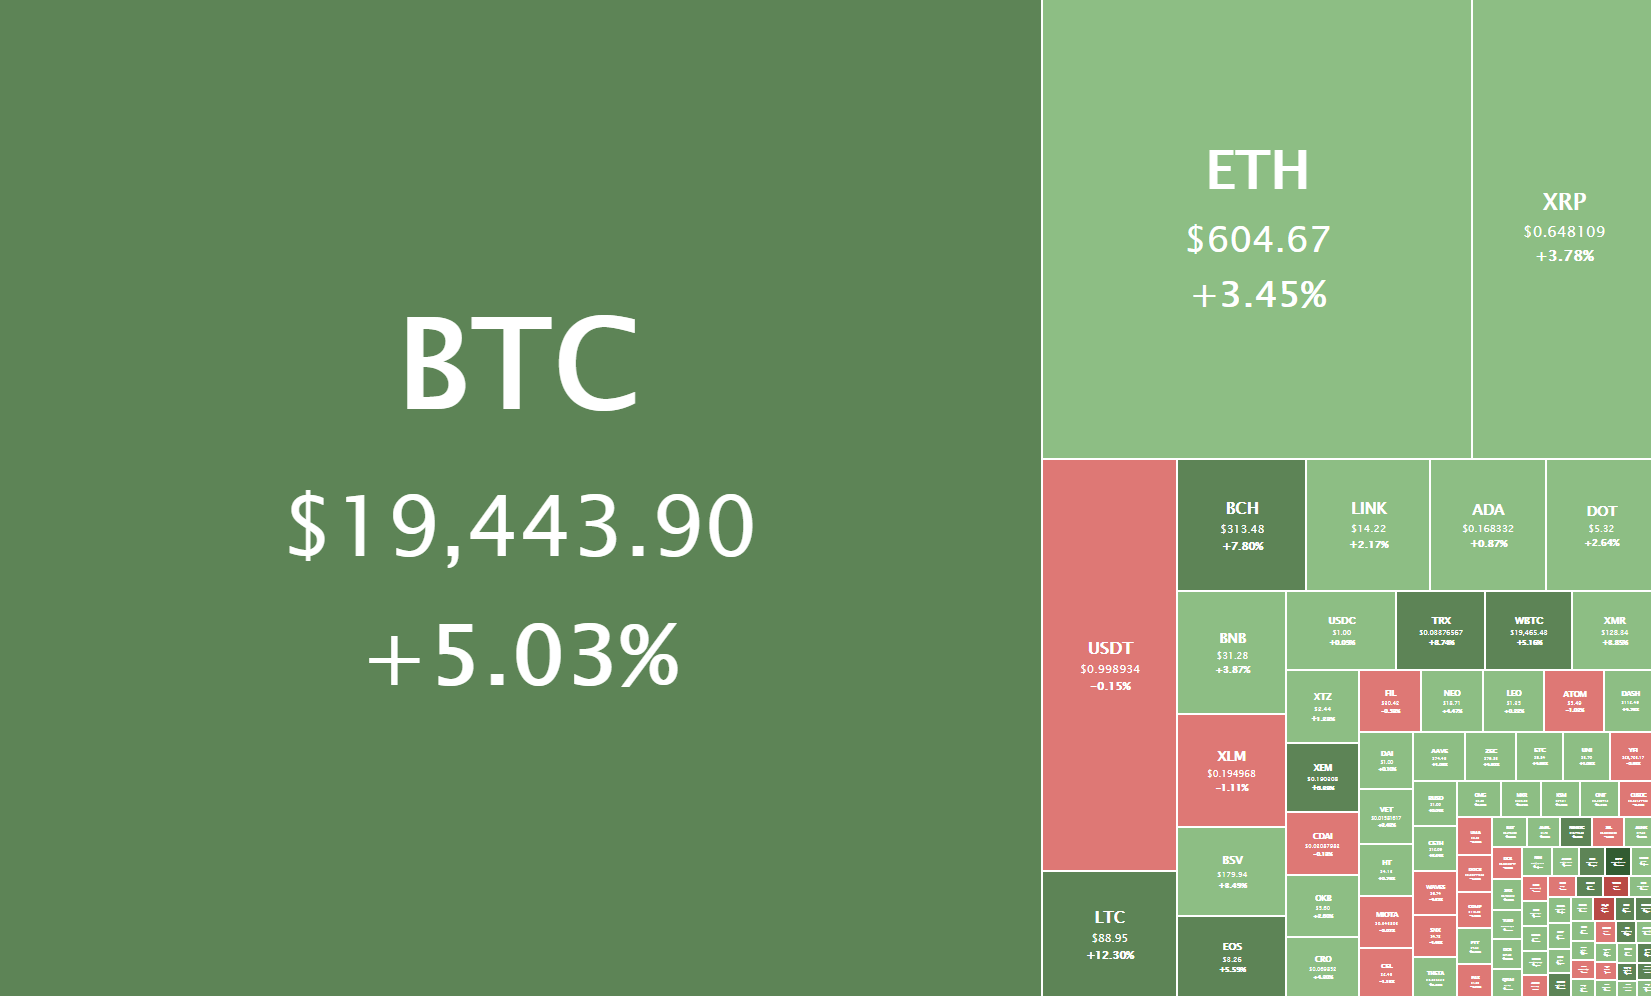
Daily Crypto Sector Heat Map
BitTorrent gained 18.25% in the past 24 hours, making it the most prominent daily gainer in the top100. It is closely followed by Litecoin’s gain of 11.22% and Decentraland’s 7.69% gain. On the other hand, Numeraire lost 4.81%, making it the most prominent daily loser. It is followed by Waves’ loss of 5.78 and Zilliqa’s loss of 3.36%.
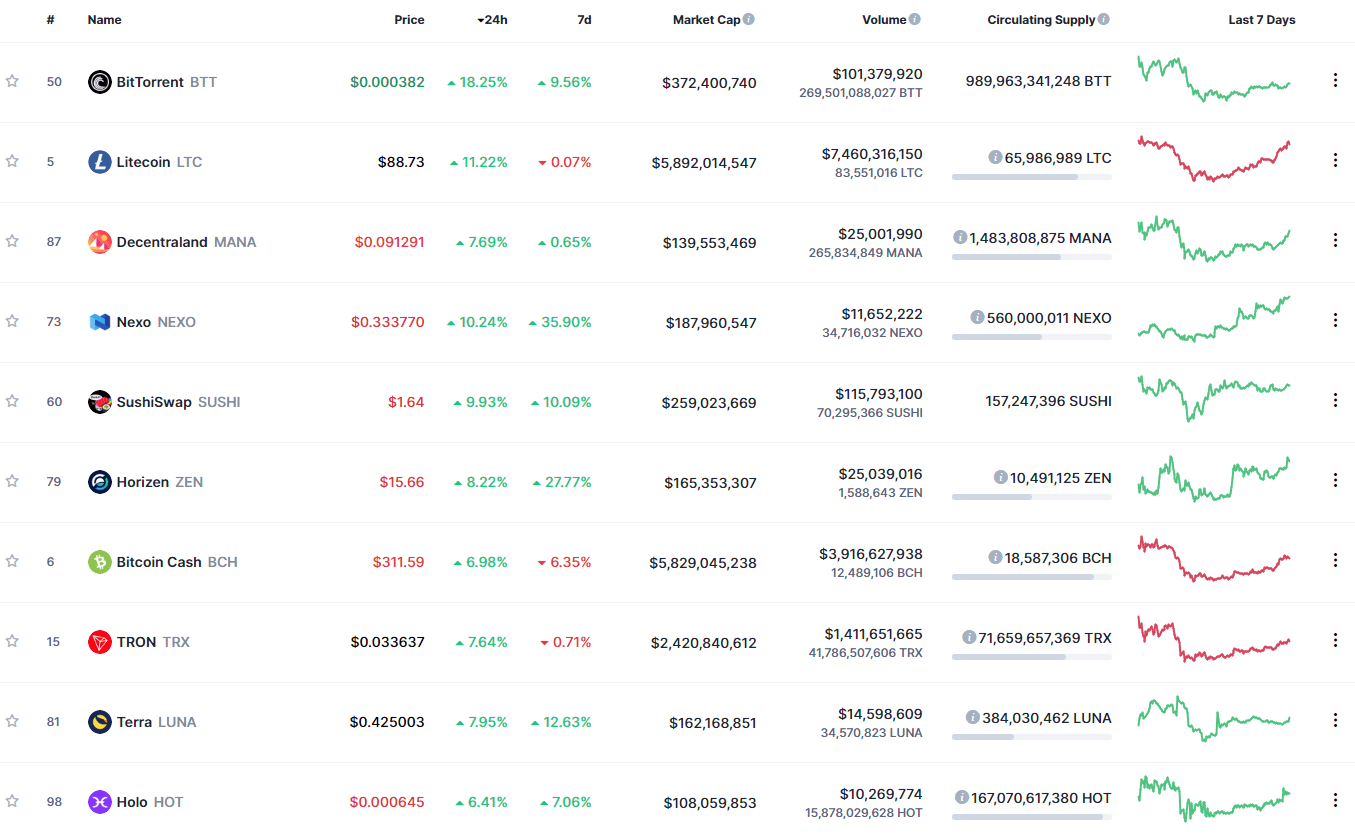
Top 10 24-hour Performers (Click to enlarge)
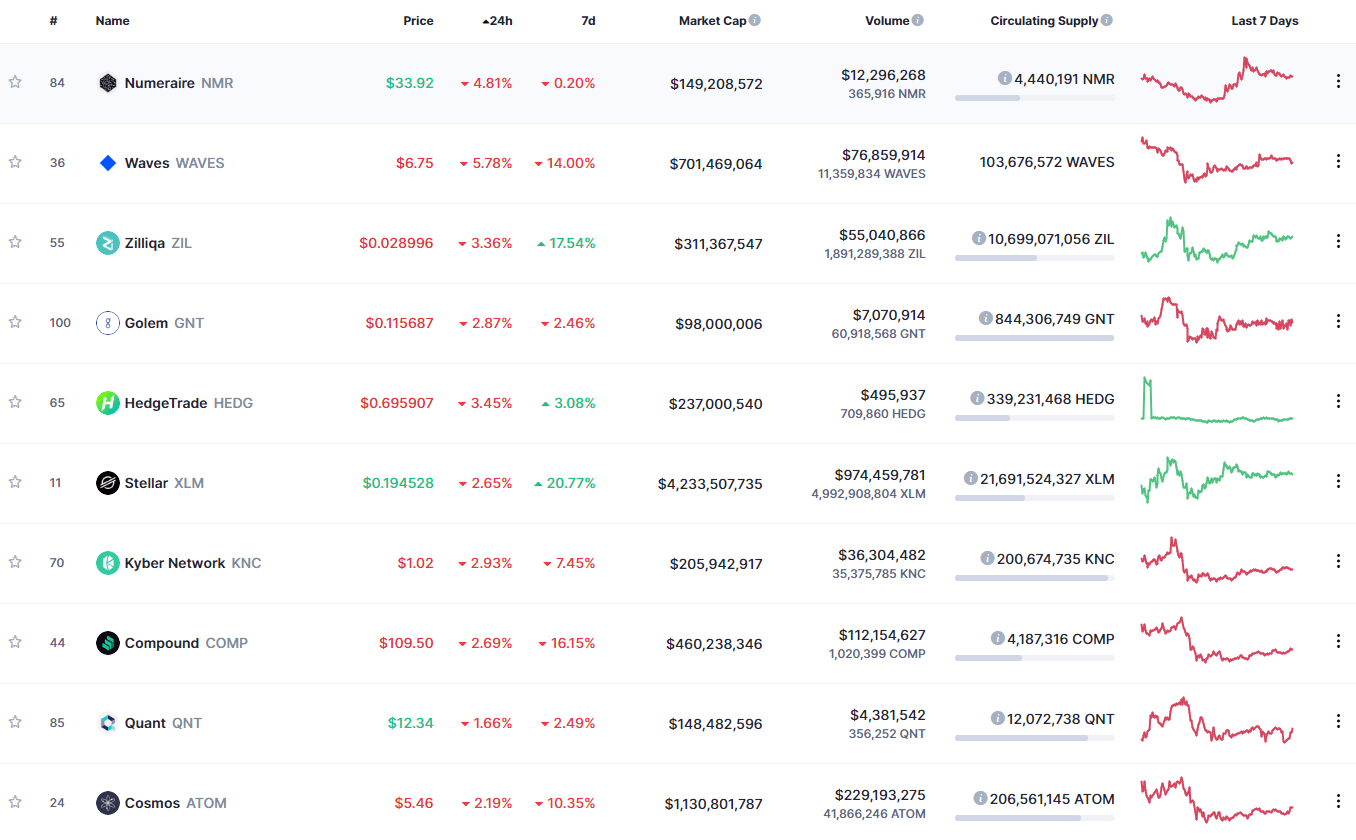
Bottom 10 24-hour Performers (Click to enlarge)
Bitcoin’s market dominance has increased slightly since we last reported, with its value currently staying at 62.4%. This value represents a 0.7% difference to the upside compared to the value it had yesterday.
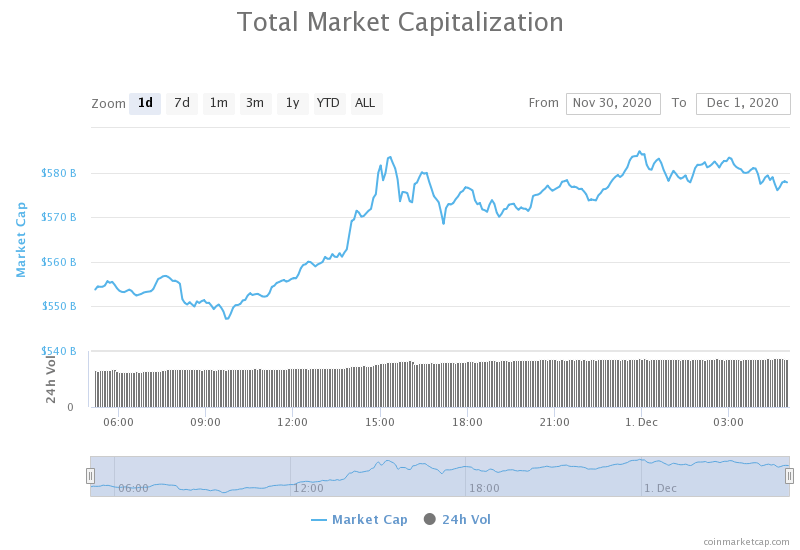
Daily Crypto Market Cap Chart
The crypto sector capitalization has increased significantly in the past 24 hours. Its current value is $577.86 billion, representing a $24.86billion increase compared to our previous report.
_______________________________________________________________________
What happened in the past 24 hours?
_______________________________________________________________________
- Crypto’s largest over-the-counter trading desks are reporting record volumes (The Block)
- BitMEX names German stock exchange veteran as new CEO (The Block)
- Bitcoin soars to all-time highs on several exchanges as gold, equities take a beating (The Block)
- $5.3 Billion Trust Fund Allocating 10% of Assets in Bitcoin (Cryptobriefing)
- $100M of Bitfinex’s Stolen Bitcoin Is in Transit (Cryptobriefing)
- Yearn.finance (YFI) “acquires” yet another DeFi protocol amid massive expansion plans (Cryptoslate)
- Community reacts to new Bitcoin all-time high on top exchanges (Cryptoslate)
- Number of Ethereum nodes surpasses Bitcoin’s for the first time (Cryptoslate)
- Eth2 dev talks about the challenges and lessons learned ahead of mainnet launch (Cointelegraph)
- Venezuelan army starts mining Bitcoin to make ends meet (Cointelegraph)
_______________________________________________________________________
Technical analysis
_______________________________________________________________________
Bitcoin
Bitcoin has spent the day continuing its push towards the upside, even posting a new all-time high (on most exchanges) for a moment as it reached $19,864 on Bitstamp. However, the 20,000 mark and BitMEX’s $20,093 remain untouched. With the buys on exchanges and derivatives markets and institutional investments, a strong all-time high might be posted extremely soon.
Bitcoin trading is quite hard at the moment simply due to how the cryptocurrency moves. Still, traders can squeeze a profit if they trade along with the main trend and long Bitcoin when the volume increases.
BTC/USD 4-hour Chart
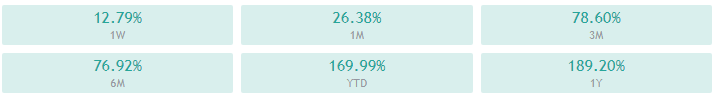
Bitcoin’s technicals on all time-frames are tilted towards the buy-side but show slight neutrality signs, or even slight signs of bearishness.
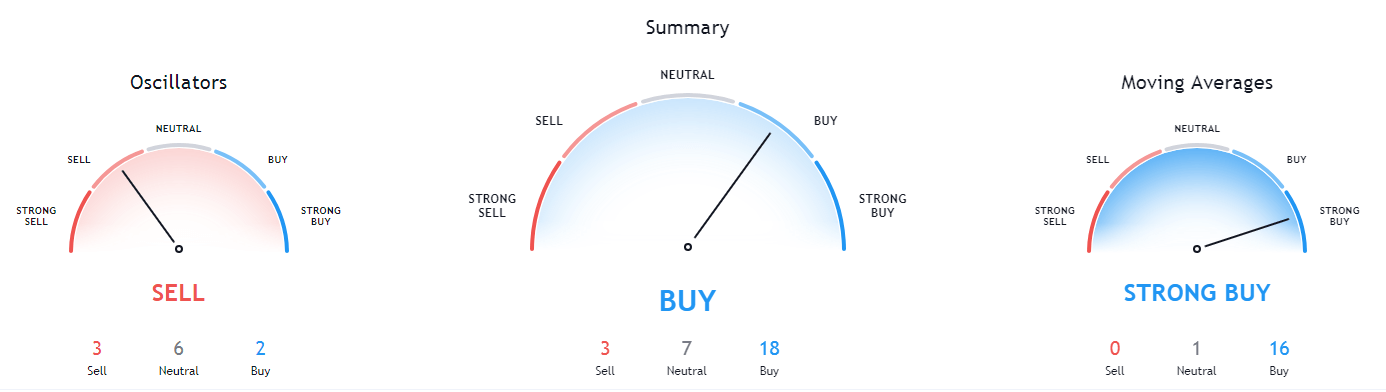
BTC/USD 1-day Technicals
Technical factors (4-hour Chart):
- Price is far above both its 50-period EMA and its 21-period EMA
- Price is near its top Bollinger band
- RSI is near the overbought territory (69.43)
- Volume is average
Key levels to the upside Key levels to the downside
1: $19,500 1: $19,000
2: $19,666 2: $18,790
3: $20,000 3: $18,500
Ethereum
Ethereum has, just like Bitcoin, continued its climb up. However, the move has stopped slightly below its most recent highs, topping at $617.87. The second-largest cryptocurrency by market cap now has two scenarios to play out:
- It can create a double top and start moving back towards the supporting levels;
- It can continue moving up on fundamentals and break the recent high and the recent trading patterns it created.
Ethereum’s current fundamental outlook is extremely bullish due to its Phase 0 of Ethereum 2.0 launching. This, along with Bitcoin moving towards the upside, has made trading any potential pullbacks quite impossible due to the amount of potential risk such trade would carry.
ETH/USD 4-hour Chart
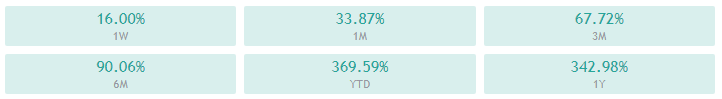
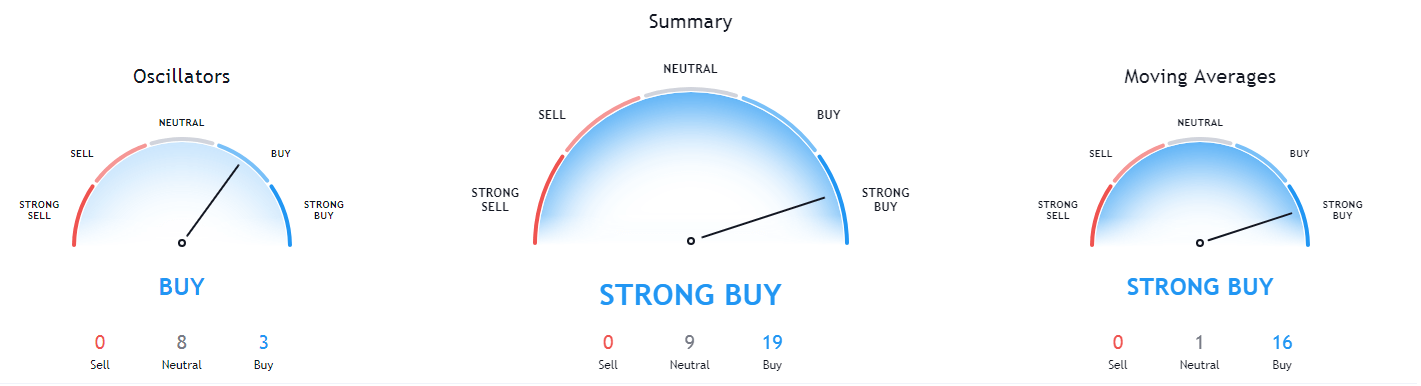
Ethereum’s 4-hour, daily, and monthly technicals are extremely bullish and show no signs of neutrality. On the other hand, its weekly time-frame’s sentiment is bullish but shows some neutrality.
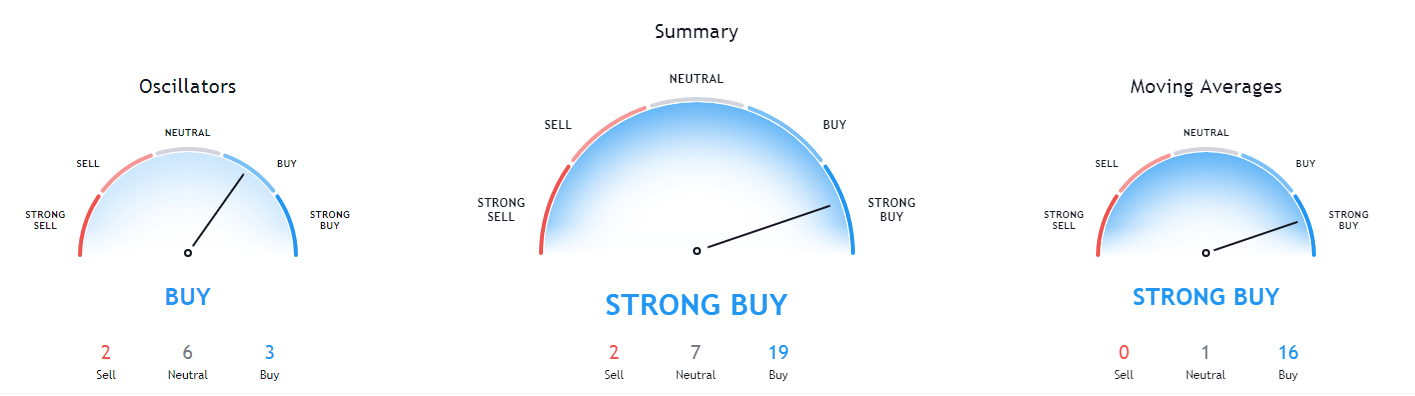
ETH/USD 1-day Technicals
Technical Factors (4-hour Chart):
- The price is far above both its 50-period and its 21-period EMA
- Price is near its top Bollinger band
- RSI is near being overbought (68.63)
- Volume is average
Key levels to the upside Key levels to the downside
1: $600 1: $510
2: $630 2: $500
3: $735 3: $490
Ripple
The fourth-largest cryptocurrency by market cap has tried moving up, as well, but in a much tamer manner. XRP has established its presence above $0.625 and pushed towards $0.666, which stopped the move. XRP will most likely continue trading in a range-bound by $0.666 to the upside and either $0.625 or $0.596 to the downside
Trading XRP is quite difficult at the moment, and trading Bitcoin or Ethereum is potentially more profitable and slightly more straightforward.
XRP/USD 4-hour Chart
XRP’s technicals on the 4-hour and weekly time-frames are bullish but show some signs of neutrality. On the other hand, its daily and monthly overviews are completely bullish.
XRP/USD 1-day Technicals
Technical factors (4-hour Chart):
- The price is above its 50-period EMA and slightly above its 21-period EMA
- Price is between its middle and top Bollinger band
- RSI is neutral (60.95)
- Volume is average
Key levels to the upside Key levels to the downside
1: $0.666 1: $0.625
2: $0.78 2: $0.596
3: $0.79 3: $0.535
Related posts
 Daily Crypto Review, Sept 9 – Will DeFi Bubble Burst, Send Ethereum to Freefall?
 Daily Crypto Review, Sept 14 – The EU Regulating Stablecoins; Crypto Market Preparing For a Move
 Daily Crypto Review, Sept 25 – ETH Options Traders Like Trading Below $360; Crypto Market In the Green
 Daily Crypto Review, Oct 13 – G7 Will Continue to Oppose Libra; Bitcoin Consolidating After Another Bull Run