Newcomers in cryptoverse can be easily baffled by the myriad of things to learn and understand. ‘Ethereum has hit the highest 3-week close since the last bull run,’ and other such phrases are common in this industry. Then, there are charts that track the movement of different performance indicators in real-time. To add to the confusion, experts often differ on investment advice and the impact of various events in the industry.

This article will help to simplify some of the common crypto market issues you will need to understand. It’s by no means a comprehensive guide for trading crypto, but it will give you that head-start you need to get going.
Crypto Buzzwords
Buzzwords are a common feature of the crypto market and a common source of confusion at that. Normally, a well-written crypto article will not be without a dozen buzzwords. Some writers use crypto jargon purely for flair. But we will agree that these catchphrases have a way of hammering in opinions that would otherwise fly under the radar.
To understand crypto market data, it is important to familiarize yourself with the industry glossary. There are a couple of basic phrases like bull and bear markets, trading sideways, support and resistance, candles, etc., that you may need to learn. You can always refer to your glossary when analyzing market data, but don’t you think the market data is already complex enough? You can make things easier by learning some market terminology beforehand on web resources such as Coinmarketcap‘s glossary page.
Market Indicators
What is a crypto market without indicators? Due to the volume of activity on such markets, it’s impossible to track them on individual trades. Therefore, pros use indicators as quick reference guides for reading what the markets are trying to say. There could be a bunch of indicators used in crypto markets, but these are the most useful ones:
- Price – It shows how much a crypto asset is trading against the dollar or another base currency. By itself, price doesn’t matter. What’s more important is price movement – that is, the change in price over a certain period (typically 24 hours). These changes are usually marked by opening and closing prices.
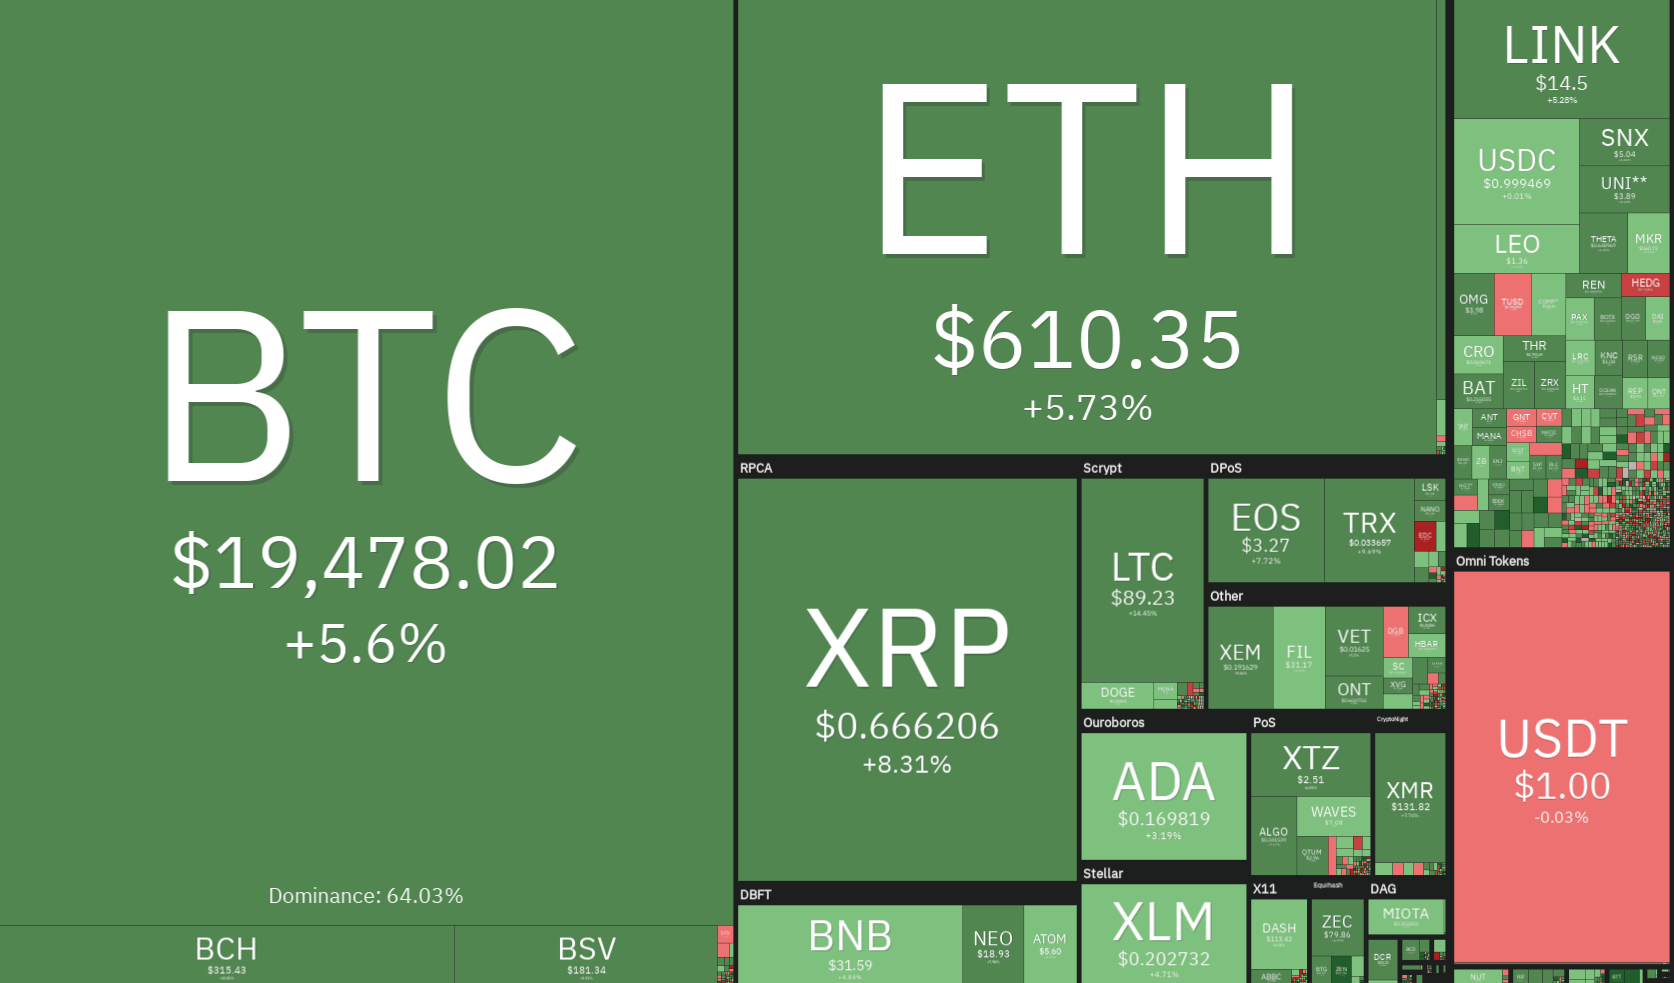
- Market capitalization – It shows the total value of assets in a given market. Most investors believe a high market cap is a characteristic of a low-risk-low-return portfolio.
- Volume – It shows how active investors are buying and selling assets. High volumes are usually indicative of a ‘hot’ crypto.
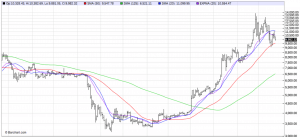
Understanding Charts
Charts are an essential part of representing market data. Whether you’re looking at crypto or forex markets, these graphical data representation tools are inevitable. While newcomers may look at charts as beautiful pictures, market pros track these graphics continuously to know how different assets perform against certain indicators.
Charts are pretty easy to understand. Basically, they show a certain aspect of a crypto is changing over time. There are several important charts that you need to be aware of:
- Price charts – Price charts are the most common charts you will see when reviewing crypto market data. They provide you with real-time information regarding the price movement of a given crypto. Most price charts are simple X-Y graphs with day/month/year on one side and prices on the other. You can find easy-to-interpret price charts, among other sites, on Yahoo Finance or Tradingview. As a bonus, most charts are interactive – that is, they allow you to adjust the period for which you wish to view, zoom in to a specific day, and so on. It is highly unlikely that you will experience difficulty in interpreting price charts.
- Fear and greed index – The fear and greed index seeks to represent the general level of fear or greed among investors. Investors like to give off the vibe that they’re purely analytical human beings, but the truth is they’re pretty emotional. And that’s why when fear spreads in the industry, investors pull out of the market. If we were to express fear and greed mathematically, these two emotions would be inversely proportional to each other – as fear rises, investor greed declines, and vice versa. You can find a good fear and greed index chart on CNN Money, where the index was invented. Well, this is the original index, which was customized for capital markets investors. If you want one specific to crypto markets, you could check out the chart on Btctools.com.
- Market cap charts – Market capitalization tells you how much worth is a given market, in total. Simply put, multiply the price of a unit of an asset by the total number of assets outstanding, and you get the market cap. You need to understand market cap charts because they give you an idea of how stable that market is. Generally, traders assume that markets with a high market cap (such as Bitcoin) are less conservative and thus less risky in the long run.
- Volume charts – A volume chart shows the level of trading activity in a given market. High volumes indicate positive investor sentiment. And just like economic inflation, rising market volumes suggest that things are looking up for that crypto.
- Combined charts – These charts put all the indicators (price, volume, market cap) on the same diagram. Each indicator is then marked by a differently-colored line and a key provided.
Where to Get Reliable Market Data
Getting reliable market data is key to understanding crypto markets and making the right investment decisions. When looking for information, go for reputable sources such as Investopedia, Coinmarketcap, Coindesk, and others. Some data sources may be outdated or just plain incorrect. You know how non-factual data can be misleading. So, when analyzing crypto market data, choose reliable sources.
Influencer Opinions
Listening to industry influencers is also a great way to understand crypto markets. The opinions of such people have the power of swaying investor sentiment. For instance, if Richard Branson says that he thinks Bitcoin is a ‘get-rich-quick scheme,’ some investors may back off a little.
Now, you listen to influencers to get pointers on what to look out for. Most of the time, influencers tend to raise controversy, perhaps, just for the sake of it. So, don’t take their word for it – always research wider.
Final Thoughts
Understanding crypto markets isn’t that hard after all. If you learn a few buzzwords, understand market indicators, know how to read different charts and where to get reliable market information, you could very well soon sound like a pro investor. This was just a basic guide to understanding crypto markets. Always read wide and keep informed. Good luck.