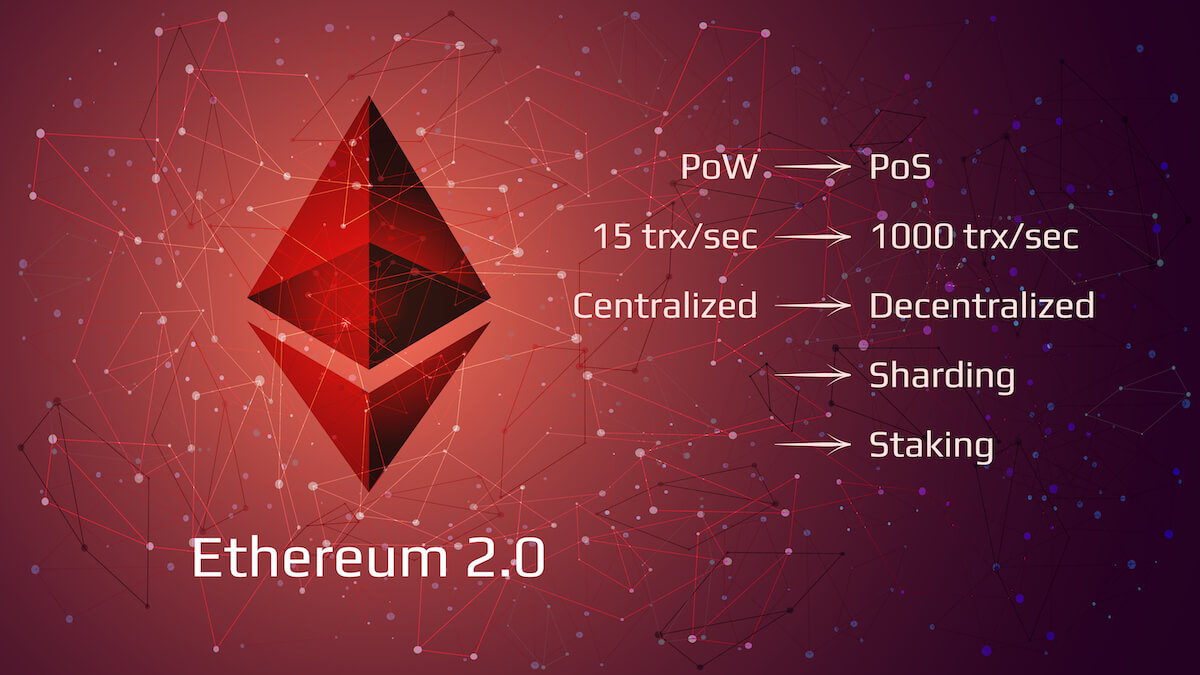
The cryptocurrency sector has dipped as the market entered a “selloff” mode the moment Ethereum’s 2.0 Phase 0 launched. The largest cryptocurrency by market cap is currently trading for $18,843, representing a decrease of 3.83% on the day. Meanwhile, Ethereum lost 2.83% on the day, while XRP managed to lost 6.17%.

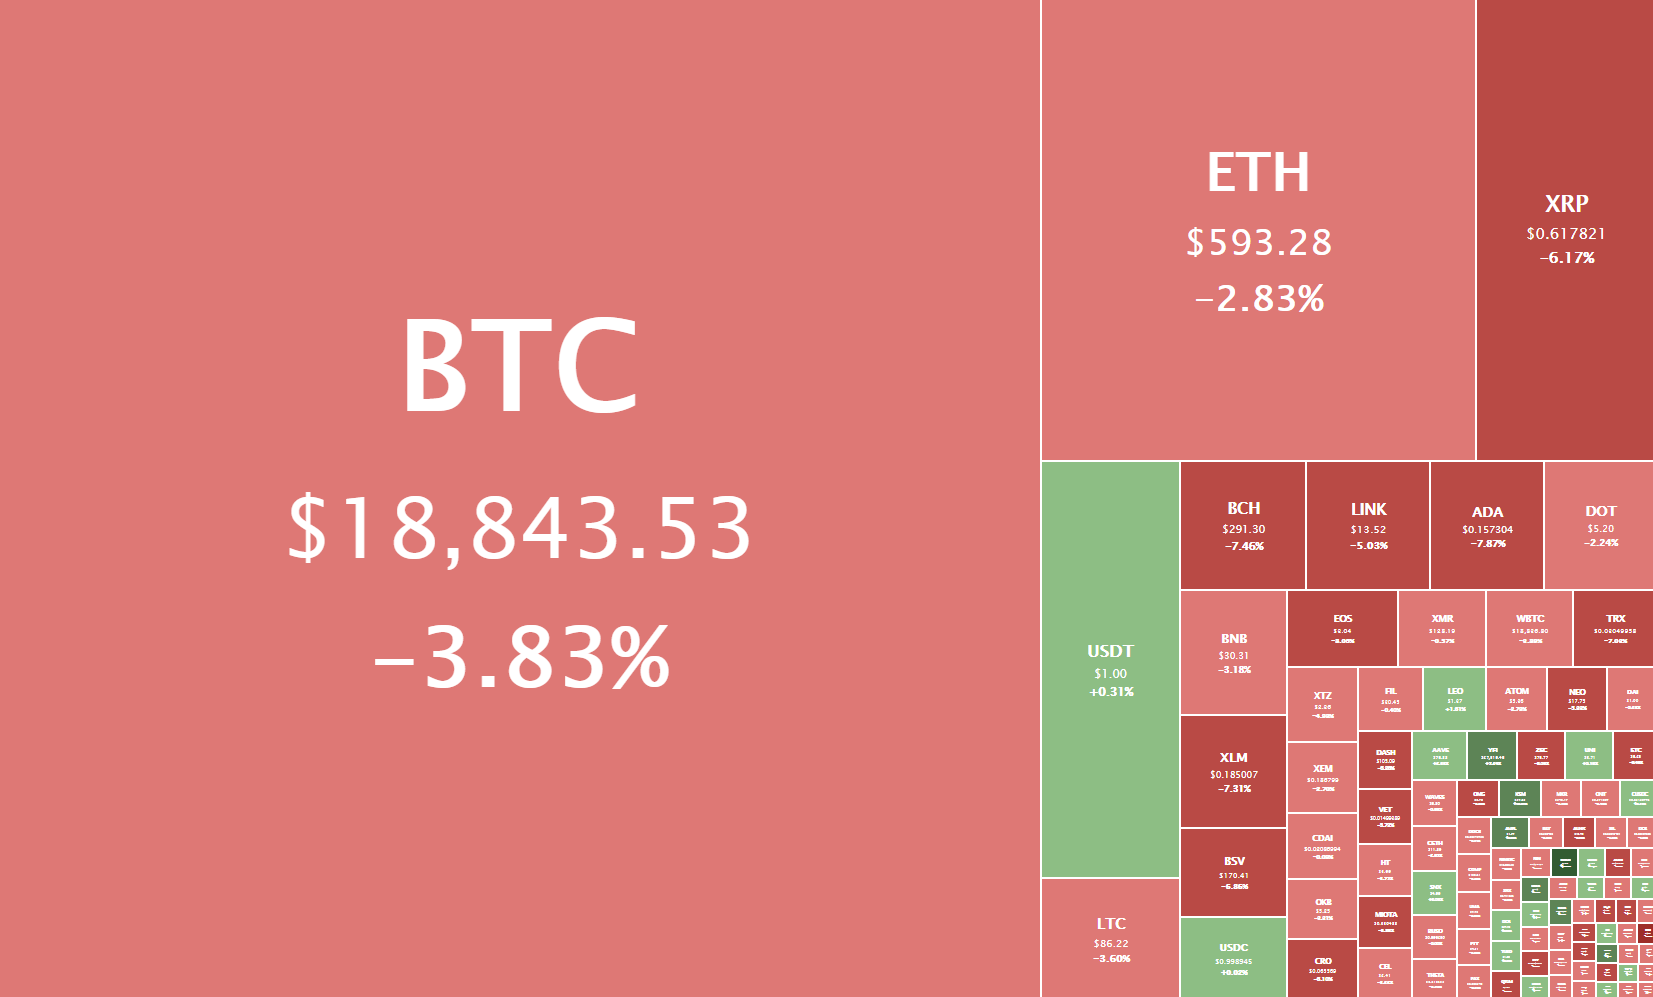
Daily Crypto Sector Heat Map
SushiSwap gained 34.83% in the past 24 hours, making it the most prominent daily gainer in the top100. It is closely followed by Kusama’s gain of 10.74% and Ampleforth’s 9.05% gain. On the other hand, HedgeTrade lost 10.21%, making it the most prominent daily loser. It is followed by Horizen’s loss of 9.44% and Ethereum Classic’s loss of 8.77%.

Top 10 24-hour Performers (Click to enlarge)
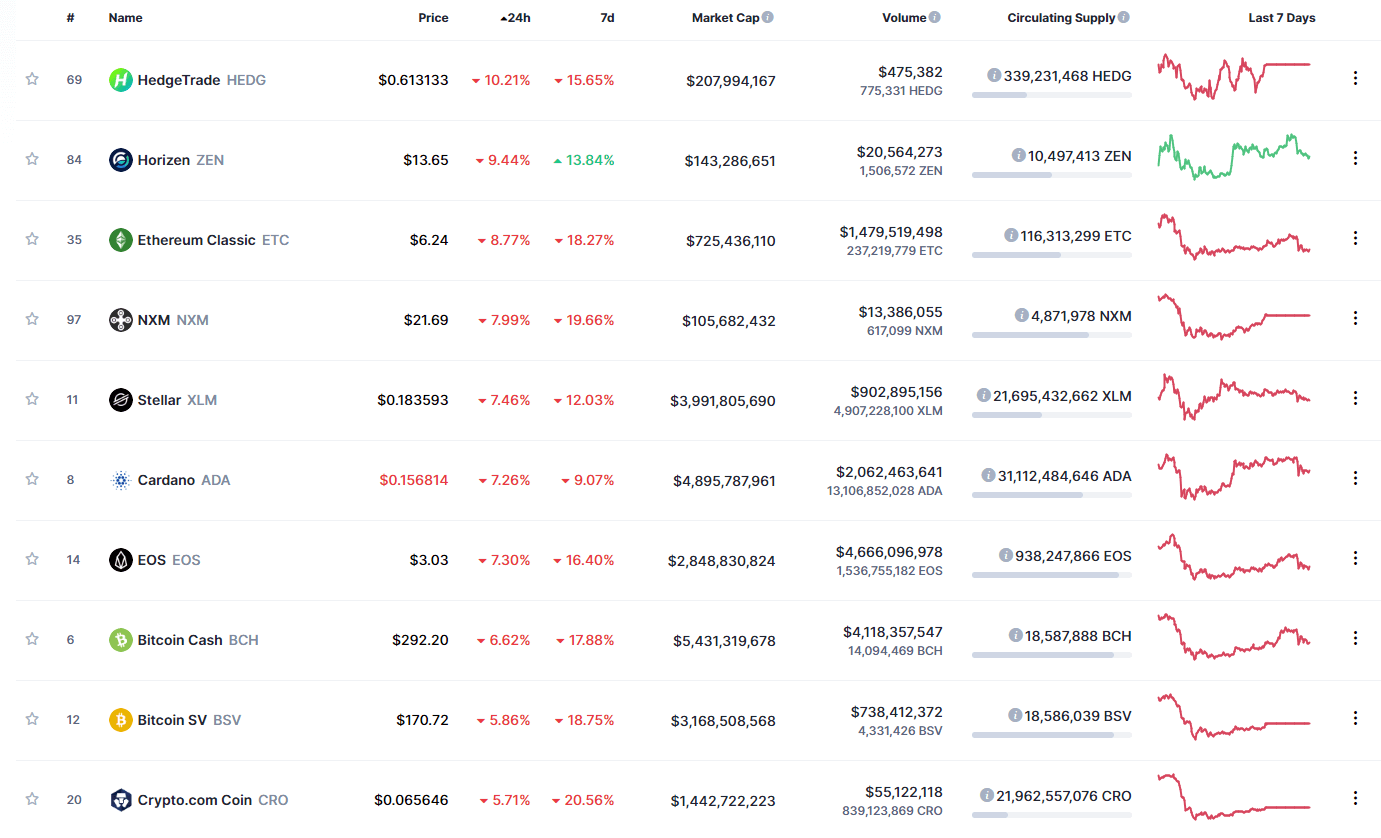
Bottom 10 24-hour Performers (Click to enlarge)
Bitcoin’s market dominance has decreased slightly since we last reported, with its value currently staying at 62.3%. This value represents a 0.1% difference to the downside when compared to yesterday’s value.
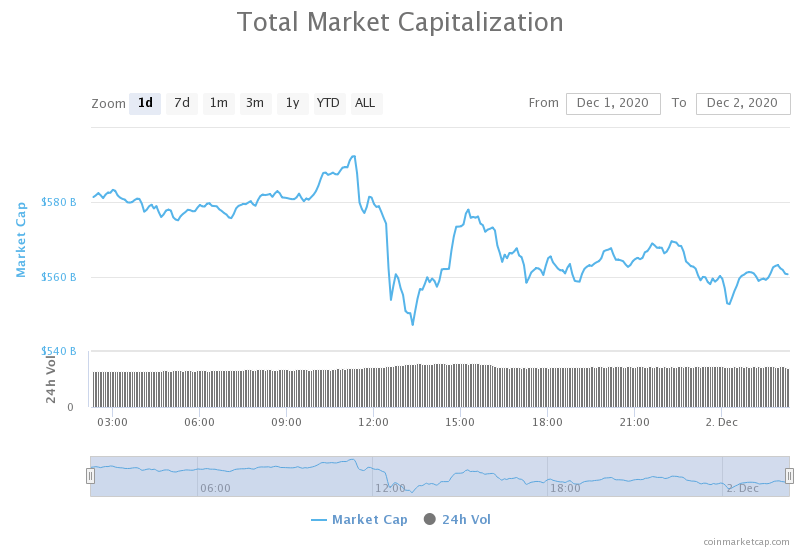
Daily Crypto Market Cap Chart
The crypto sector capitalization has decreased significantly in the past 24 hours. Its current value is $560.78 billion, representing a $17.09 billion increase compared to our previous report.
_______________________________________________________________________
What happened in the past 24 hours?
_______________________________________________________________________
- Crypto exchange volume soared in November, reaching $289.25 billion for the month (The Block)
- Libra rebrands to ‘Diem’ in bid to shake off the negative first impression of regulators (The Block)
- Crypto exchange Binance unveils new staking service for Eth2 (The Block)
- SUSHI surges 30% to multi-week highs after massive Yearn.finance (YFI) partnership (Cryptoslate)
- Yearn Announces Two More DeFi Mergers (Cryptobriefing)
- PayPal’s Bitcoin Adoption Expands PAX Stablecoin by $100 Million (Cryptobriefing)
- Coinbase Brokered MicroStrategy’s $425M Bitcoin Purchase, Exchange Says (Coindesk)
- Privacy Concerns Over Bitcoin Upgrade Taproot Are a ‘Non-Issue,’ Experts Say (Coindesk)
- Pomp talks Shark Tank’s Kevin O’Leary into buying ‘a little more’ Bitcoin (Cointelegraph)
- Dwight, not Wright: ‘I am Satoshi Nakamoto,’ says beet farming #BitcoinTuesday star (Cointelegraph)
_______________________________________________________________________
Technical analysis
_______________________________________________________________________
Bitcoin
Bitcoin has spent the day pulling back from its all-time highs and towards the $18,500 level. Its price formed a triangle formation on the 30-minute time-frame right after the price dump (which happened at the exact moment ETH 2.0 Phase 0 launched, as people were selling the news) and then broke it to the downside. Its price is now fighting for the $18,790 level (78.6% Fib retracement).
Bitcoin is quite volatile and unpredictable at the moment, but short trades in either direction could be viable. Traders should pay attention to volume and watch smaller time-frames and catch formations to trade off of them.
BTC/USD 30-minute chart
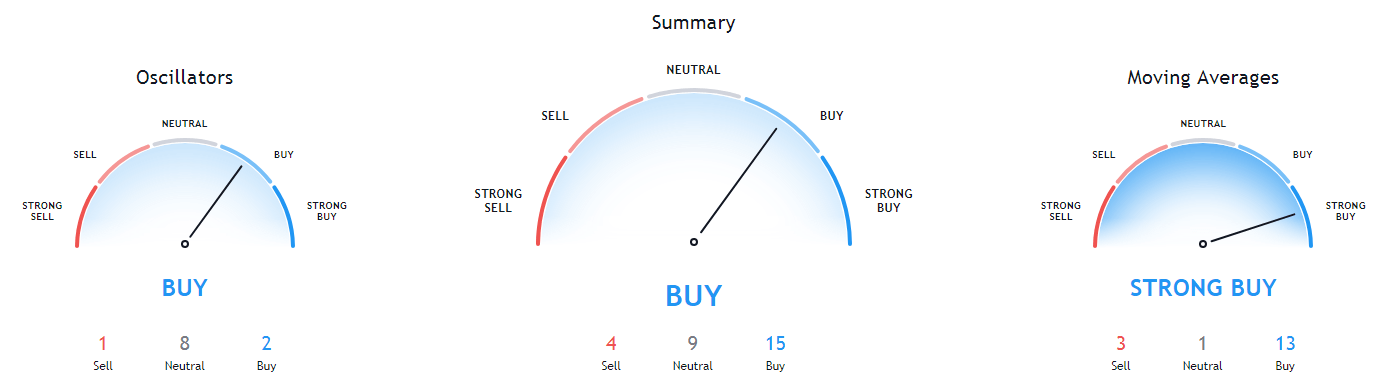
Bitcoin’s technicals on all time-frames are slightly tilted towards the buy-side. However, they show slight neutrality signs, except for the monthly overview, which is completely bullish.
BTC/USD 1-day Technicals
Technical factors (4-hour Chart):
- Price is far above its 50-period EMA and at its 21-period EMA
- Price is at its middle Bollinger band
- RSI is near the overbought territory (52.95)
- Volume is average
Key levels to the upside Key levels to the downside
1: $19,000 1: $18,790
2: $19,500 2: $18,500
3: $19,666 3: $18,240
Ethereum

Ethereum has, just like Bitcoin, pulled back as traders sold the news of ETH 2.0 Phase 0 launching. While its move wasn’t as pronounced, the second-largest cryptocurrency by market cap did lose quite a bit of value, as well as most likely confirmed its position below $600. The double top formation was confirmed, which added to the decisiveness of the drop.
Ethereum traders should pay close attention to Bitcoin’s movement, as it currently dictates the market direction regardless of what news moves the market (news on Bitcoin or any other altcoin).
ETH/USD 4-hour Chart
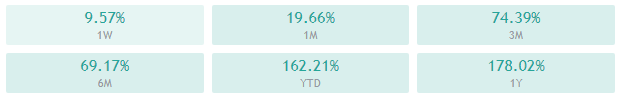
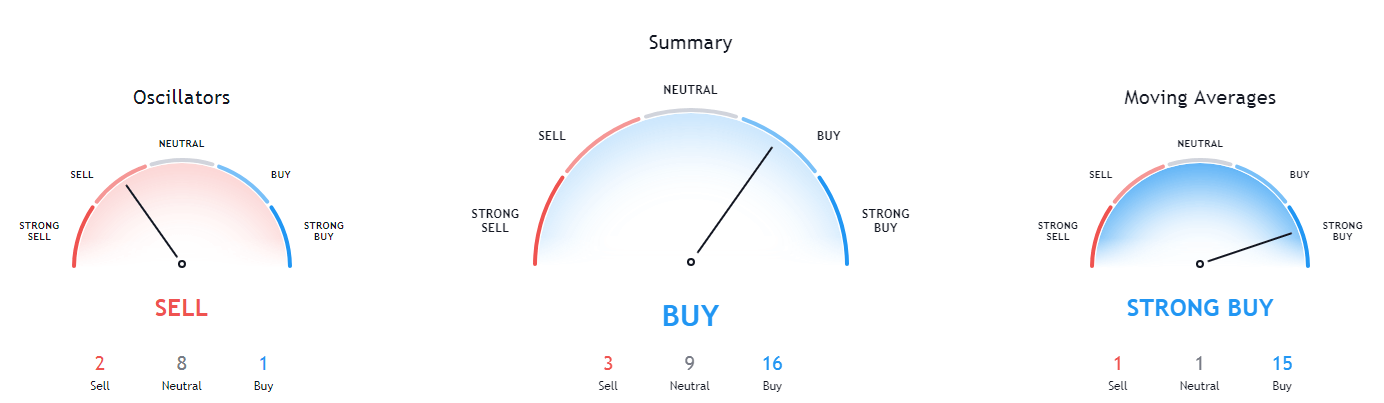
Ethereum’s daily and monthly technicals are completely bullish and show no signs of neutrality. However, its 4-hour and weekly time-frames’ sentiment is bullish but shows some neutrality.
ETH/USD 1-day Technicals
Technical Factors (4-hour Chart):
- The price is far above its 50-period and at its 21-period EMA
- Price is at its middle Bollinger band
- RSI is near being overbought (55.86)
- Volume is average
Key levels to the upside Key levels to the downside
1: $600 1: $510
2: $630 2: $500
3: $735 3: $490
Ripple
The fourth-largest cryptocurrency by market cap had a pretty slow day, with its price hovering slightly above the $0.6 mark. Its price did feel the push towards the downside that the whole crypto sector experienced, but to a much lesser extent. XRP has found support at its 4-hour 50-period moving average, above which it is currently trading.
Trading XRP is almost certainly an inferior option to trading Bitcoin and Ethereum at the moment, as both the volume and volatility are low.
XRP/USD 4-hour Chart
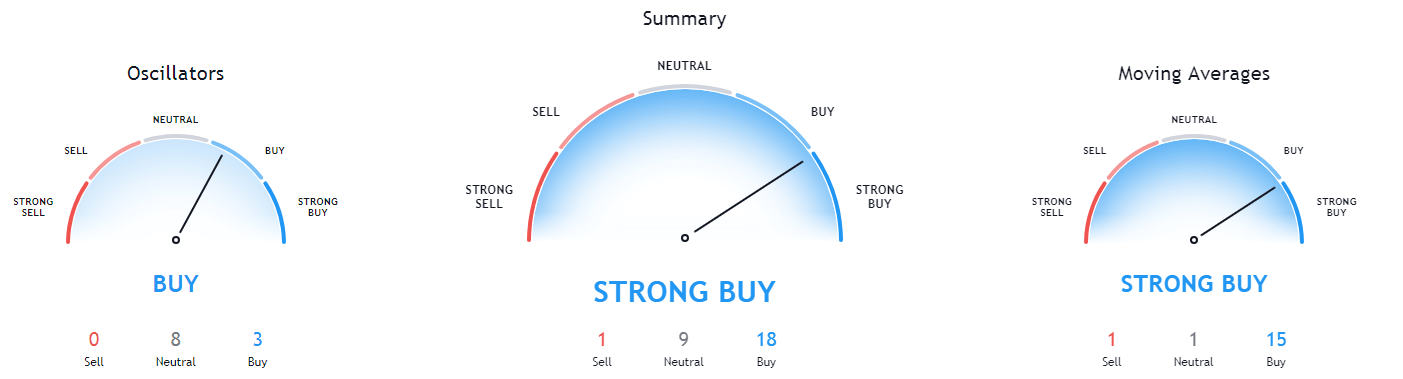
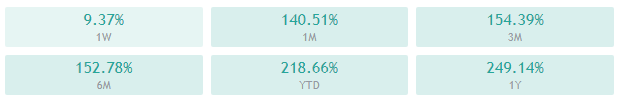
XRP’s daily and monthly technicals are completely bullish and show no signs of neutrality. However, its 4-hour and weekly time-frames’ sentiment is bullish but shows some neutrality.
XRP/USD 1-day Technicals
Technical factors (4-hour Chart):
- The price is slightly above its 50-period EMA and slightly below its 21-period EMA
- Price is slightly below its middle Bollinger band
- RSI is neutral (49.86)
- Volume is below average
Key levels to the upside Key levels to the downside
1: $0.666 1: $0.625
2: $0.78 2: $0.596
3: $0.79 3: $0.535
Related posts
 Daily Crypto Review, Apr 23 – Binance confirms – Facebook’s Libra back in play; Bitcoin above $7,000
 Daily Crypto Review, Sept 2 – Ethereum Pushing Towards $500; Decentralized Exchanges Volume Surges
 Daily Crypto Review, Sept 4 – Bitcoin at $10,000: What Happened? Detailed Price Level Analysis
 Daily Crypto Review, Sept 8 – Peter Schiff Buying More Bitcoin; Investors Keep Buying BTC Despite Downside Potential