
The cryptocurrency market has been decimated after Bitcoin plummeted below $11,000. Bitcoin is currently trading for $10,260, which represents a decrease of 10.02% on the day. Meanwhile, Ethereum lost 12.07% on the day, while XRP lost 9.21%.
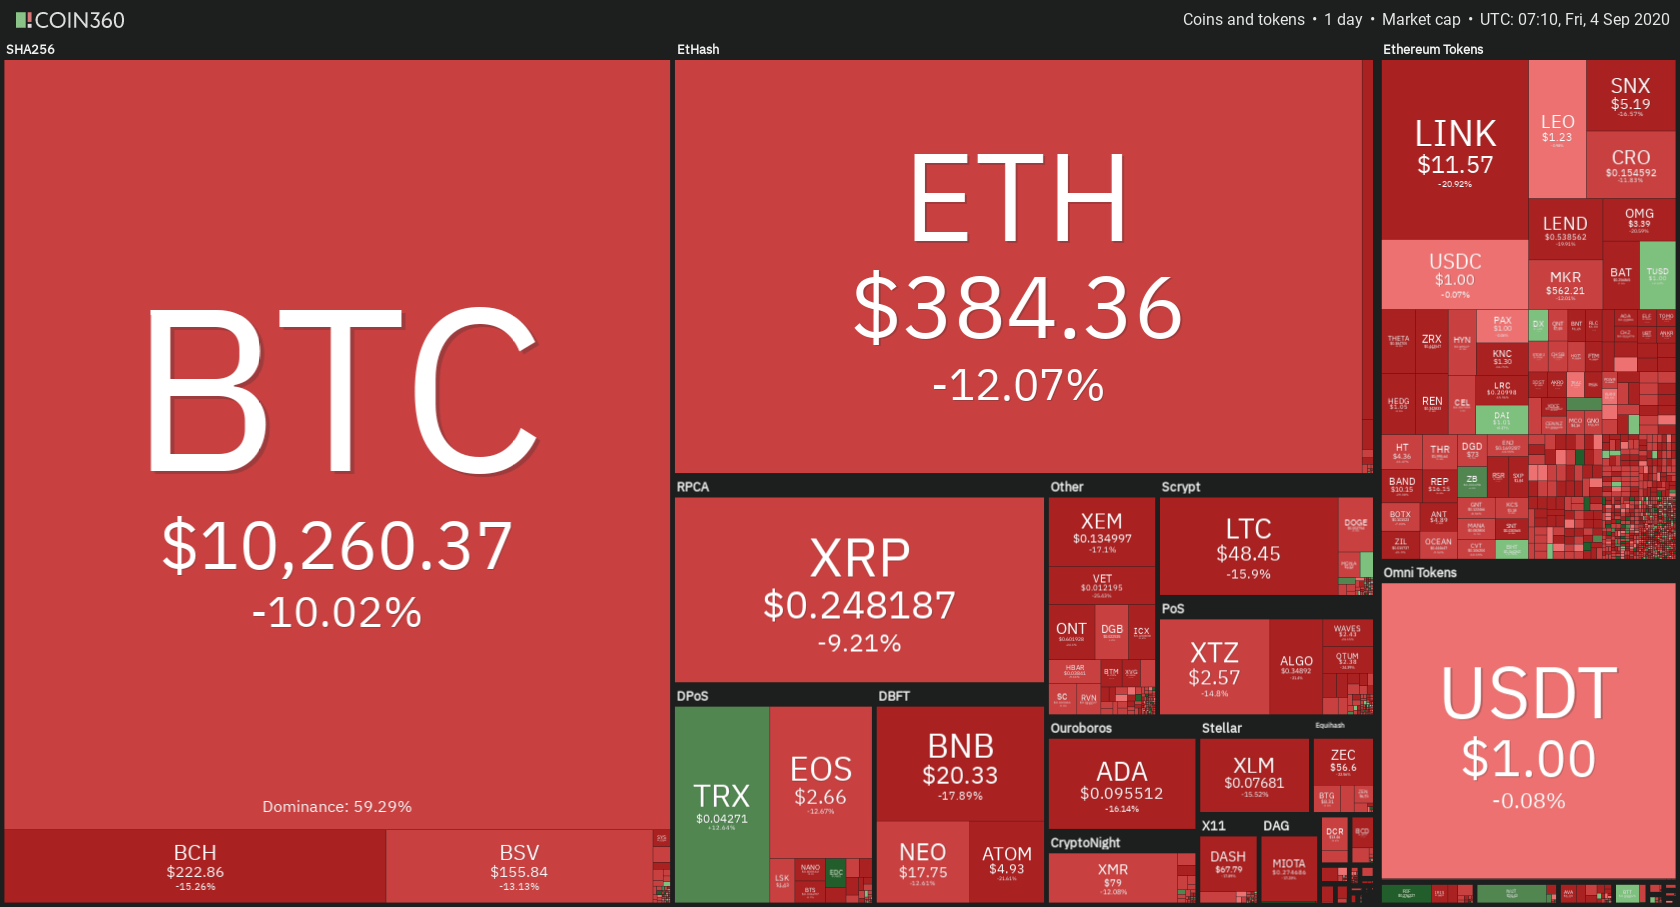
Daily Crypto Sector Heat Map
When taking a look at the top100 cryptocurrencies, TRON gained 15.35% on the day, making it the most prominent daily gainer. Celo (13.98%) and ZB Token (8.75%) also did great. On the other hand, the Ampleforth lost 33.29%, making it the most prominent daily loser. It is followed by Sushi Swap’s loss of 32.41% and DFI. Money’s drop of 32.28%.
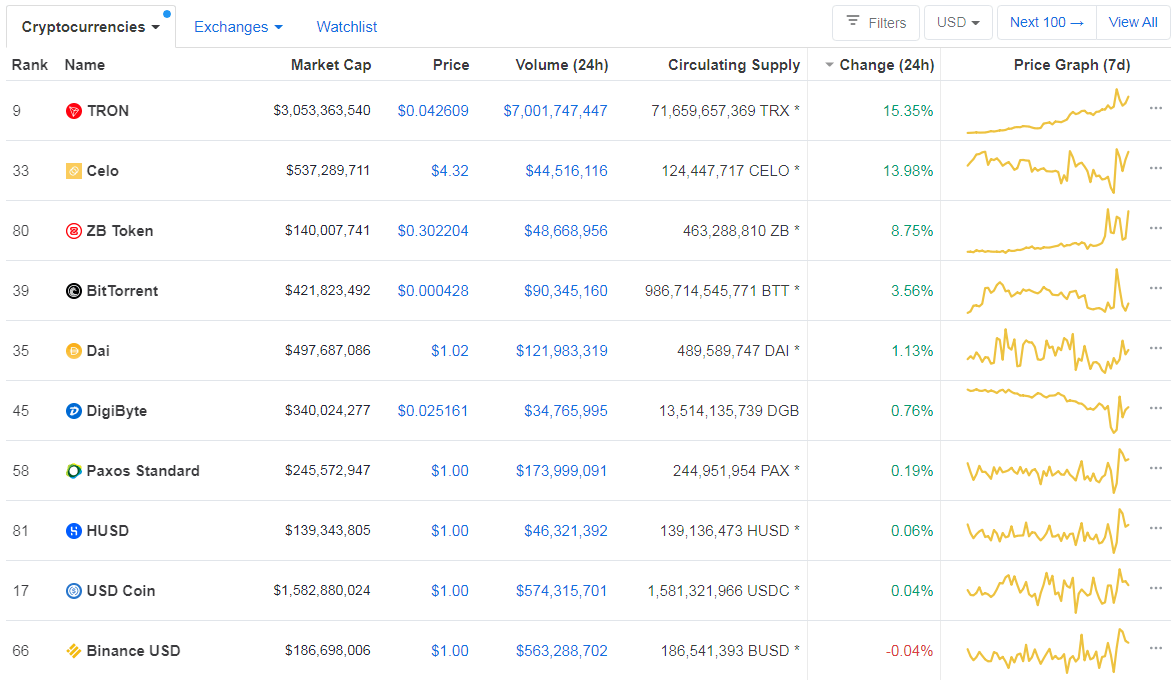
Top 10 24-hour Performers (Click to enlarge)
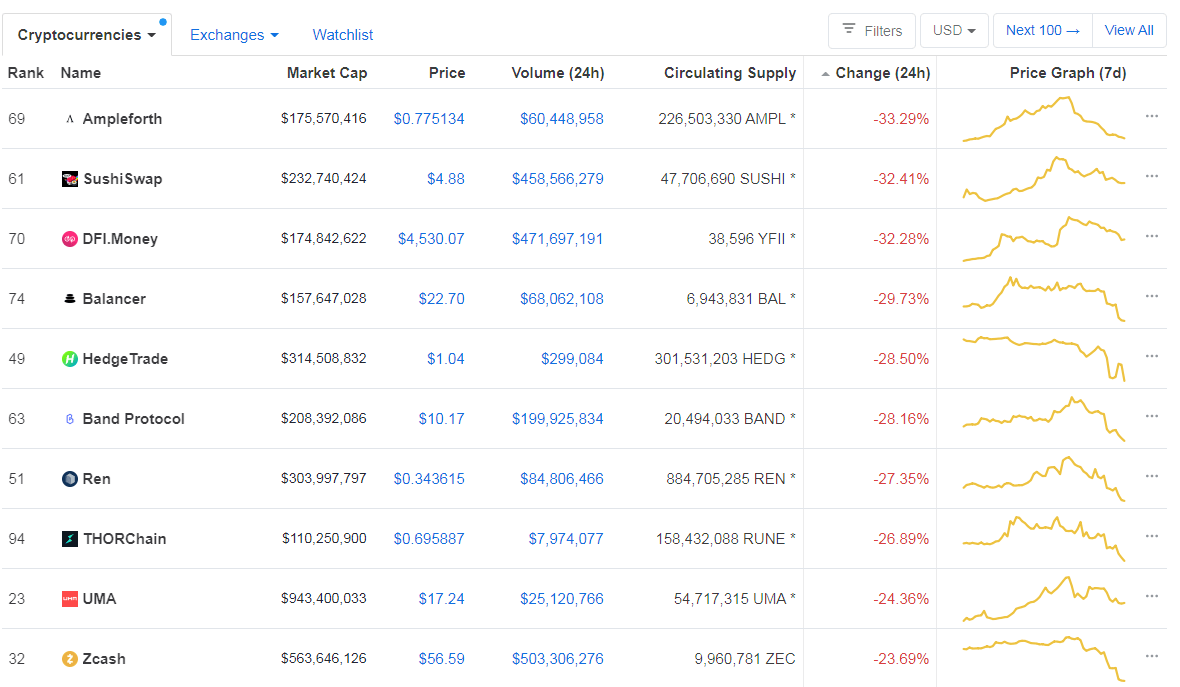
Bottom 10 24-hour Performers (Click to enlarge)
Bitcoin’s dominance level has gone up slightly, with its value is currently at 59.29%, represents a 0.67% difference to the upside when compared to when we last reported.
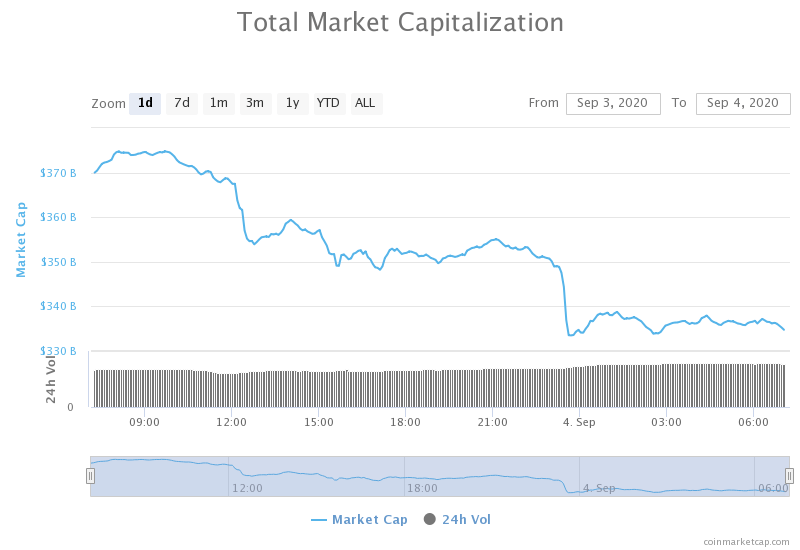
Daily Crypto Market Cap Chart
The crypto sector capitalization has plummeted in the past 24 hours. Its current value is $334.65 billion, which represents a decrease of $39.74 billion when compared to our previous report.
_______________________________________________________________________
What happened in the past 24 hours?
_______________________________________________________________________
- Bank of England governor floats future ecosystem of stablecoins and CBDCs (The Block)
- DEX volumes constituted 6% of centralized exchange volumes in August (The Block)
- Why are stablecoins starting to take off in Argentina (The Block)
- Fifth Largest Bitcoin Exchange Bithumb Raided by South Korean Police (Cryptobriefing)
- WTF DeFi: Ethereum’s SushiSwap forked into “Kimchi,” “YUNO,” and other absurd projects (Cryptoslate)
- Charles Hoskinson reveals what’s in line for Cardano in September (Cryptoslate)
- Buterin, Ethereum Developers Focus on Congestion as Fees Spike Over 600% in 1 Month (Coindesk)
- Stablecoin market cap increases by $100M every single day (Cointelegraph)
- BTC dips below $10K as traders eye ‘CME gap’ (Cointelegraph)
- Brazil could have CBDC in two years, says central bank president (Cointelegraph)
_______________________________________________________________________
Technical analysis
_______________________________________________________________________
Bitcoin
After failing to break the $12,000 mark, Bitcoin bears have taken over the market and the price plummeted, reaching as low as $10,000. While it was true that many people were bullish and called for a bull market, Bitcoin’s continuous failed attempts to break $12,000 took its toll and started a short-term bear trend that could reach $9,600 at some point.
There are many reasons that caused Bitcoin (and the rest of the crypto market) to plummet, mainly the US traditional market, DeFi, miners as well as traders.
- The US S&P 500 index pulled back on Thursday after reaching record highs just earlier this week. This happened because of a US report showing jobless claims of over 881,000 in August. While this number was, in fact, better than expected, it is still much larger than the one that the US saw during the 2009 recession high-point (665,000). Bitcoin is not completely uncorrelated from the traditional markets and has most likely reacted slightly to this news.
- While the DeFi craze is continuing, many believe that the fact that people are locking billions of dollars worth of Bitcoin may cause any form of market manipulation or influx of buyers/sellers much more significant due to reduced supply in circulation. It is also not implausible that DeFi is in a bubble (even some DeFi project leaders/creators such as Yearn Finance’s Andre Cronje say it), and that this is a form of a bubble “pop”.
- Miners and traders gathered up to sell Bitcoin at the $12,000 mark, which triggered this crash. Miners tried to secure their profits and play it safe, and traders most likely did the same, as they saw strong resistance sitting at the $12,000 level. All of the big mining pools saw large BTC outflows from the wallets, incidacting a market play with the intention to take profits and secure gains.
Traders should pay attention to Bitcoin’s price movement around $10,090 and $10,400.
BTC/USD 4-hour Chart
Technical factors:
- Price is well below its 50-period and 21-period EMA
- Price is just above its lower band
- RSI is deep in the oversold territory (21.56)
- Volume is elevated
Key levels to the upside Key levels to the downside
1: $10,360 1: $10,015
2: $10,500 2: $9,870
3: $10,850 3: $9,600
Ethereum
Ethereum had a similar day to Bitcoin, with its price plummeting and reaching as low as $371. The second-largest cryptocurrency by market cap tried to break the downward pressure after dropping below $445. It quickly bounced off of $415 and pushed towards the upside. However, the $445 level was now resistance, and after a failed attempt to break it, ETH moved further down.
Ethereum is now in its consolidation/recovery stage near $380.
Traders should pay attention to any influx in volume as well as how ETH handles $415.
ETH/USD 4-hour Chart
Technical Factors:
- The price is well below its 21-period and 50-period EMA
- The price is just above the lower band
- RSI is in the oversold territory (28.35)
- Volume is descending (from extremely high)
Key levels to the upside Key levels to the downside
1: $400 1: $371
2: $415 2: $360
3: $445
Ripple
XRP was no exception when it comes to today’s price movement. The third-largest cryptocurrency by market cap plummeted and reached as low as $0.238 before starting to recover. The price is now recovering at the $0.2454 support level, which is (at the moment) contested. It is still unsure of whether XRP will end up above or below it, so traders should watch out to a breakout to any side.
XRP/USD 4-hour Chart
Technical factors:
- The price is far below its 21-period and 50-period EMA
- Price is at its lower band
- RSI is in the oversold area (29.09)
- Volume is above average
Key levels to the upside Key levels to the downside
1: $0.266 1: $0.2454
2: $0.285 2: $0.235
3: $0.31 3: $0.227
Related posts
 Daily Crypto Review, Sept 11 – DeFi Sector Experiences Volatility; The Rest Of The Market Stable
 Daily Crypto Review, Sept 23 – Gold Pushing BTC Towards $9,500; XRP Bears Taking Over
 Daily Crypto Review, Sept 28 – XRP Exiting Bearish Structure and Aiming for $0.245; Bitcoin Eyeing $11,000
 Daily Crypto Review, Sept 30 – Goldman Sachs Entering the Crypto Sector; Bitcoin Prepares for a Move
One reply on “Daily Crypto Review, Sept 4 – Bitcoin at $10,000: What Happened? Detailed Price Level Analysis”
great analysis thank you