The cryptocurrency sector has spent the day trying to reach past its recent highs as Bitcoin pushed past $16,500. The largest cryptocurrency by market cap is currently trading for $16,718, representing an increase of 2.97% on the day. Meanwhile, Ethereum gained 2.34% on the day, while XRP gained an astonishing 10.46%.

Daily Crypto Sector Heat Map
Curve DAO Token gained 14.27% in the past 24 hours, making it the most prominent daily gainer out of the top100 cryptos ranked by market capitalization yet again today. It is closely followed by yearn.finance’s gain of 12.92% and Litecoin’s 10.99% gain. On the other hand, THORChain lost 7.28%, making it the most prominent daily loser. The Midas Touch Gold lost 6.16% while Uniswap lost 4.22%, making them the 2nd and 3rd most prominent daily losers.
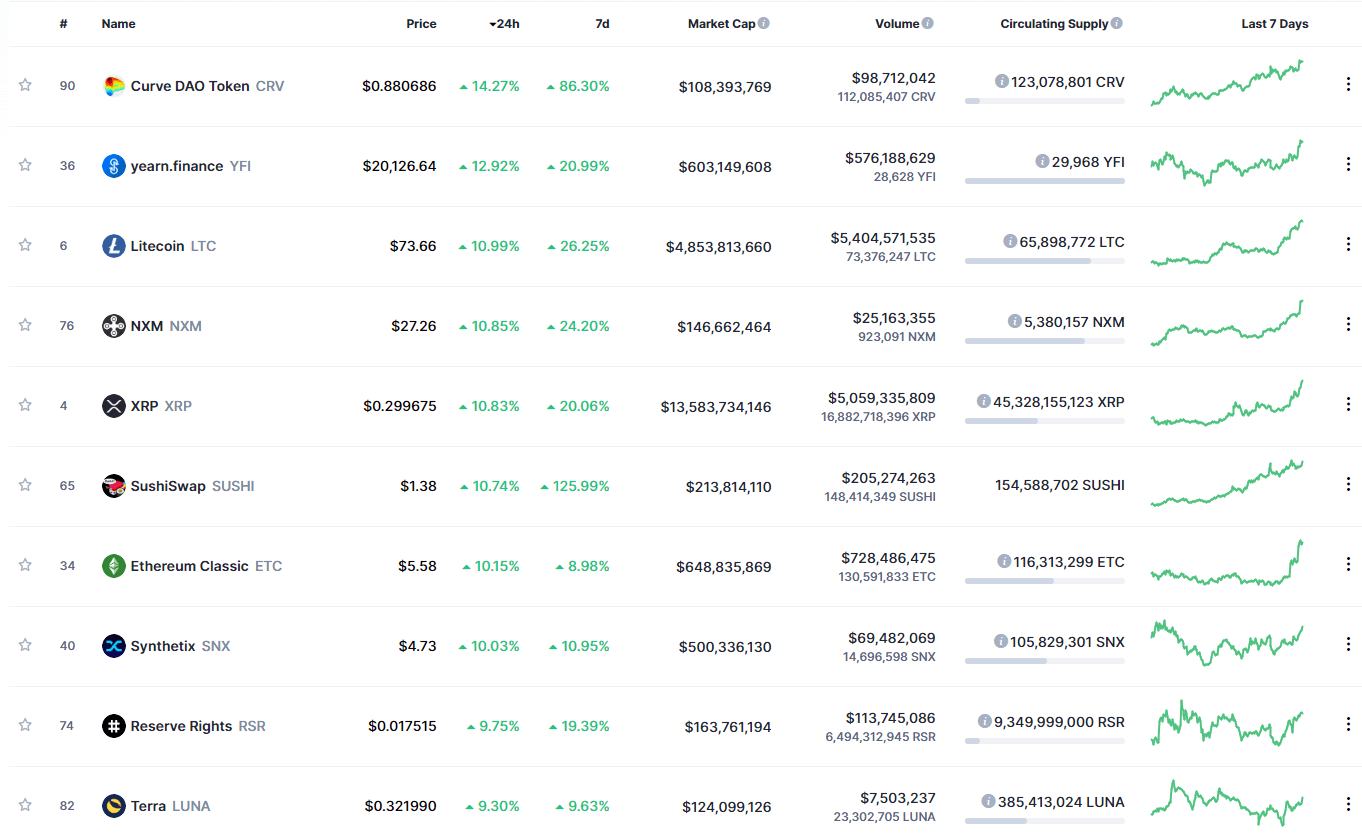
Top 10 24-hour Performers (Click to enlarge)
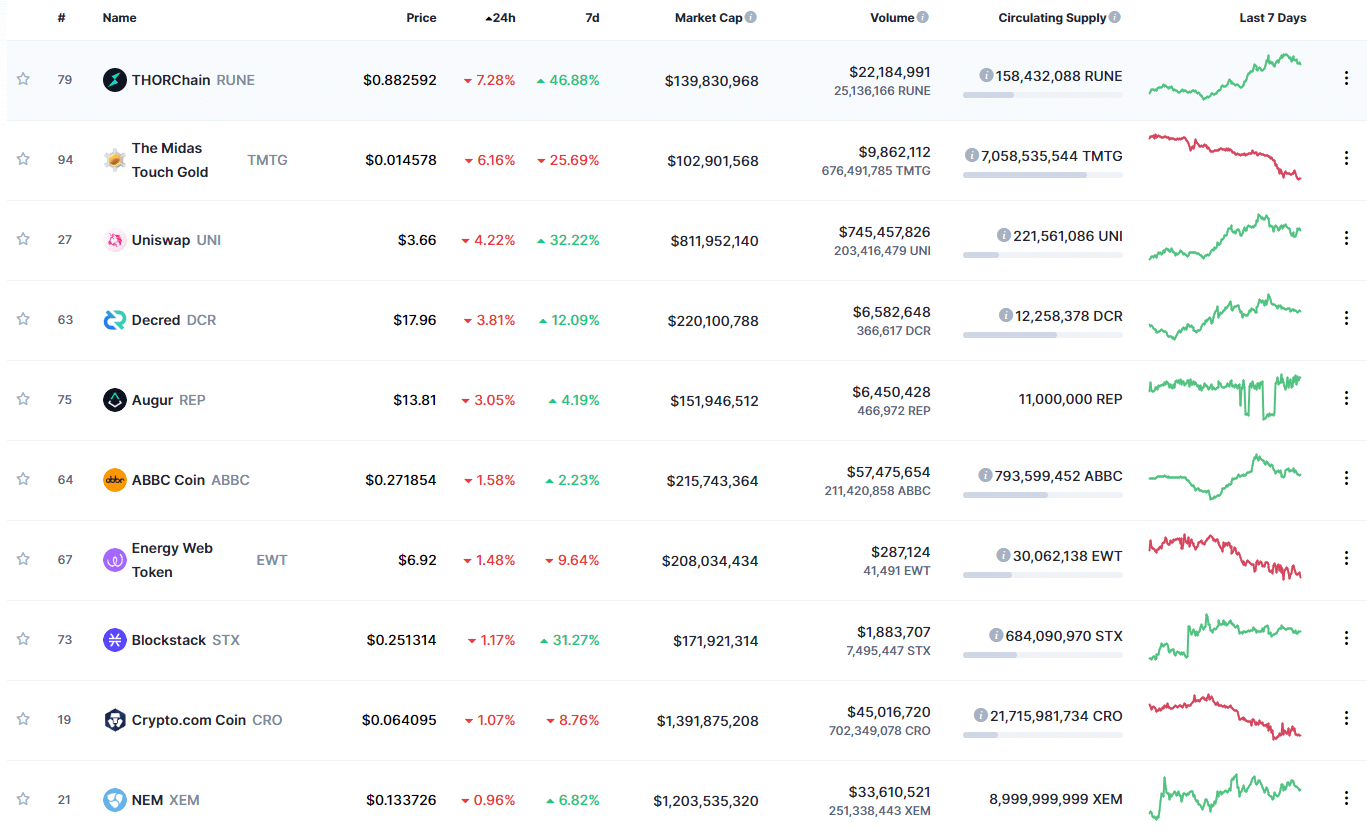
Bottom 10 24-hour Performers (Click to enlarge)
Bitcoin’s market dominance has decreased slightly over the course of the day, with its value is currently staying at 64.9%. This value represents a 0.1% difference to the downside compared to the value it had yesterday.
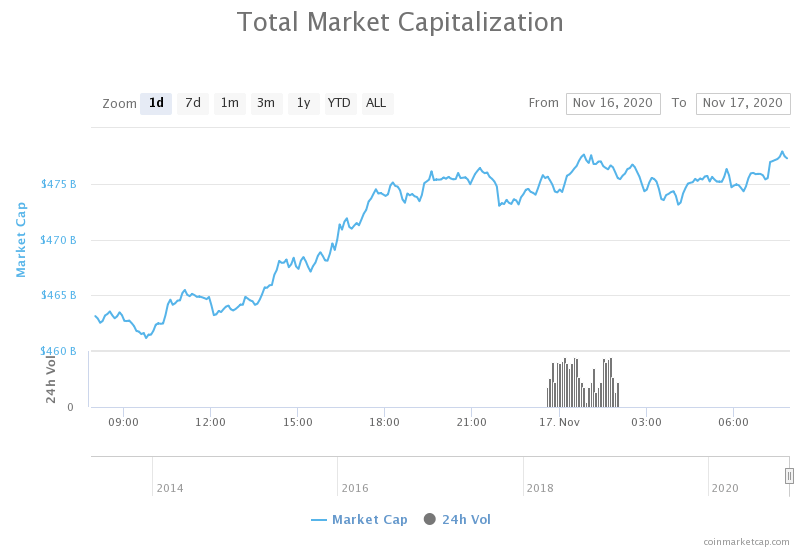
Daily Crypto Market Cap Chart
The crypto sector capitalization has gone up very slightly over the course of the day. Its current value is $477.28 billion, representing a $13.89 billion increase compared to our previous report.
_______________________________________________________________________
What happened in the past 24 hours?
_______________________________________________________________________
- SEC chairman Jay Clayton is stepping down, months ahead of his scheduled departure (The Bloick)
- Grayscale now holds half a million Bitcoin (Cointelegraph)
- Why this Wall Street fund quietly signaled its intention to invest in Bitcoin (Cryptoslate)
- Intercom co-founder jumps onto the “Bitcoin wagon,” encourages others (Cryptoslate)
- Why a Citibank analyst is calling a $318k target for Bitcoin (Cryptoslate)
- Crypto Community Rejoices as SEC Chairman Steps Down (Cryptobriefing)
- Bitcoin Eyes New Yearly Highs, Buy Pressure Skyrockets (Cryptobriefing)
- Ethereum Bulls Facing Stiff Resistance Despite ETH 2.0 Fervor (Cryptobriefing)
- Decentralized exchange Uniswap’s liquidity mining rewards program ends (The Block)
- Origin Protocol Loses $7M in Latest DeFi Attack (Coindesk)
- Yield-generating stablecoin project Origin Dollar exploited for $7M (Cointelegraph)
_______________________________________________________________________
Technical analysis
_______________________________________________________________________
Bitcoin

After confirming its stance above $16,000 after fighting for it over the weekend, the largest cryptocurrency by market capitalization pushed towards $16,500 and attempted to reach new highs. The push was strong as there was no real sell pressure, so Bitcoin reached past $16,500 (and eventually past $16,700) without any real increase in volume. While the $16,500 position has been successfully tested once, the $16,700 level is still not completely won.
Trading Bitcoin on a bull trend such as this one should only happen in one direction: WITH the trend. Shorting Bitcoin and trying to catch pullbacks will be less lucrative due to the size of the move, as well as riskier due to the market sentiment.
BTC/USD 4-hour Chart
Bitcoin’s technicals are tilted towards the buy-side on all four time-frames (4-hour, daily, weekly, and monthly). However, all of them have some form of neutrality, implying that the bullish sentiment is not absolute.
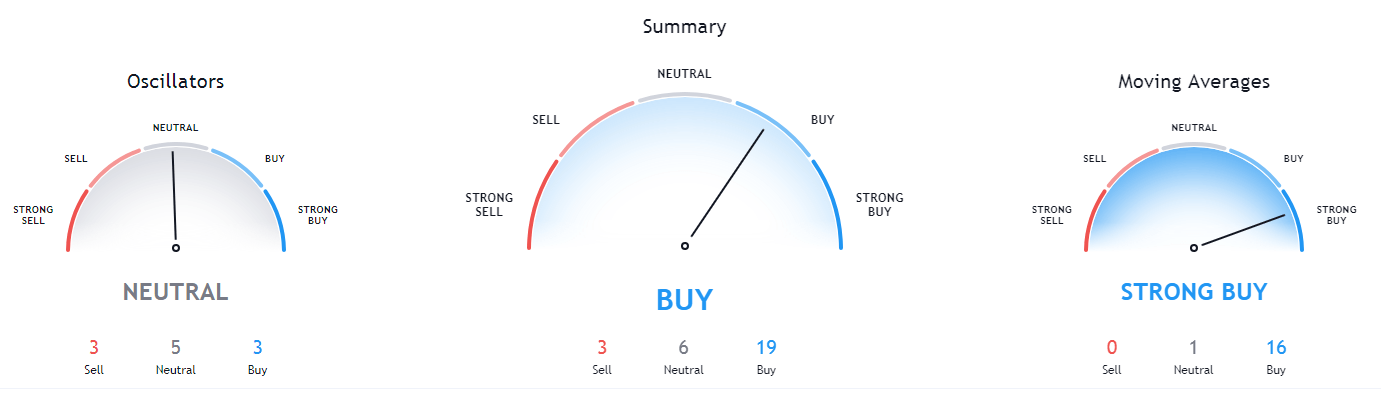
BTC/USD 1-day Technicals
Technical factors (4-hour Chart):
- Price is far above its 50-period EMA and its 21-period EMA
- Price is near its top Bollinger band
- RSI is approaching the overbought territory (65.02)
- Volume is average
Key levels to the upside Key levels to the downside
1: $17,000 1: $16,700
2: $18000 2: $16,500
3: $18500 3: $16,000
Ethereum

Ethereum has spent the past two days slowly moving towards the top line of the ascending channel after pulling back to $440. The move was gradual but saw some resistance when it reached the top line. However, Ethereum bulls endured and ultimately broke the level but got instantly stuck at the $470 resistance, which is another wall they have to jump over to remain above this channel.
If Ethereum’s struggles to break the $470 level continue, we may expect a pullback of some sort. With that being said, due to the overall sentiment towards Ethereum (and its 2.0 implementation) as well as the state of the crypto sector, shorting Ethereum should not be a proper trading strategy, even if ETH does pull back.
ETH/USD 4-hour Chart
Ethereum’s 1-day technicals are slightly bullish but are showing signs of neutrality. On the other hand, its 4-hour, weekly, and monthly overviews are completely tilted towards the buy-side.
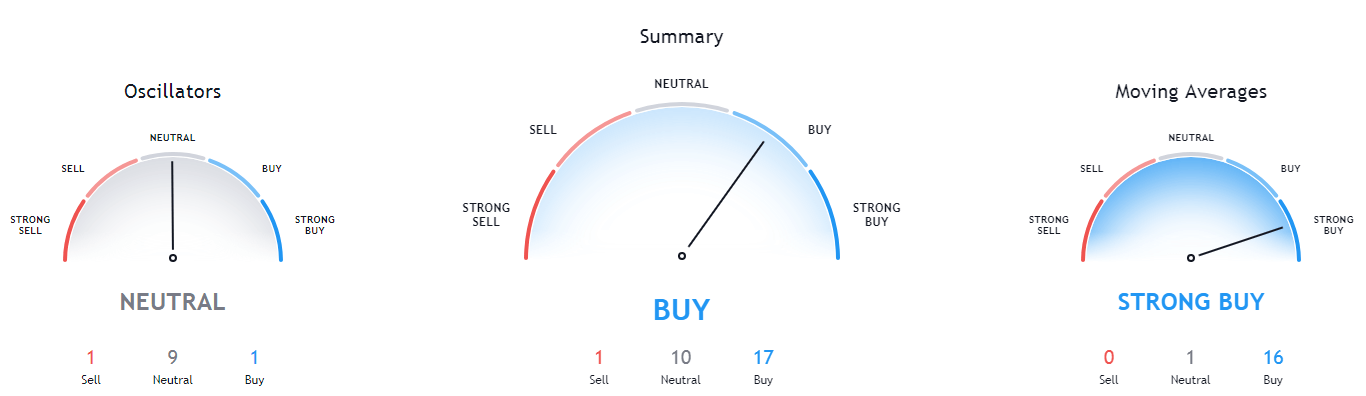
ETH/USD 1-day Technicals
Technical Factors (4-hour Chart):
- The price is above both its 50-period and its 21-period EMA
- Price is slightly above its middle Bollinger band
- RSI is neutral (57.54)
- Volume is average
Key levels to the upside Key levels to the downside
1: $470 1: $451
2: $490 2: $445
3: $500 3: $420
Ripple
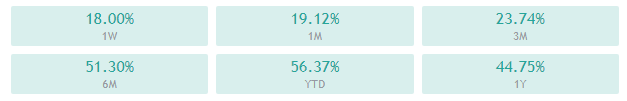
The fourth-largest cryptocurrency by market cap had yet another incredible day, with its price pushing past the $0.27 and even $0.2855 resistance levels. An incredible bull wave brought XRP’s price to $0.3 before it started to pull back slightly. This move has pushed XRP further up towards being the best-performing asset over a 1-week period compared to BTC and ETH, with gains of 18% this week, compared to BTC’s gains of 2.95 and ETH’s gains of 0.76.
Traders can finally look at XRP as a cryptocurrency that isn’t just used for sideways trading, and look for opportunities near new highs.
XRP/USD 4-hour Chart
XRP’s 4-hour, daily, and monthly technicals are slightly tilted towards the buy-side, and all of them are showing more or less signs of neutrality. The weekly overview is, on the other hand, completely bullish.
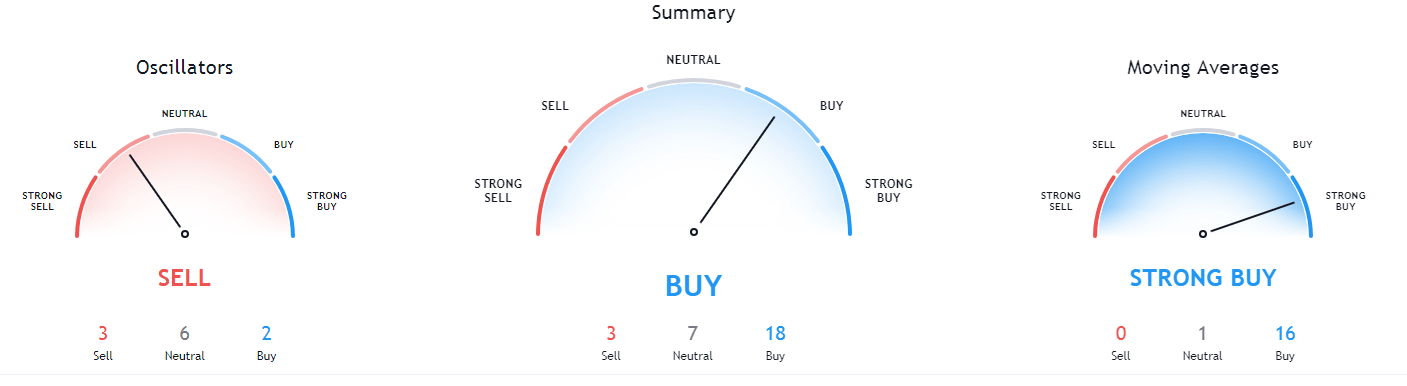
XRP/USD 1-day Technicals
Technical factors (4-hour Chart):
- The price is above its 50-period EMA and its 21-period EMA
- Price is at its top Bollinger band
- RSI is heavily overbought (76.99)
- Volume is above average
Key levels to the upside Key levels to the downside
1: $0.31 1: $0.2855
2: $0.3244 2: $0.27
3: $0.3328 3: $0.266
Related posts
 Daily Crypto Review, Mar 18 – Bitcoin will save the world from crisis, Tim Draper announces
 Daily Crypto Review, Apr 8 – BCH and BSV halving countdown; Cryptos consolidating after a move up
 Daily Crypto Review, Apr 15 – Libra vs Bitcoin again? Cryptos preparing for a move
 Daily Crypto Review, Nov 11 – Mempool Cleared! Bitcoin Fees Plummet