
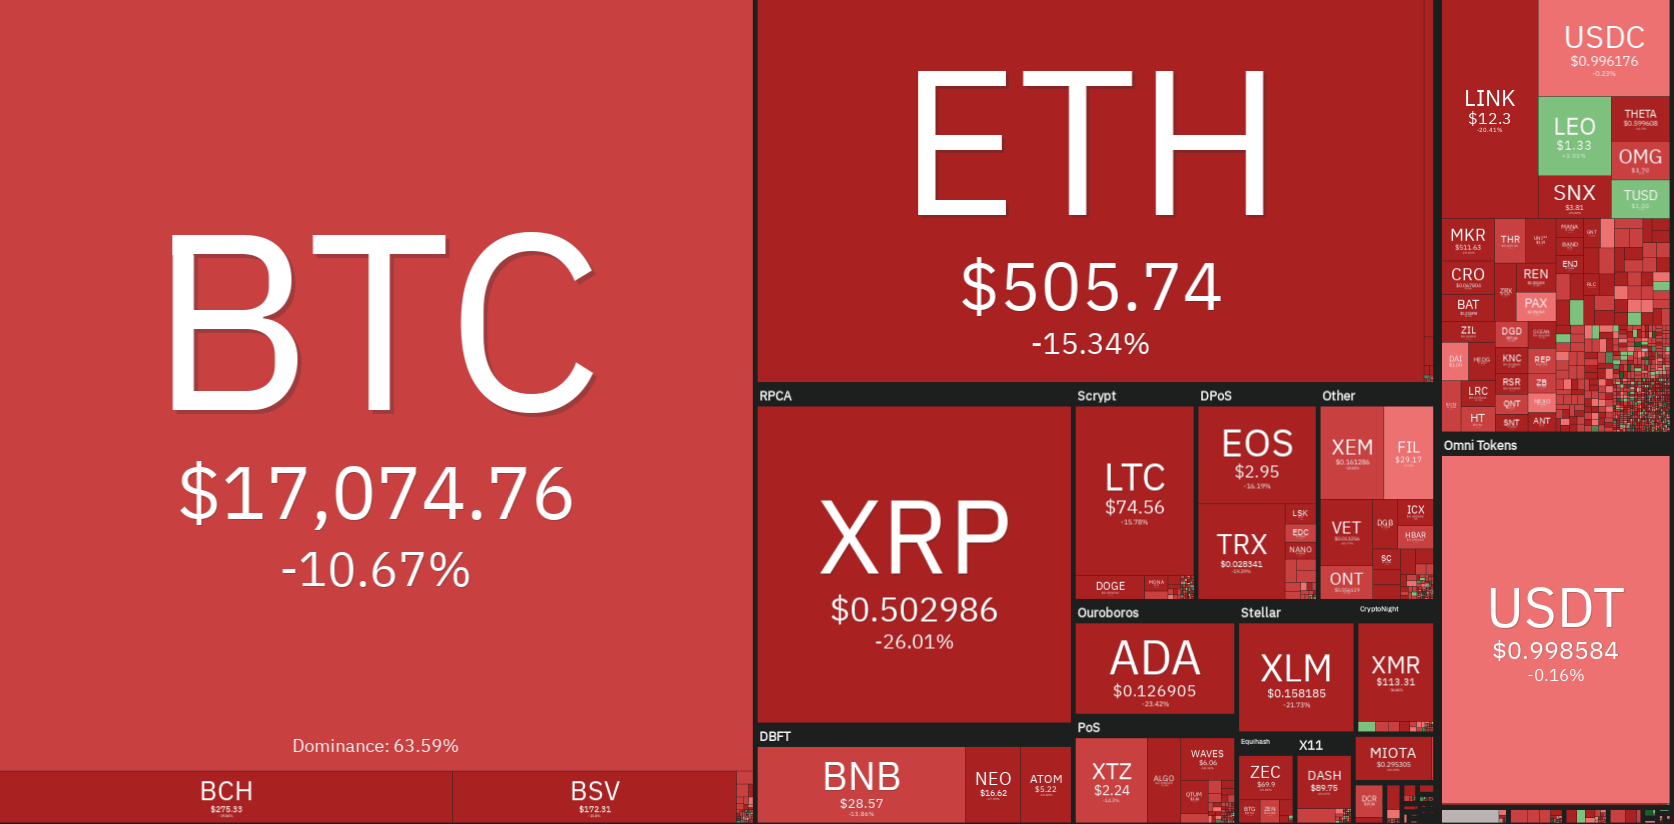
The cryptocurrency sector has ended the day in the red as Bitcoin failed to stay above $19,000 and even falling below $18,000 as bears took control of the market. The largest cryptocurrency by market cap is currently trading for $17,000, representing a decrease of 10.67%% on the day. Meanwhile, Ethereum is losing 15.34% on the day, while XRP lost 16.88%.

Daily Crypto Sector Heat Map
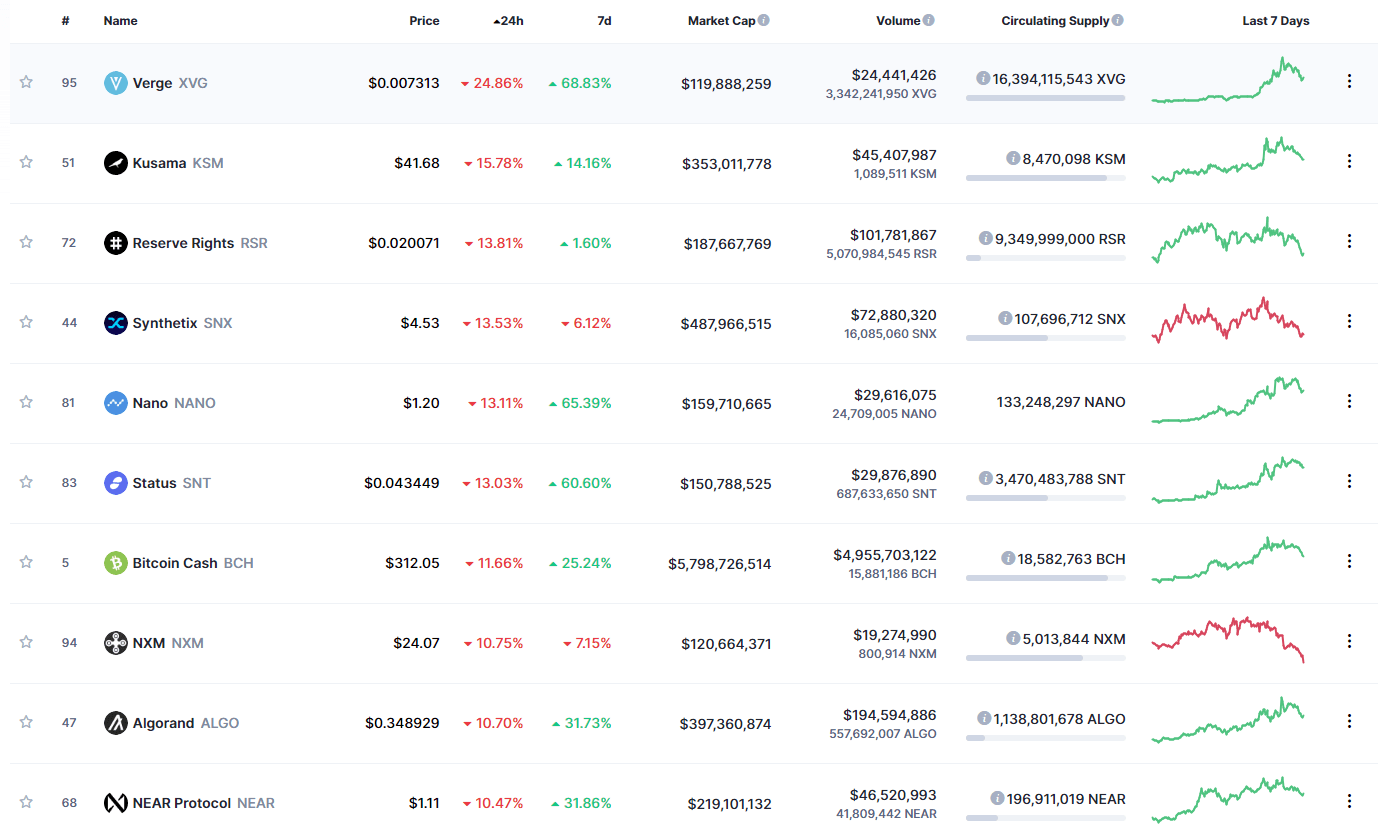
Zilliqa 23.75% in the past 24 hours, making it the most prominent daily gainer in the top100. It is closely followed by Horizen’s gain of 18.71% and Elrond’s 11.54% gain. On the other hand, Verge lost 24.86%, making it the most prominent daily loser. Kusama lost 15.78% while Reserve Rights lost 13.81%, making them the 2nd and 3rd most prominent daily losers.

Top 10 24-hour Performers (Click to enlarge)
Bottom 10 24-hour Performers (Click to enlarge)
Bitcoin’s market dominance has increased over the day, with its value currently staying at 62.2%. This value represents a 0.6% difference to the upside compared to the value it had yesterday.
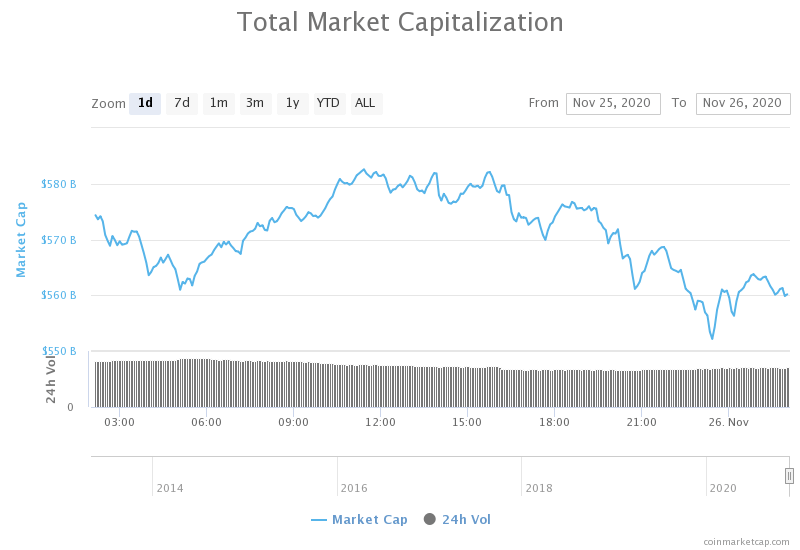
Daily Crypto Market Cap Chart
The crypto sector capitalization has decreased over the course of the day. Its current value is $560.17 billion, representing an $11.36 billion decrease compared to our previous report.
_______________________________________________________________________
What happened in the past 24 hours?
_______________________________________________________________________
- Binance’s trading volume reaches $132 billion for November, a new monthly high (The Block)
- Google search interest in Ethereum hits highest point since February 2018 (The Block)
- Grayscale’s Bitcoin Cash and Litecoin products are trading at premiums of more than 1,000% (The Block)
- VanEck Europe Launches ETF-Like Bitcoin Product (Cryptobriefing)
- Stellar Lumens’ 170% Bull Rally May Have Just Run Out of Steam (Cryptobriefing)
- eBay Shoppers Can Now Earn Free Bitcoin This Christmas (Cryptobriefing)
- Bitcoin Headlines Sour as Leading Cryptocurrency Corrects (Cryptobriefing)
- What makes the crypto market’s rise to $500 billion different from 2017? (Cryptoslate)
- Bitcoin has been massively outperforming gold in November—but why? (Cryptoslate)
- PayPal suspends user for crypto trading using PayPal’s own service (Cointelegraph)
_______________________________________________________________________
Technical analysis
_______________________________________________________________________
Bitcoin
The largest cryptocurrency by market cap has created a double top, which triggered a pullback from the recent highs. Not only has the price retraced to the sub-$19,000 level, but it has also broken the $18,500 support level. The price will most likely end up below the $17,850 level, as the market is calling for a pullback for quite some time. However, if the market recovers, we can expect the price to end up between $17,850 and $18,500.
While shorting Bitcoin might be a good profit-making opportunity at the moment, trading against the long-term trend is extremely risky. However, thinking about hedging versus any downturns might be a good option at the moment.
BTC/USD 1-hour Chart
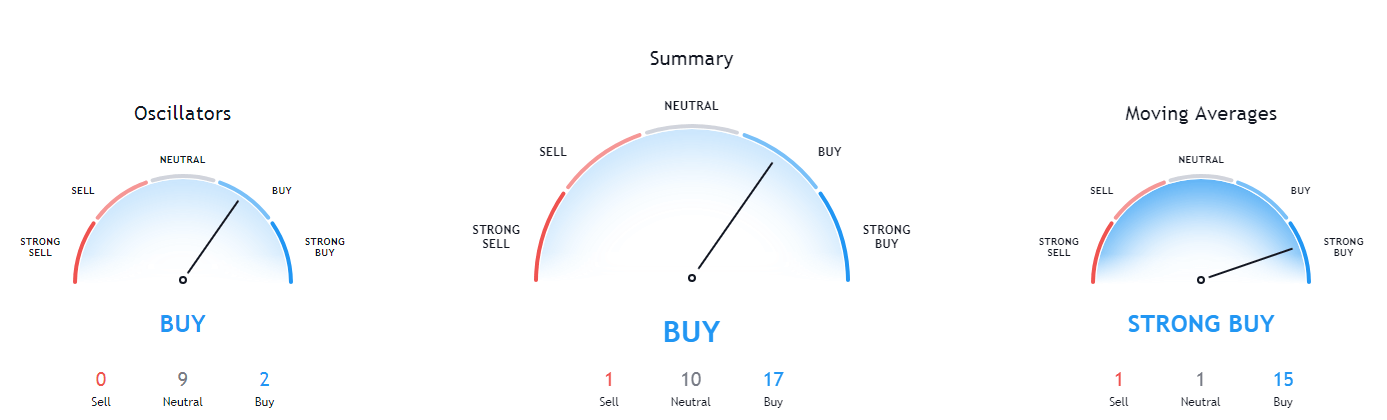
Bitcoin’s 4-hour, daily, and weekly technicals are heavily tilted towards the buy-side and show no signs of neutrality or bearishness. On the other hand, its monthly technicals are showing some signs of neutrality.
BTC/USD 1-day Technicals
Technical factors (1-hour Chart):
- Price is far below its 50-period EMA and its 21-period EMA
- Price slightly below its lower Bollinger band
- RSI is extremely oversold (23.98)
- Volume is average (one candle spike)
Key levels to the upside Key levels to the downside
1: $18500 1: $17,850
2: $19000 2: $17,450
3: $19500 3: $17,000
Ethereum

While Ethereum did follow Bitcoin to the downside, both in price direction and severity of the move, the situation doesn’t look that bad. The second-largest cryptocurrency by market cap has started its pullback after failing to stay above $600, culminating in a full-blown dump from $570 to $505. However, the ascending (red) line held up, and ETH reclaimed previous levels and is currently consolidating around $530.
Ethereum’s current outlook is very bullish, but any sharp move to the downside coming from Bitcoin will affect it in a major way. Traders should pay close attention to Bitcoin’s moves if they want to trade Ether.
ETH/USD 1-hour Chart
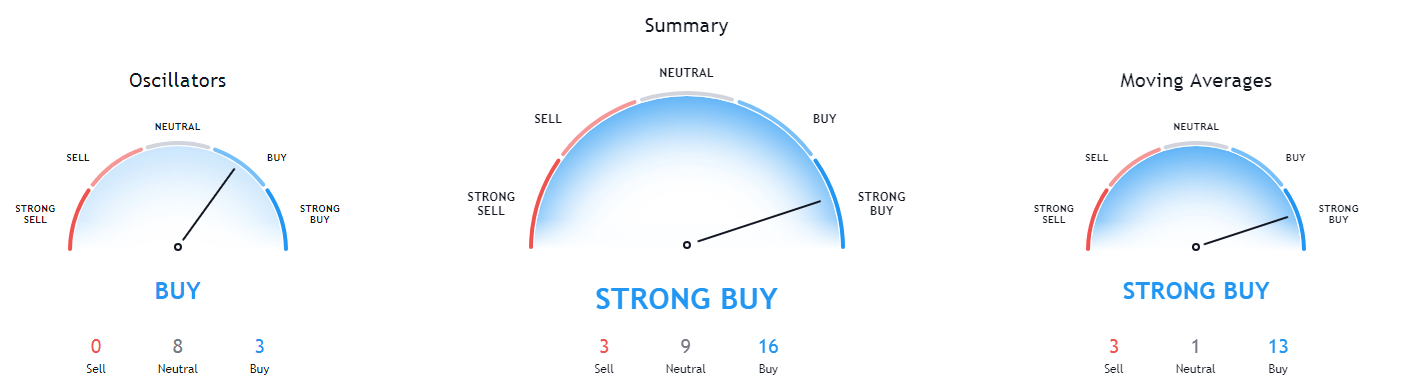
Ethereum’s technicals are a bit confusing, as its daily and monthly overviews are completely bullish, while its weekly overview shows slight signs of neutrality. Its 4-hour technicals, however, are pointing towards the sell-side.
ETH/USD 1-day Technicals
Technical Factors (4-hour Chart):
- The price is below both its 50-period and its 21-period EMA
- Price is below its bottom Bollinger band
- RSI is extremely oversold (19.47)
- Volume is above average
Key levels to the upside Key levels to the downside
1: $600 1: $510
2: $630 2: $500
3: $735 3: $490
Ripple

The fourth-largest cryptocurrency by market cap has performed similarly to the aforementioned two cryptocurrencies. XRP has posted lower highs three times in a row while testing the $0.625 support level each time. However, the last time XRP went towards this level, bears took over and pushed the price further down. XRP bears have seemingly reached exhaustion, and the cryptocurrency is now consolidating around the $0.575 level.
Trading XRP is not advised as trading Bitcoin is (at the moment) both potentially more profitable and more straightforward.
XRP/USD 1-hour Chart
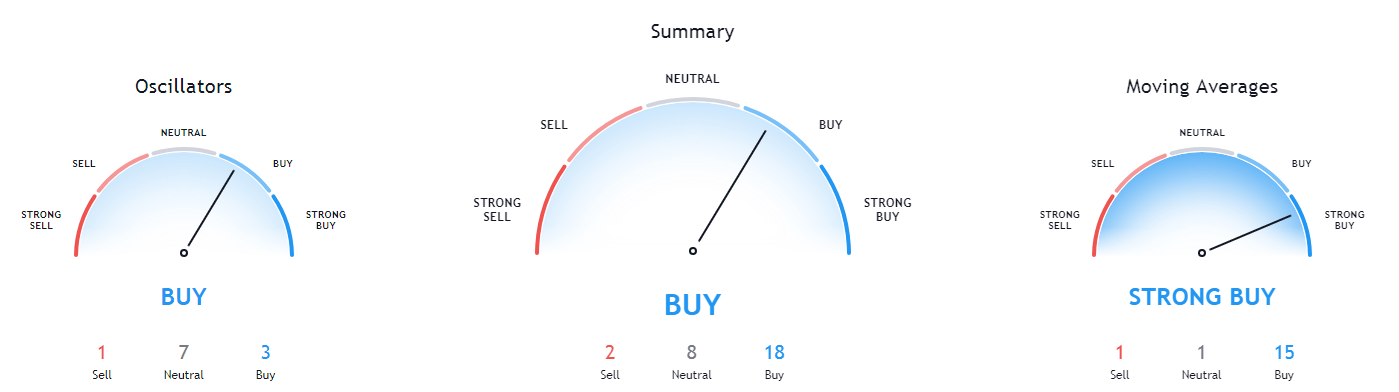
XRP’s technicals on all time-frames are tilted towards the buy-side, with its daily overview being the most bullish time-frame. Its other time-frames show signs of neutrality or even slight bearishness.
XRP/USD 1-day Technicals
Technical factors (4-hour Chart):
- The price is far below both its 50-period EMA and its 21-period EMA
- Price is slightly below its bottom Bollinger band
- RSI is close to being oversold (31.85)
- Volume is above average
Key levels to the upside Key levels to the downside
1: $0.625 1: $0.475
2: $0.79 2: $0.443
3: $0.963 3: $0.4
Related posts
 Daily Crypto Review, July 2 – Paypal Using Crypto? Bitcoin Preparing For a Move
 Daily Crypto Review, July 6 – Cryptos Skyrocket on Increased Volume; Bitcoin vs. the S&P 500
 Daily Crypto Review, Oct 22 – PayPal to Enable its Users to Buy and Sell Crypto; Bitcoin Skyrockets to $13,000 as a Response
 Daily Crypto Review, Oct 27 – Bitcoin Preparing For a Retracement; XRP Tumbles on the Daily