
The cryptocurrency market has spent the day attempting to break its immediate resistance levels. Bitcoin is currently trading for $9,202, which represents an increase of 0.56% on the day. Meanwhile, Ethereum gained 1.57% on the day, while XRP gained 0.66%.

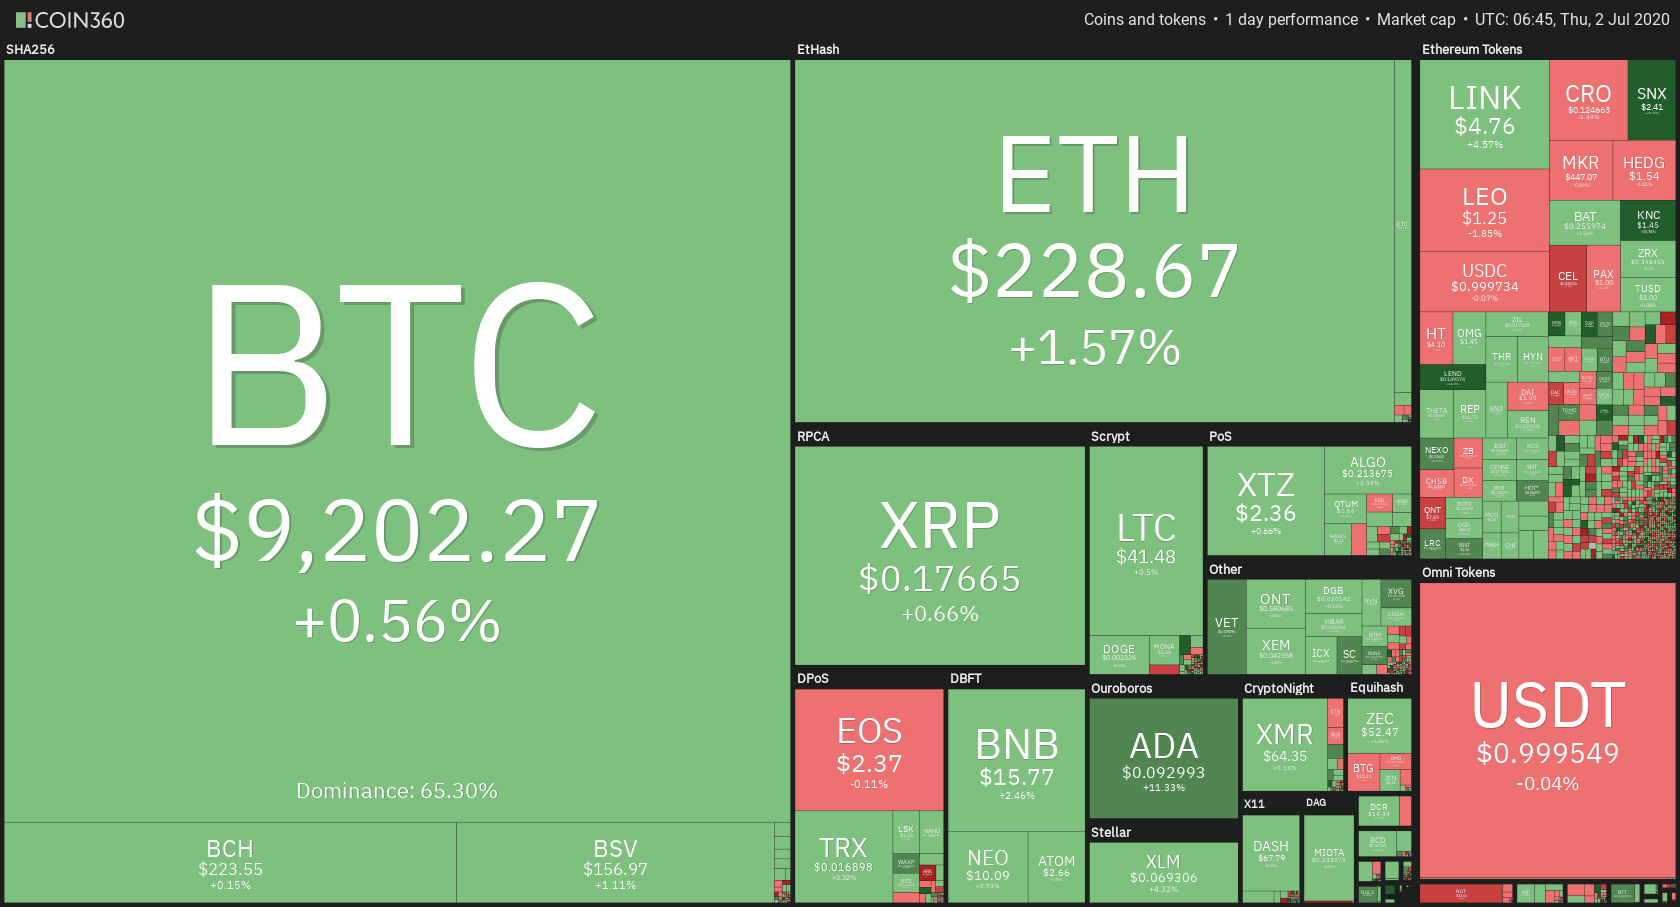
Daily Crypto Sector Heat Map
When talking about top100 cryptocurrencies, Synthetix Network gained 22.77% on the day, making it by far the most prominent daily gainer. Kyber Network (16.35%) and Aave (14.66%) also did great. On the other hand, Celsius has lost 9.71%, making it the most prominent daily loser. It is followed by Compound’s loss of 9.57% and SwissBorg’s loss of 4.86%.
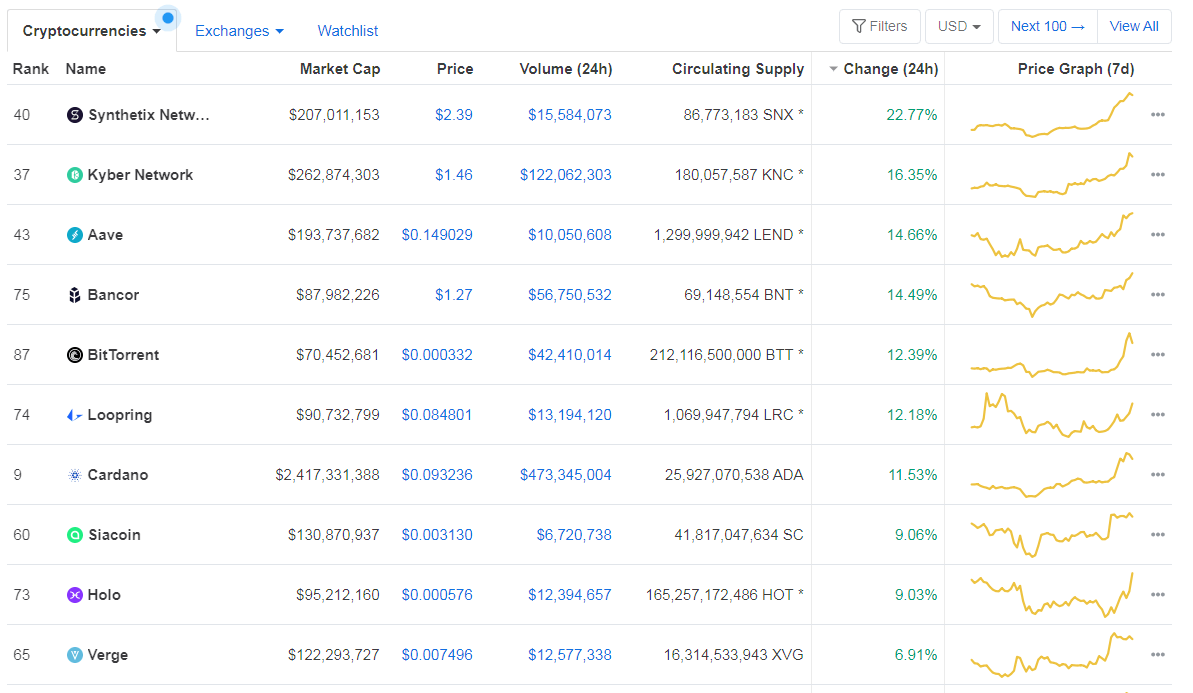
Top 10 24-hour Performers (Click to enlarge)
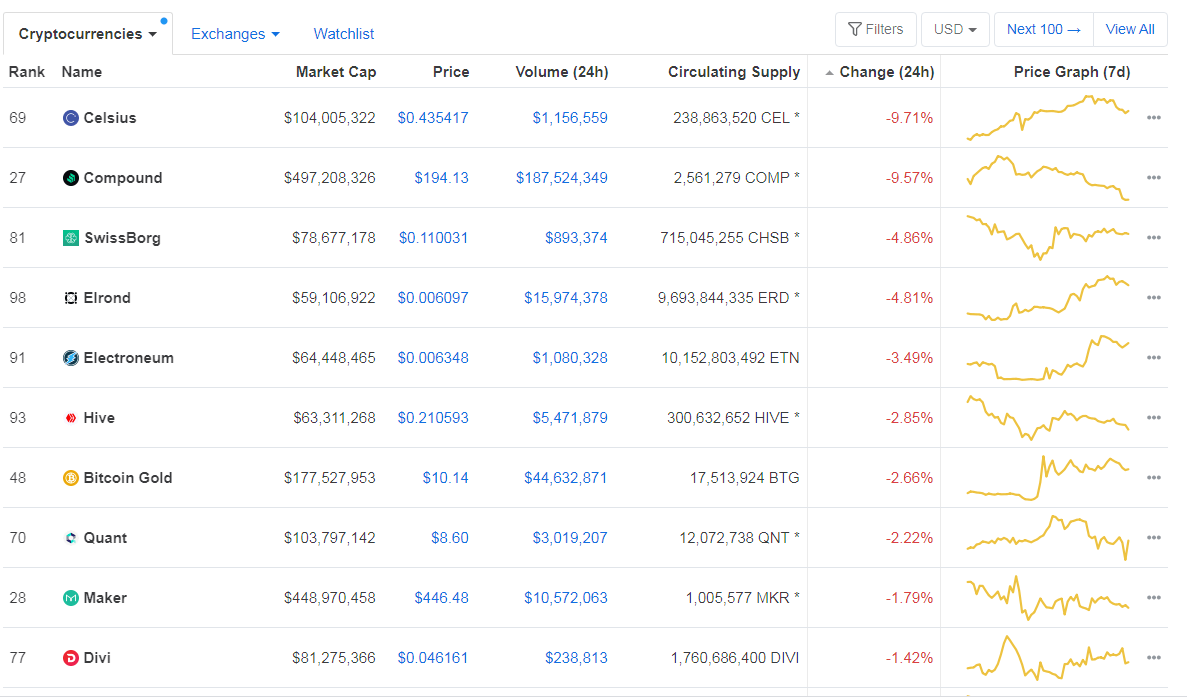
Bottom 10 24-hour Performers (Click to enlarge)
Bitcoin’s dominance level decreased slightly since we last reported, with its value currently at 65.30%. This value represents a 0.06% difference to the downside when compared to yesterday’s value.
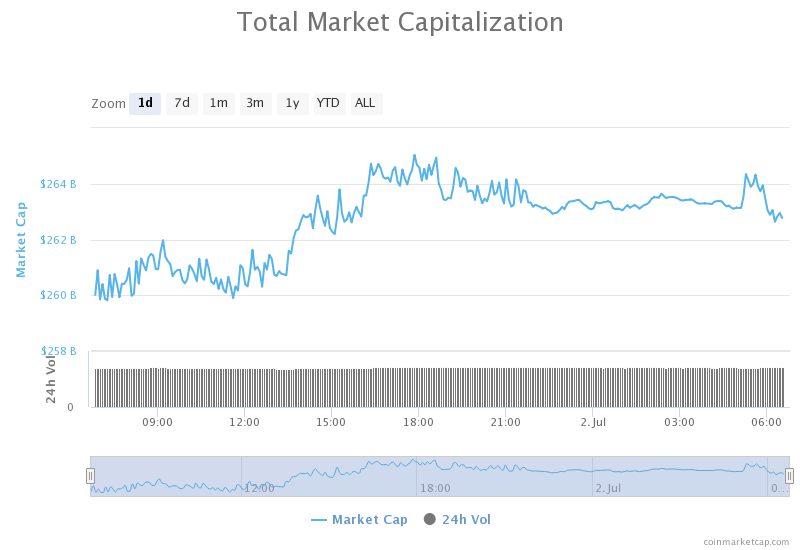
Daily Crypto Market Cap Chart
The cryptocurrency market capitalization increased slightly when compared to yesterday, with the market’s current value being $262.59 billion. This value represents an increase of $3.11 billion when compared to the value it had yesterday.
_______________________________________________________________________
What happened in the past 24 hours?
_______________________________________________________________________
- PayPal Dabbling in Crypto Could Make BTC a Mainstream Payment Option (Cointelegraph)
- Russia: Bitcoin Activity Rising Despite Strict Law Proposals (Cointelegraph)
- Report: Japanese Blockchain Sector Grows Over 30% Since 2019 (Cointelegraph)
- University of California pays out millions in Bitcoin after ransom attack (Cryptoslate)
- A newly-disclosed flaw found in several popular Bitcoin wallets could let attackers trick users into thinking they got paid (The Block)
- Bitcoin spot market volume fell by over 30% in June while DEXs picked up market share (The Block)
- Monthly volumes for DEXs soared past $1.5 billion to hit all-time high in June (The Block)
- Lawyers Will Accept Bitcoin for Legal Fees in Washington DC (Cryptobriefing)
- Bitcoin vs. Ethereum: Who Has the Better Monetary Policy (Cryptobriefing)
- Lebanese Pound Falls 50% in Ten Days — Now Worth One Satoshi (Cointelegraph)
_______________________________________________________________________
Technical analysis
_______________________________________________________________________
Bitcoin
The largest cryptocurrency by market capitalization has spent the past day trying to reach above its $9,251 resistance level. As the volume increased, Bitcoin managed to tackle this level, but only for a short period of time. The price didn’t manage to stay above $9,251, and Bitcoin moved below it yet again. It is now consolidating right below it.
Traders should be wary of trading Bitcoin just based on its momentum. They should rather watch for confirmations or pullbacks and trade those.
BTC/USD 4-hour Chart
Technical factors:
- Price is above its 50-period EMA and its 21-period EMA
- Price is above the Middle B.B. (20period SMA)
- RSI above the middle point (55.5)
- Increased Volume (Coming back to normal)
Key levels to the upside Key levels to the downside
1: $9,251 1: $9,120
2: $9,580 2: $8,980
3: $9,735 3: $8,820
Ethereum
Ethereum was also ready to move to the upside in the past 24 hours, which it did a bit more successfully than Bitcoin. The second-largest cryptocurrency by market capitalization gathered up buyers and tried to reach higher levels (though not necessarily to break any resistance levels like $240 is too far away. However, it got stopped in its tracks around the $233 mark, where the price hit the newly-formed trend upper line.
Ethereum traders should have an easy time trading within the boundaries of the newly-formed trend.
ETH/USD 4-hour Chart
Technical Factors:
- Price above the 50-period EMA and the 21-period EMA
- Price right above Middle B.B. (20-period SMA)
- RSI above the middle point (52.7)
- Increased volume
Key levels to the upside Key levels to the downside
1: $228 1: $225.4
2: $240 2: $217.7
3: $251.4 3: $198
Ripple
The third-largest cryptocurrency by market cap is continuing its path towards the downside by following the descending trend line. XRP doesn’t have enough volume to tackle the $0.178 level at the moment, so its moves are either to the downside or right to the resistance level.
There aren’t many XRP trading opportunities at the moment, but most of them are completely straightforward, as they are always accompanied by sharp increases in volume.
XRP/USD 4-hour Chart
Technical factors:
- XRP in a mid-term descending trend
- XRP lacks strong support levels below $0.178
- The upside is guarded by the 21 and 50-period EMA
- Price in a narrow range between the Middle B.B. (20 SMA) and Lower B.B.
- RSI is below the middle point (47)
- Average (extremely low) volume
Key levels to the upside Key levels to the downside
1: $0.178 1: $0.147
2: $0.19
3: $0.2
Related posts
 Daily Crypto Review, August 7 – Goldman Sachs Launching its Own Stablecoin; DeFi Platforms Traffic Surging
 Daily Crypto Review, Nov 5 – Bitcoin Finally Above $14,000 as the Bull Run Continues; Ethereum 2.0 Contract Release Live
 Daily Crypto Review, Dec 4 – Bitcoin Above $19,000; Ether Fighting for $600
 Daily Crypto Review, Dec 14 – BTC and ETH Consolidating After A Bull Rally; XRP Left in the Dust