
The cryptocurrency market has had a relatively slow weekend until 12 hours ago when the volatility skyrocketed, and cryptocurrencies started moving. Bitcoin is currently trading for $9,221, which represents an increase of 1.63% on the day. Meanwhile, Ethereum gained 2.6% on the day, while XRP gained 2.52%.
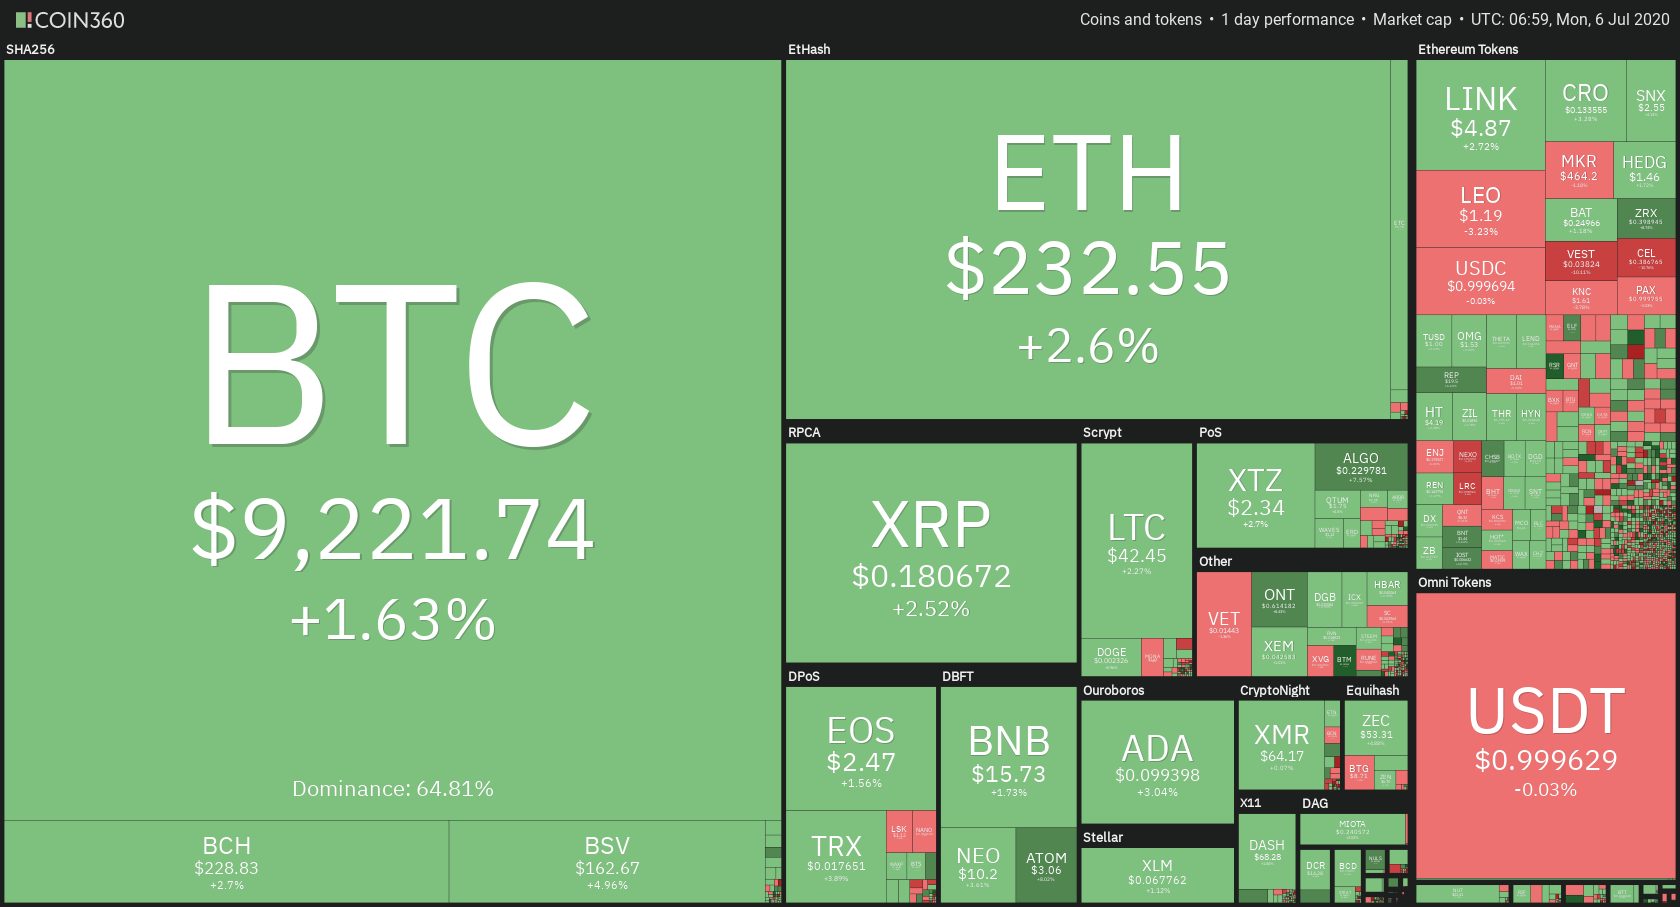
Daily Crypto Sector Heat Map
When talking about top100 cryptocurrencies, Bytom gained 18.16% on the day, making it by far the most prominent daily gainer. ABBC Coin (11.31%) and NULS (10.89%) also did great. On the other hand, Celsius has lost 10.85%, making it the most prominent daily loser. It is followed by Loopring’s loss of 8.98% and Blockstack’s loss of 5.40%.
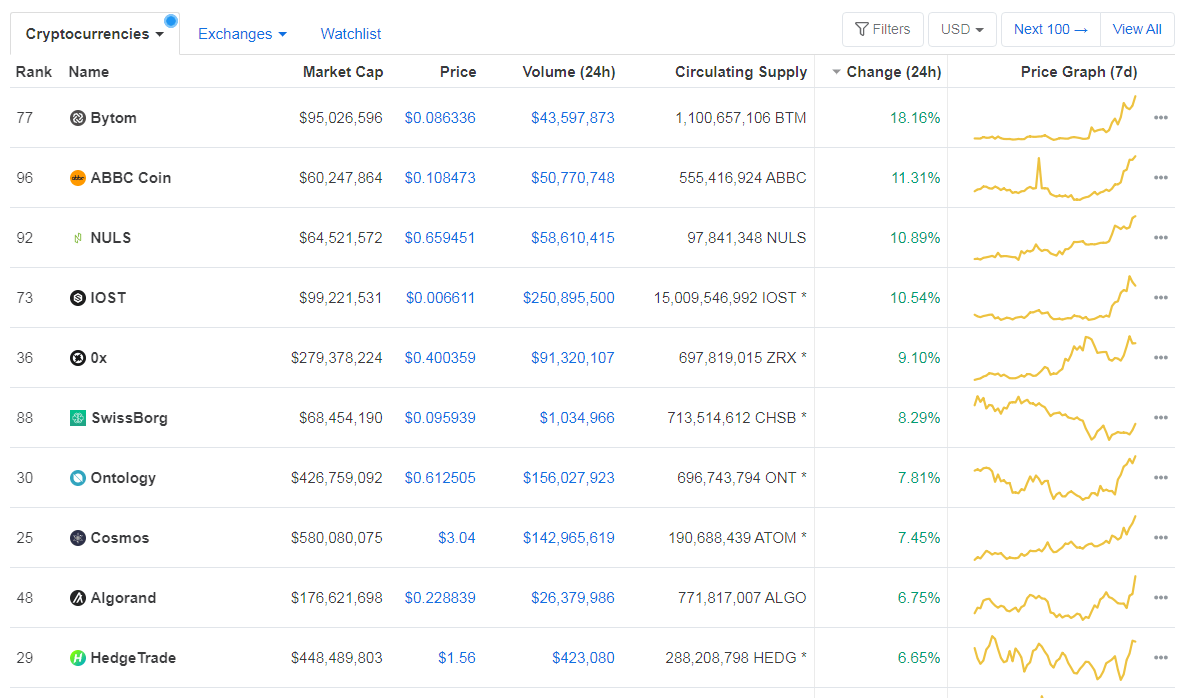
Top 10 24-hour Performers (Click to enlarge)
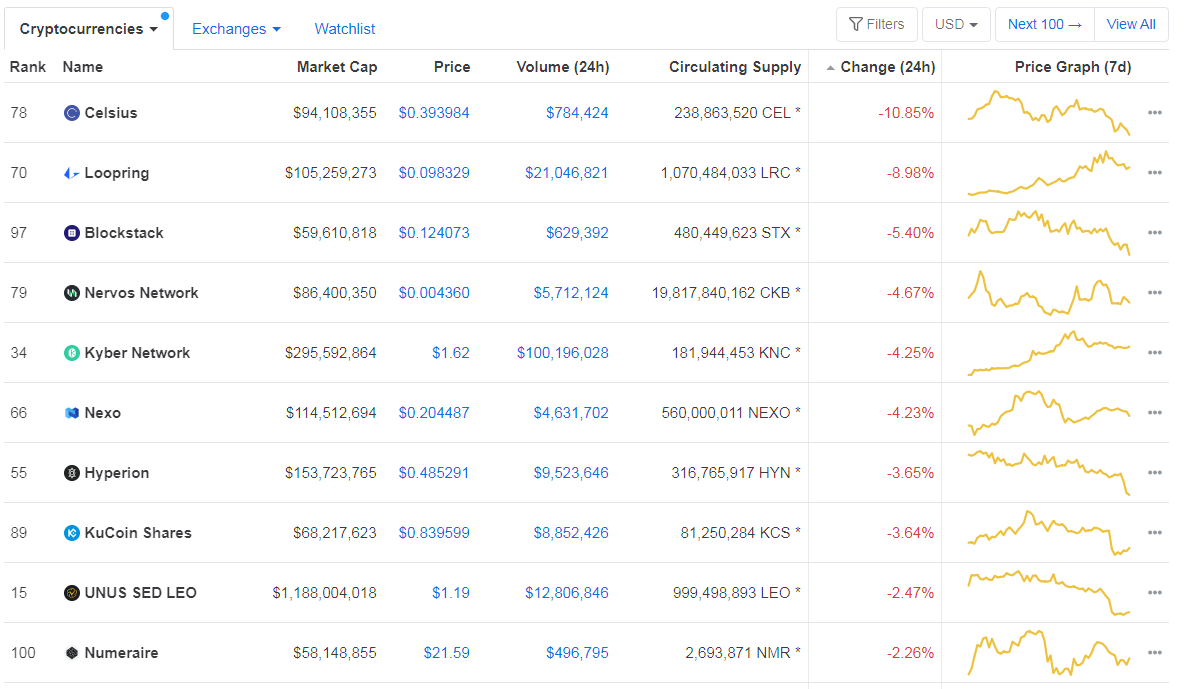
Bottom 10 24-hour Performers (Click to enlarge)
Bitcoin’s dominance level decreased since we last reported, with its value currently at 64.81%. This value represents a 0.32% difference to the downside when compared to Friday’s value.
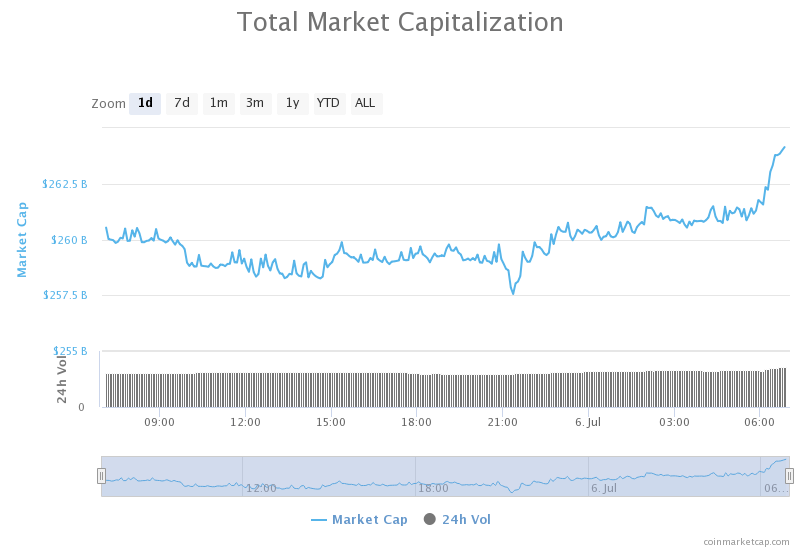
Daily Crypto Market Cap Chart
The cryptocurrency market capitalization increased slightly when compared to when we last reported, with the market’s current value being $264.31 billion. This value represents an increase of $3.72 billion when compared to the value it had on Friday.
_______________________________________________________________________
What happened in the past 24 hours?
_______________________________________________________________________
- Bakkt volume soars by 17% as institutional interest in crypto flourishes (Cryptoslate)
- There’s no end in sight to XRP’s downtrend as transaction volume wanes (Cryptoslate)
- Coronavirus pushes Bitcoin-friendly Japan to begin “Digital Yen” trials (Cryptoslate)
- Bitcoin’s Lightning Network Faces Existential Risk in “Flood and Loot” Attack (Cryptobriefing)
- Ripple Is Becoming a Dumping Ground for Bitcoin Spam Transactions (Cryptobriefing)
- Bitcoin’s Price Correlation With S&P 500 Hits Record Highs (Coindesk)
- Adjusted transaction volume for stablecoins hit new all-time high in June: data (The Block)
- More than $180 billion in bitcoin was transacted on-chain during 2020’s Q2 (The Block)
- Compound holds massive influence over 3 major tokens: Breaking down the “COMP effect” (Cryptoslate)
- CBDC is the Most Important Trend in Payments Says Visa Crypto Chief (Cointelegraph)
_______________________________________________________________________
Technical analysis
_______________________________________________________________________
Bitcoin
The largest cryptocurrency by market capitalization has spent the weekend without too much volatility, mostly trading within a range bound by $8,980 and $9,120. There were a couple of occasions where the price tried to pass below the support level and one time that it tried to break above the resistance. However, the volatility skyrocketed in the past 12 hours, as Bitcoin first dropped significantly, reaching $8,900, only to recover and push to $9,200.
Bitcoin seems to be stopped at the $9,251 resistance level, and people should look for how the price movement unfolds after that. Trading when Bitcoin moves within a range, or trading breakout confirmations and pullbacks is the easiest way to net a profit.
BTC/USD 4-hour Chart
Technical factors:
- Price is above its 50-period EMA and its 21-period EMA
- Price is above the top B.B.
- RSI at the upper levels (62.4)
- Increased Volume
Key levels to the upside Key levels to the downside
1: $9,251 1: $9,120
2: $9,580 2: $8,980
3: $9,735 3: $8,820
Ethereum
Ethereum’s price movements looked a lot like Bitcoin’s, except that it made an even bigger gain on the daily. The second-largest cryptocurrency by market cap had strong support at $225.4 from which it bounced up, reaching $235. However, the momentum dwindled, and Ethereum is unsure of whether it will continue its move up. For now, the price is consolidating at around $233.
Ethereum traders should look for an opportunity in trading pullbacks or confirmations from ETH contesting the trend (if it manages to reach the bottom trend line).
ETH/USD 4-hour Chart
Technical Factors:
- Price above the 50-period EMA and the 21-period EMA
- Price above the upper B.B.
- RSI almost in the overbought territory (67.2)
- Increased volume
Key levels to the upside Key levels to the downside
1: $228 1: $225.4
2: $240 2: $217.7
3: $251.4 3: $198
Ripple
The third-largest cryptocurrency by market cap finally gathered enough bull presence to make a move towards the upside. Sparked up by Bitcoin’s movements, XRP broke out of the descending trend (for now) and reached past the $0.178 support level. While the move seems to be over, due to buyer exhaustion, XRP managed to reach $0.182 levels, which should make it safe from immediately falling under $0.178 (at least in the short term).
XRP/USD 4-hour Chart
Technical factors:
- XRP in a mid-term descending trend (though it broke the trend in the short-term)
- XRP lacks strong support levels below $0.178
- Price is above the 21 and 50-period EMA
- Price is above the upper B.B.
- RSI is in the overbought territory (71.2)
- Increased volume
Key levels to the upside Key levels to the downside
1: $0.178 1: $0.147
2: $0.19
3: $0.2
Related posts
 Daily Crypto Review, Feb 21 – Morgan Stanley dipping its toes into crypto? Analysts still confused by the price drop
 Daily Crypto Review, Mar 4 – Bitcoin and Altcoins Recover, Look for Further Strength
 Daily Crypto Review, July 22 – Ethereum Passes Bitcoin and Becomes the Most Used Blockchain
 Daily Crypto Review, July 24 – Bitcoin Above $10,000; Ethereum Passing $300